
 设为首页
设为首页 加入收藏
加入收藏

Wind Field Verification for Array Weather Radar at Changsha Airport
-
摘要: 利用2019年4—9月高时空分辨率的长沙机场阵列天气雷达资料开展三维变分(three-dimensional variational data assimilation,3DVAR)风场反演研究。为验证该算法的反演效果,选取外场试验中10次降水过程,在阵列天气雷达的三维精细探测区内,采用阵列天气雷达合成风场和1部L波段边界层风廓线雷达产品作为参考值对阵列反演风场进行验证评估。结果表明:在稳定性降水条件下,阵列反演风场与阵列合成风场、风廓线雷达产品的结果较为一致;在对流性降水条件下,由于不均匀性会造成风廓线测风精度下降,风廓线雷达产品与阵列反演风场和阵列合成风场差异较大。阵列反演风场与阵列合成风场在稳定性、对流性降水条件下水平风速相对偏差分别低于19%,29%,水平风向差分别低于14.92°,26.35°,稳定性降水条件下阵列反演风场更优,误差在可接受范围内。两种算法得到的风场结构符合各类天气系统的基本特征,水平风场空间分布和风速、风向非常接近。Abstract: Synthesizing or retrieving the radial velocity of weather radar can obtain a three-dimensional wind field, which is an important research direction in radar meteorology. A fine three-dimensional wind field helps to study the structure and motion characteristics of small-scale and meso-scale weather systems. Array weather radar (AWR) consists of three-phased array transmit-receive subarrays (referred as transceiver subarrays), which is used for synchronous detection. AWR data are of high temporal and spatial resolution, thus ensuring the correctness of wind field synthesis and retrieval.According to domestic and aboard research, three-dimensional variational data assimilation (3DVAR) wind field retrieval algorithm is quite mature. Using AWR data of 10 rainfall cases at Changsha airport from April to September in 2019, the wind field is retrieved and evaluated. In the three-dimensional fine detection area of the AWR, detection data of a L-band boundary layer wind profile radar and the AWR synthetic wind field are used as reference value to evaluate the retrieved wind field.Results show that the retrieved wind field, the synthetic wind field, and wind profile radar product are more consistent and reasonable in stable precipitation process. In addition, the result error is larger in convective precipitation. The unevenness of the environmental wind field in convective precipitation can reduce the accuracy of wind measurement, and therefore it is not enough to explain the rationality of the AWR retrieved wind field. The wind profile radar is quite different from the AWR retrieved and the synthetic wind field. For different precipitation types, the wind field structure retrieved by AWR and the wind field obtained by AWR synthetic wind field are consistent with the basic characteristics of various weather systems. The spatial distribution and size direction of the horizontal wind field of two algorithms are very close. Error results show that the relative deviation of horizontal wind speed in the stable and convective precipitation is less than 19% and 29%, and the difference of horizontal wind direction is lower than 14.92° and 26.35°, respectively. The error is within the acceptable range. Compared with the AWR synthetic wind field, the retrieved wind field result during stable precipitation process is better than that during convective precipitation process.
-
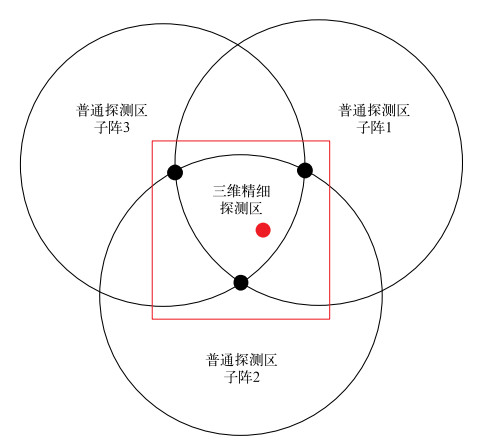
图 1 3个收发子阵阵列天气雷达布局及探测区示意图
(红色矩形为3DVAR风场反演范围,红色圆点为机场风廓线雷达站点)
Fig. 1 Deployment diagram and spatial detection schematic diagram of the AWR consisting of three transmit-receive subarrays
(the red rectangle denotes the 3DVAR wind field retrieval area, the red dot denotes the wind profile radar station at the airport)
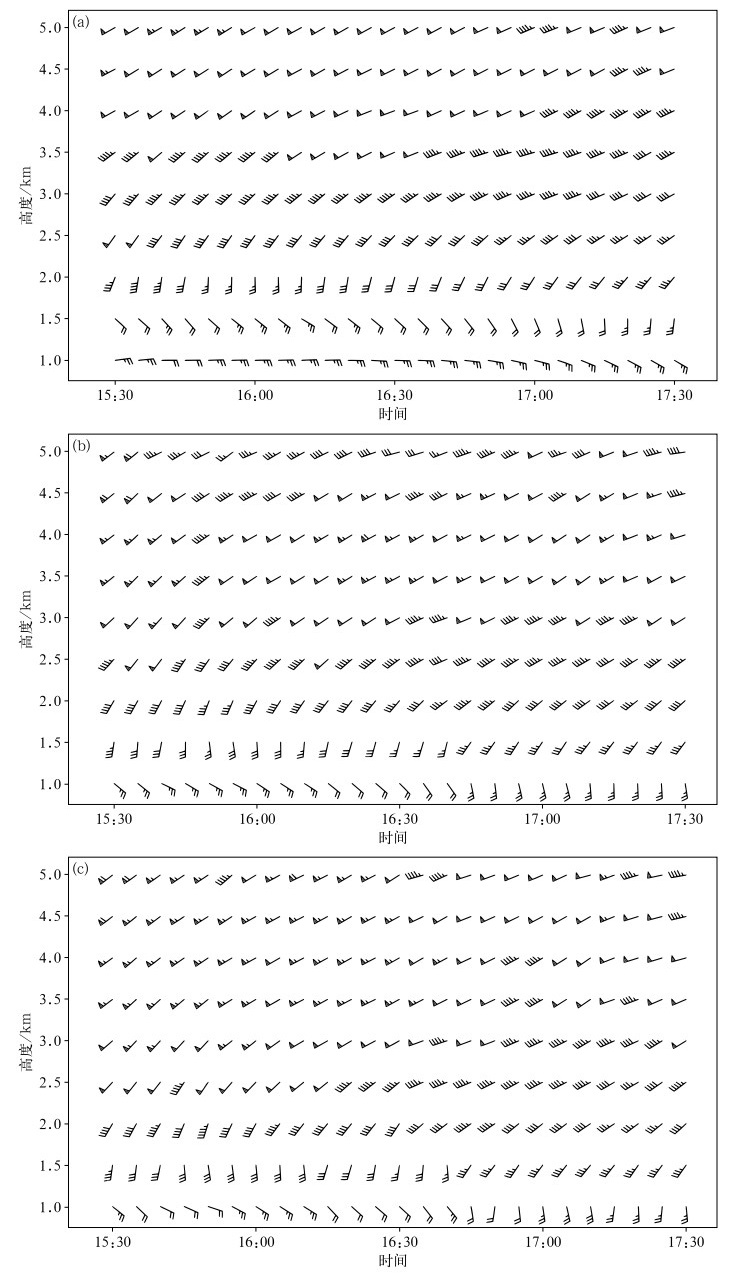
图 2 2019年5月12日15:30—17:30不同高度的水平风场
(a)风廓线雷达产品,(b)阵列反演风场,(c)阵列合成风场
Fig. 2 Horizontal wind field at different heights during 1530—1730 BT on 12 May 2019
(a)wind profile radar products, (b)the AWR retrieval wind field, (c)the AWR synthetic wind field

图 3 2019年4月26日18:00—20:00不同高度的水平风场
(a)风廓线雷达产品,(b)阵列反演风场,(c)阵列合成风场
Fig. 3 Horizontal wind field at different heights during 1800—2000 BT on 18 Aug 2019
(a)wind profile radar products, (b)the AWR retrieval wind field, (c)the AWR synthetic wind field
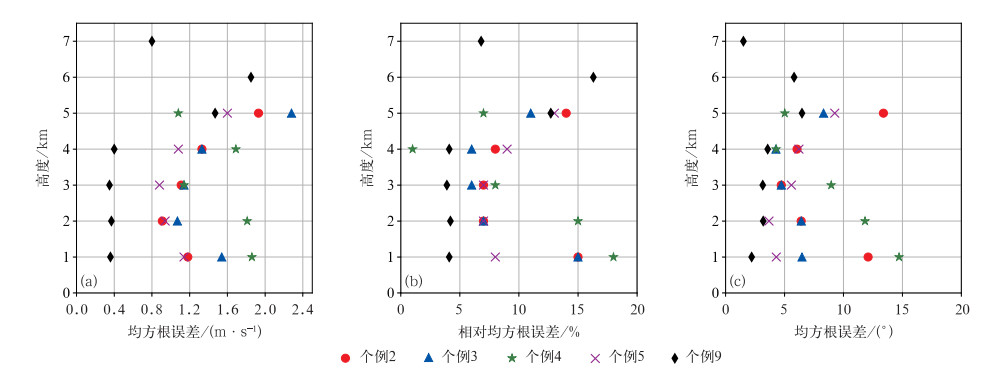
图 4 5个稳定性降水个例误差
(a)水平风速均方根误差,(b)水平风速相对均方根误差,(c)水平风向均方根误差
Fig. 4 Error charts of 5 stable precipitation cases
(a)horizontal wind speed root mean square error, (b)horizontal wind speed relative root mean square error, (c)horizontal wind direction root mean square error
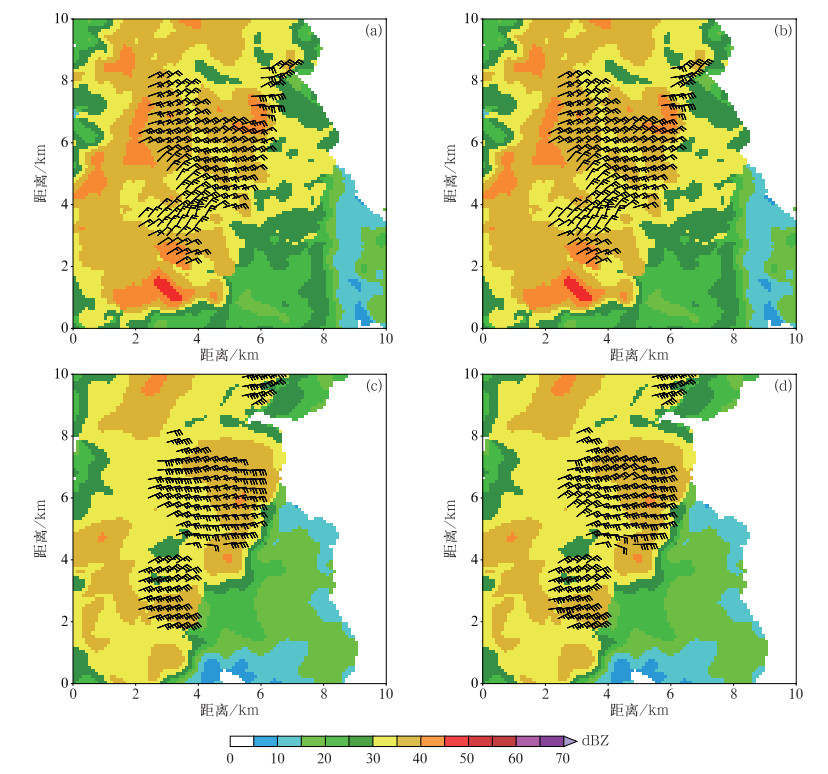
图 5 2019年8月25日17:05:12阵列合成风场和阵列反演风场不同高度的水平风矢(填色为反射率因子)
(a)阵列合成风场, 3 km高度,(b)阵列反演风场, 3 km高度,(c)阵列合成风场, 5 km高度, (d)阵列反演风场, 5 km高度
Fig. 5 Horizontal wind for the AWR synthetic wind field and the AWR retrieved wind field at 170512 BT 25 Aug 2019 (the shaded is the reflectivity factor)
(a)the AWR synthetic wind field, 3 km height, (b)the AWR retrieved wind field, 3 km height, (c)the AWR synthetic wind field, 5 km height, (d)the AWR retrieved wind field, 5 km height

图 6 5个对流性降水个例误差
(a)水平风速均方根误差,(b)水平风速相对均方根误差,(c)水平风向均方根误差
Fig. 6 Error charts of 5 stable precipitation cases
(a)horizontal wind speed root mean square error, (b)horizontal wind speed relative root mean square error, (c)horizontal wind direction root mean square error

图 7 2019年8月21日14:52:00阵列合成风场和阵列反演风场不同高度的水平风矢(填色为反射率因子)
(a)阵列合成风场, 3 km高度,(b)阵列反演风场, 3 km高度,(c)阵列合成风场, 5 km高度, (d)阵列反演风场, 5 km高度
Fig. 7 Horizontal wind for the AWR synthetic wind field and the AWR retrieved wind field at 145200 BT 21 Aug 2019 (the shaded is reflectivity factor)
(a)the AWR synthetic wind field, 3 km height, (b)the AWR retrieved wind field, 3 km height, (c)the AWR synthetic wind field, 5 km height, (d)the AWR retrieved wind field, 5 km height
表 1 降水个例及描述
Table 1 Precipitation cases and description
降水个例 时间 降水类型 与风廓线雷达产品对比时段 对比分析时刻 1 2019-04-26T17:50—20:00 对流性降水 18:00—20:00 19:00:00 2 2019-04-29T13:00—14:30 稳定性降水 13:15—14:15 13:35:12 3 2019-05-12T15:30—18:00 稳定性降水 15:30—17:30 16:30:00 4 2019-06-01T13:00—14:30 稳定性降水 13:00—13:50 13:20:00 5 2019-07-12T12:20—14:30 稳定性降水 12:25—13:05 12:47:12 6 2019-07-19T14:00—15:50 对流性降水 14:30—15:20 14:50:00 7 2019-08-18T18:00—19:30 对流性降水 18:35—19:05 18:55:12 8 2019-08-21T14:00—16:00 对流性降水 降水回波未经过风廓线 14:52:00 9 2019-08-25T16:50—18:20 稳定性降水 16:55—17:15 17:05:12 10 2019-09-10T17:50—19:00 对流性降水 18:00—18:30 18:15:12  下载: 导出CSV
表 2 不同子阵连线上中点位置的径向速度一致性分析
Table 2 Radial velocity consistency analysis of the midpoint position on the connecting line of different subarrays
高度/km A点径向速度/(m·s-1) B点径向速度/(m·s-1) C点径向速度/(m·s-1) 子阵1 子阵2 子阵1 子阵3 子阵2 子阵3 1.0 2.43 -2.53 7.62 -8.09 5.64 -6.75 1.5 -11.86 9.84 6.58 -5.18 7.19 -7.42 2.0 -19.41 17.30 -14.17 12.03 6.70 -8.09 2.5 -19.13 17.66 -18.94 16.59 3.02 -4.69 3.0 -20.48 18.60 -21.43 18.92 4.60 -5.24 3.5 -19.46 17.13 -20.98 18.95 2.46 -3.06 4.0 -17.84 16.89 -19.78 17.38 1.97 -1.63 4.5 -17.25 16.34 -16.56 15.67 2.94 -3.85 5.0 -15.94 14.04 -15.50 15.84 2.99 -3.55
下载: 导出CSV
表 3 个例分析时段内阵列反演风场与风廓线雷达产品水平风速和水平风向的平均绝对偏差、均方根误差和相对均方根误差
Table 3 Mean absolute deviation, root mean square error and relative root mean square error of horizontal wind speed and direction of the AWR retrieved wind field and wind profile radar products in the case analysis period
降水个例 分析时段 水平风速 水平风向 平均绝对偏差/ (m·s-1) 均方根误差/ (m·s-1) 相对均方根误差/% 平均绝对偏差/(°) 均方根误差/(°) 2 2019-04-29T13:15—14:15 2.85 3.27 24 7.15 10.06 3 2019-05-12T15:30—17:30 3.74 3.21 20 10.81 15.87 4 2019-06-01T13:00—13:50 3.96 3.48 29 9.19 15.55 5 2019-07-12T12:25—13:05 2.10 2.91 19 5.72 7.56 9 2019-08-25T16:55—17:15 1.28 3.92 31 9.42 17.49
下载: 导出CSV
表 4 个例分析时段内阵列反演风场与风廓线雷达产品水平风速和水平风向的平均绝对偏差、均方根误差和相对均方根误差
Table 4 Mean absolute deviation, root mean square error and relative root mean square error of horizontal wind speed and direction of the AWR retrieved wind and wind profile radar products in the case analysis period
降水个例 分析时段 水平风速 水平风向 平均绝对偏差/ (m·s-1) 均方根误差/ (m·s-1) 相对均方根误差/% 平均绝对偏差/(°) 均方根误差/(°) 1 2019-04-26T18:00—20:00 2.07 3.47 44 47.60 41.46 6 2019-07-19T14:30—15:20 1.96 2.66 56 42.82 33.88 7 2019-08-18T18:35—19:05 2.94 5.57 55 55.89 58.24 10 2019-09-10T18:00—18:30 1.52 4.54 73 39.79 52.89
下载: 导出CSV
-
[1] Armijo L.A theory for the determination of wind and precipitation velocities with Doppler radars.J Atmos Sci, 1969, 26(3):570-573. doi: 10.1175/1520-0469(1969)026<0570:ATFTDO>2.0.CO;2 [2] Ray P S, Ziegler C L, Bumgarner W, et al.Single and multiple-Doppler radar observations of tornadic storms.Mon Wea Rev, 1980, 108(10):1607-1625. doi: 10.1175/1520-0493(1980)108<1607:SAMDRO>2.0.CO;2 [3] 韩颂雨, 罗昌荣, 魏鸣, 等.三雷达、双雷达反演降雹超级单体风暴三维风场结构特征研究.气象学报, 2017, 75(5):757-770. http://www.wanfangdata.com.cn/details/detail.do?_type=perio&id=qxxb201705006 [4] Lhermitte R M, Gilet M.Dual-Doppler radar observation and study of sea breeze convective storm development.J Appl Meteor, 2010, 14(7):1346-1361. http://adsabs.harvard.edu/abs/1975JApMe..14.1346L [5] Chong M, Amayenc P, Scialom G, et al.A tropical squall line observed during the COPT 81 experiment in West Africa.Part 1:Kinematic structure inferred from dual-Doppler radar data.Mon Wea Rev, 1987, 115(3):1696. http://onlinelibrary.wiley.com/resolve/reference/ADS?id=1987MWRv..115..670C [6] Fankhauser J C, Barnes G M, Lemone M A.Structure of a midlatitude squall line formed in strong unidirectional shear.Mon Wea Rev, 1992, 120(2):237-260. doi: 10.1175/1520-0493(1992)120<0237:SOAMSL>2.0.CO;2 [7] 刘黎平.用双多普勒雷达反演降水系统三维风场试验研究.应用气象学报, 2003, 14(4):502-504. http://qikan.camscma.cn/article/id/20030463 [8] 刘黎平, 张沛源, 梁海河, 等.双多普勒雷达风场反演误差和资料的质量控制.应用气象学报, 2003, 14(1):17-29. http://qikan.camscma.cn/article/id/20030103 [9] 罗昌荣, 池艳珍, 周海光.双雷达反演台风外围强带状回波风场结构特征研究.大气科学, 2012, 36(2):35-46. http://www.wanfangdata.com.cn/details/detail.do?_type=perio&id=daqikx201202003 [10] Scialom G, Lemaitre Y.A new analysis for the retrieval of three-dimensional mesoscale wind fields from multiple Doppler radar.J Atmos Oceanic Technol, 1990, 7(5):640-665. doi: 10.1175/1520-0426(1990)007<0640:ANAFTR>2.0.CO;2 [11] Gao J, Xue M, Shapiro A, et al.A variational method for the analysis of three-dimensional wind fields from two Doppler radars.Mon Wea Rev, 1999, 127(127):2128-2142. http://adsabs.harvard.edu/abs/1999MWRv..127.2128G [12] Gao J, Xue M, Brewster K, et al.A three-dimensional variational data analysis method with recursive filter for Doppler radars.J Atmos Oceanic Technol, 2004, 21(3):457-469. doi: 10.1175/1520-0426(2004)021<0457:ATVDAM>2.0.CO;2 [13] Liou Y C, Chang Y J.A variational multiple-Doppler radar three-dimensional wind synthesis method and its impacts on thermodynamic retrieval.Mon Wea Rev, 2009, 137(11):3992-4010. doi: 10.1175/2009MWR2980.1 [14] 王艳春, 王红艳, 刘黎平.华南一次强飑线过程的三维变分风场反演效果分析.暴雨灾害, 2014, 33(4):305-312. http://www.wanfangdata.com.cn/details/detail.do?_type=perio&id=hbqx201404001 [15] 王艳春, 王红艳, 刘黎平.三维变分方法反演风场的效果检验.高原气象, 2016, 35(4):1087-1101. http://www.wanfangdata.com.cn/details/detail.do?_type=perio&id=gyqx201604022 [16] Liu S, Qiu C J, Xu Q, et al.An improved method for Doppler wind and thermodynamic retrievals.Adv Atmos Sci, 2005, 22(1):90-102. doi: 10.1007/BF02930872 [17] Shapiro A, Potvin C K, Gao J.Use of a vertical vorticity equation in variational dual-Doppler wind analysis.J Atmos Oceanic Technol, 2009, 26(10):2089-2106. doi: 10.1175/2009JTECHA1256.1 [18] Potvin C K, Shapiro A, Xue M.Impact of a vertical vorticity constraint in variational dual-Doppler wind analysis:Tests with real and simulated supercell data.J Atmos Oceanic Technol, 2011, 29(29):32-49. http://adsabs.harvard.edu/abs/2012JAtOT..29...32P [19] 张沛源, 周海光, 胡绍萍.双多普勒天气雷达风场探测的可靠性研究.应用气象学报, 2002, 13(4):485-496. http://qikan.camscma.cn/article/id/20020464 [20] 马舒庆, 陈洪滨, 王国荣, 等.阵列天气雷达设计与初步实现.应用气象学报, 2019, 30(1):1-12. doi: 10.11898/1001-7313.20190101 [21] 张沛源, 何平, 宋春梅, 等.三部多普勒天气雷达联合测量大气风场的误差分布及最佳布局研究.气象学报, 1998, 56(1):96-103. http://www.wanfangdata.com.cn/details/detail.do?_type=perio&id=QK199800465454 [22] 魏万益, 马舒庆, 杨玲, 等.长沙机场阵列天气雷达地物识别算法.应用气象学报, 2020, 31(3):339-349. doi: 10.11898/1001-7313.20200308 [23] Shapiro A, Ellis S, Shaw J.Single-Doppler velocity retrievals with phoenix Ⅱ data:Clear air and microburst wind retrievals in the planetary boundary layer.J Atmos Sci, 1995, 52(9):1265-1287. doi: 10.1175/1520-0469(1995)052<1265:SDVRWP>2.0.CO;2 [24] North K W, Oue M, Kollias P, et al.Vertical air motion retrievals in deep convective clouds using the ARM scanning radar network in Oklahoma during MC3E.Atmospheric Measurement Techniques, 2017, 10(8):2785-2806. doi: 10.5194/amt-10-2785-2017 [25] Fang M, Dovial R J, Melnikov V.Spectrum width measured by WSR-88D:Error sources and statistics of various weather phenomena.J Atmos Oceanic Technol, 2004, 21(6):888-904. doi: 10.1175/1520-0426(2004)021<0888:SWMBWE>2.0.CO;2 [26] 王欣, 卞林根, 彭浩, 等.风廓线仪系统探测试验与应用.应用气象学报, 2005, 16(5):693-698. http://qikan.camscma.cn/article/id/20050590 [27] 林晓萌, 何平, 黄兴友.一种抑制降水对风廓线雷达水平风干扰的方法.应用气象学报, 2015, 26(1):66-75. doi: 10.11898/1001-7313.20150107 [28] 林晓萌, 尉英华, 陈宏, 等.降水时风廓线雷达风场反演效果评估.应用气象学报, 2020, 31(3):361-372. doi: 10.11898/1001-7313.20200310 [29] 邓闯, 阮征, 魏鸣, 等.风廓线雷达测风精度评估.应用气象学报, 2012, 23(5):13-23. http://qikan.camscma.cn/article/id/20120502 -

 点击查看大图
计量
- 摘要浏览量: 1331
- HTML全文浏览量: 453
- PDF下载量: 177
- 被引次数: 0
