
 设为首页
设为首页 加入收藏
加入收藏

0679香山局地大暴雨的中小尺度天气分析
Mesoscale and Microscale Analysis on a Local Torrential Rain Event in Fragrant Hills Area of Beijing on July 9, 2006
-
摘要: 利用Doppler雷达、地面自动站、Profile垂直风廓线及GPS水汽分布等多种新型探测资料, 对2006年7月9日夜间发生在北京西郊香山附近的局地大暴雨天气的影响系统和γ-中尺度强降雨落区形成的动力机理进行了精细分析。对雷达等本地多种探测资料的精细研究表明:地形辐合回波带是造成这次过程的主要影响系统。地形辐合回波带上中气旋回波块的滚动更迭是大暴雨落区形成的直接原因; 近地面辐合对大暴雨落区强降雨的发生具有重要作用。大暴雨落区形成阶段近地面3种辐合同时存在:平原东南风与山区偏北风风向切变辐合、平原东南风在山脉阻挡作用下的抬升辐合、大暴雨落区中心的γ-中尺度气旋性辐合。研究还表明:山前近地面地形辐合扰动, 向上传播, 引发边界层扰动的动力过程是香山大暴雨落区形成的主要动力源, 而来自东南方向近地面层的暖湿平流为大暴雨提供了有效的水汽和能量。Abstract: The local rainstorm in fragrant hills area of western Beijing at night on July 9, 2006 is an intense rainfall event, which covers only around 10 to 20 kilometers, and the severe rain lasts only 2 hours. Considering the temporal and spatial scale and the distribution of the rainfall, it is difficult to analyze and describe by regular meteorological data and synoptic-dynamic diagnosis methods even mesoscale dynamic models. Therefore, it is studied by intensified observation data including Doppler weather radar products, wind profile data, wind element of surface automatic weather stations and detection data of atmospheric water vapor by GPS, etc. It is found that development of the meso-γ scale heavy rain, even the disturbance in surface and boundary layer around the rainfall area, can be captured by the above mentioned data. Moreover, meso-scale convective system of the local heavy rain event and dynamic mechanism forming severe rain can also be explained by these data exactly.Fine research on the local heavy rain event by these observation data shows that topographic convergence line is proved to be the major system that causes the local torrential rainfall, and the formation and development of mesocyclone in the echo belt by topographic convergence line is the main factor causing the heavy rain. Convergence in atmospheric surface layer is very important in the local heavy rain event. Besides, the studies show that topographic convergence disturbance in surface layer in front of the mountain spreads upward giving rise to boundary layer disturbance which is the main dynamic factor of the heavy rain in fragrant hills zone. Sufficient water vapor and energy for the heavy rainstorm are provided by warm-moist advection of atmospheric surface layer from southeast.From the above analysis, it is concluded: Against the large scale background of warm-moist airflow ahead of long-wave trough in middle troposphere about 500 hPa in the daytime in summer and weak anti-cyclone wind in low layer in Beijing, topographic convergence echo belts can be formed by formation and development of southeast wind in surface layer at dusk on the plain. Meso-γ scale echoes with features of mesocyclone in the echo belts move and develop from southwest to northeast along southwest airflow ahead of 500 hPa long-wave trough. It is the major cause that brings the local rainstorm in fragrant hills area of Beijing at night on July 9, 2006. Convergence in atmospheric surface layer plays an important role in the local heavy rain event. There are three types of convergence simultaneously during the severe rain period of two hours: Wind shear convergence between the southeast wind from the plain and the north wind from the mountains, convergence and lifting of the southeast wind from the plain by mountains, and cyclonic convergence of meso-γ scale system in the center of rainfall region. Fine research on wind profile data around heavy rainfall region shows that there are disturbance in surface layer and it spreads upward, then boundary layer disturbance appears twice during the severe rain period during the two hours. Each propagation is about one hour and twenty minutes. It is one of the main dynamic mechanisms that cause the local heavy rain to occur. According to GPS water vapor data and Doppler radar velocity products, there warm-moist airflow in atmospheric surface layer from southeast to the core of the heavy rainstorm before and during the torrential rain.
-
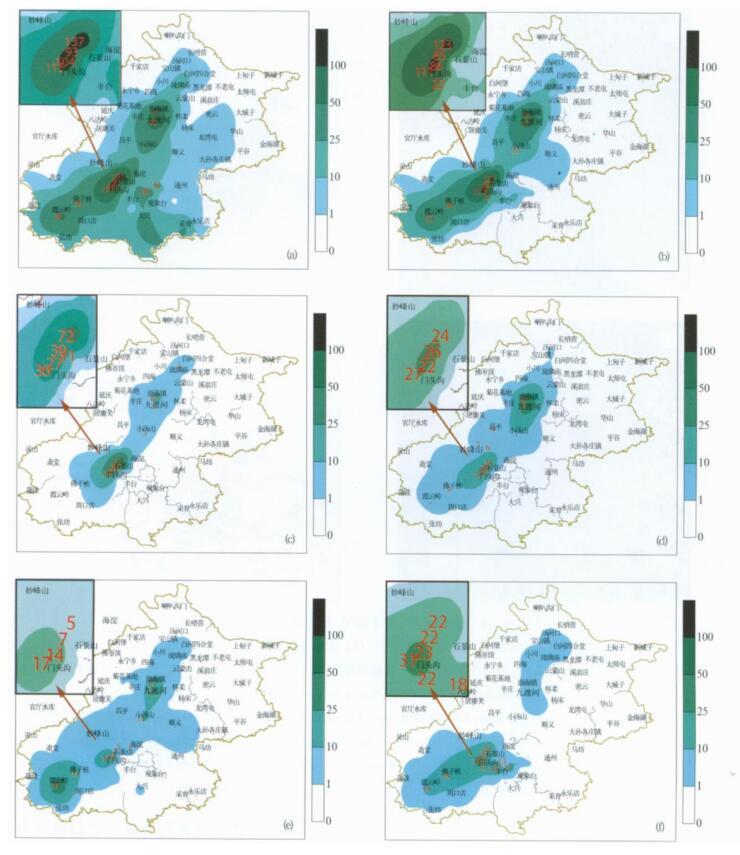
图 1 2006年7月9日香山局地大暴雨过程总雨量图及逐小时雨量图 (单位: mm)
(a) 9日21:00—10日04:00, (b) 9日21:00—10日01:00, (c) 9日21:00—22:00, (d) 9日22:00—23:00, (e) 9日23:00—10日00:00, (f) 10日00:00—01:00
Fig. 1 Total precipitation and precipitation hourly during severe rain period of the local rainstorm in Xiangshan zone (unit: mm)
(a) 21:00 Jul 9—04:00 Jul 10, 2006, (b) 21:00 Jul 9—01:00 Jul 10, 2006, (c) 21:00Jul 9—22:00 Jul 9, 2006, (d) 22:00 Jul 9—23:00 Jul 9, 2006, (e) 23:00 Jul 9—00:00 Jul 10, 2006, (f) 00:00 Jul 10—01:00 Jul 10, 2006

图 2 北京南郊Doppler雷达组合反射率因子、地面自动站测风及北京地形对比图
(a) 2006年7月9日21:01雷达组合反射率因子, (b) 北京地形图, (c) 2006年7月9日21:20雷达组合反射率因子, (d) 2006年7月9日21:00自动站地面测风图 (图中红色曲线为地面风场弱辐合切变线)
Fig. 2 Radar composite reflectivity factor by Doppler weather radar in south Beijing, wind element from surface automatic weather stations and terrain of Beijing (a) radar composite reflectivity factor intensity at 21:01 on Jul 9, 2006, (b) Beijing topographic map, (c) radar composite reflectivity factor intensity at 21:20 on Jul 9, 2006, (d) wind element of surface automatic weather stations at 21:00 on Jul 9, 2006 (the red curve shows the wind convergence line)
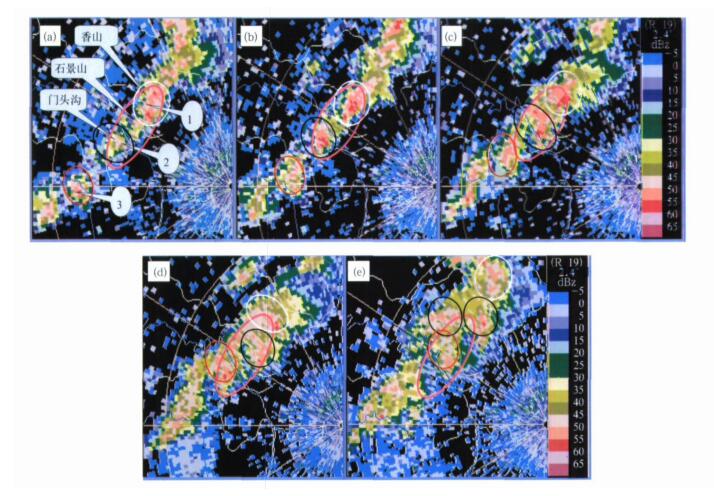
图 3 2006年7月9日大暴雨落区雨强最大阶段南郊Doppler雷达2.4°仰角反射率因子变化追踪图
(a) 9日21:20, (b) 9日21:32, (c) 9日21:50, (d) 9日22:08, (e)9日22:30(粉红色椭圆圈为香山大暴雨落区; 白色椭圆圈为1号回波块; 黑色椭圆圈为2号回波块; 红色椭圆圈为3号回波块)
Fig. 3 Trace pictures of radar reflectivity factor (elevation:2.4°) by Doppler weather radar in south Beijing during severe rain period in heavy rainfall region
(a) 21:20 Jul 9, 2006, (b) 21:32 Jul 9, 2006, (c) 21:50 Jul 9, 2006, (d) 22:08 Jul 9, 2006, (e) 22:30 Jul 9, 2006(the pink elliptical circle shows the heavy rainfall region, the white elliptical circle is echo No.1, the black one is echo No.2, the red one is echo No.3)

图 4 2006年7月9日大暴雨落区北京南郊Doppler雷达综合产品中气旋分析
(a) 21:32 2.4°仰角回波径向速度图, (b) 21:38 2.4°仰角回波径向速度图, (c) 21:44 2.4°仰角回波径向速度图, (d) 21:32垂直液态水含量, (e) 21:32最大回波顶高 (黄色大椭圆圈为香山大暴雨落区, 小白椭圆圈为中气旋回波位置)
Fig. 4 Mesocyclone analysis on the local rainstorm from comprehensive products of Doppler weather radar in south Beijing on Jul 9, 2006 (a) Doppler radar echo reflectivity velocity picture at 21:32 (elevation:2.4°), (b) Doppler radar echo reflectivity velocity picture at 21:38 (elevation:2.4°), (c) Doppler radar echo reflectivity velocity picture at 21:44 (elevation:2.4°), (d) vertical integrated liquid content at 21:32, (e) height of maximum echo tops at 21:32 (the yellow elliptical circle shows the heavy rainfall region, the white one is position of mesocyclone echo)
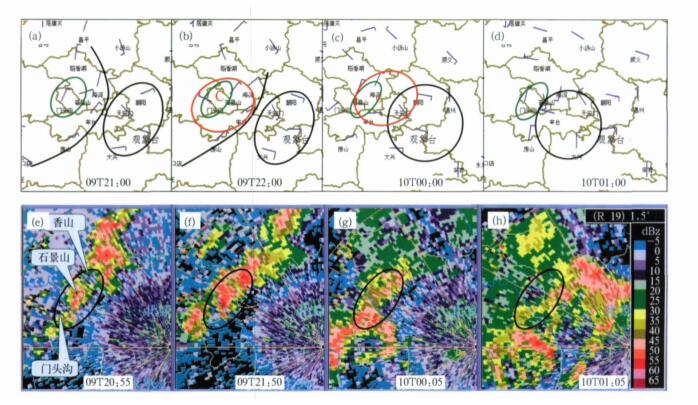
图 5 2006年7月9—10日北京自动站地面风场和南郊Doppler雷达1.5°仰角反射率因子追踪对比图 (a)~(d) 地面风场
(小绿椭圆圈为大暴雨落区; 黑色曲线为平原东南风与山区偏北风切变线; 大黑椭圆圈为平原风变化区; 红椭圆圈为大暴雨落区γ-中尺度气旋性辐合区; C为辐合中心), (e)~(h) 雷达组合反射率因子 (黑椭圆圈为香山大暴雨落区)
Fig. 5 Surface wind element from automatic weather stations and trace of composite reflectivity factor of Doppler weather radar in south Beijing on Jul 9—10, 2006 (a)—(d) surface wind element from automatic weather stations
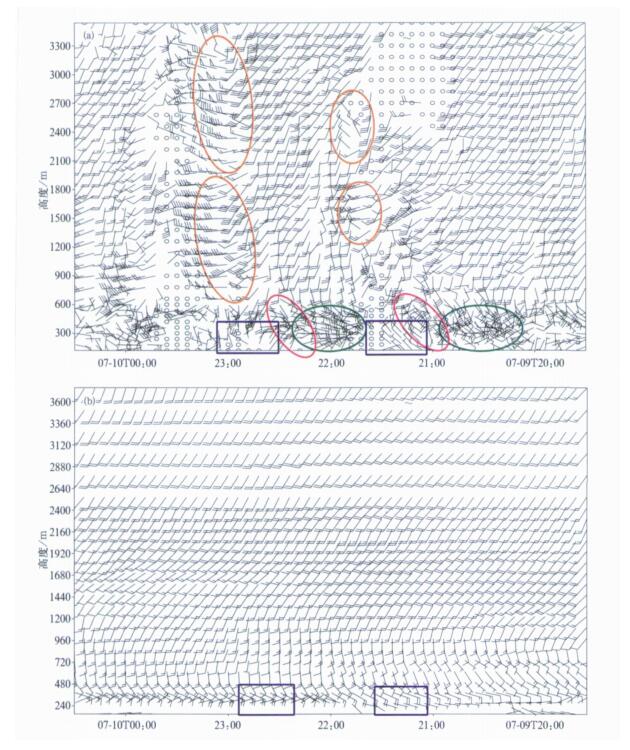
图 6 2006年7月9日19:30—10日00:30海淀站 (a) 和观象台 (b) 6 min间隔风廓线图
(绿色椭圆圈所示为海淀站近地面东南风加强时段; 粉红色椭圆圈所示为海淀站近地面小扰动发生时段; 蓝色矩形所示为海淀站近地面小扰动后偏北风与南部观象台近地面东南风风向辐合时段; 黄色椭圆圈所示为海淀站小扰动向边界层传播时段)
Fig. 6 Wind profilers at Haidian (a) and Guanxiangtai (b) stations every 6 minutes from 19:30 Jul 9 to 00:30 Jul 10, 2006
(the green elliptical circle shows the increasing period of surface south-east wind at Haidian station; the pink one shows the period of surface disturbance; the blue rectangle shows the wind convergence period between the north wind after surface disturbance at Haidian station and surface east wind at Guanxiangtai; the yellow elliptical circle is the period when surface disturbance spread to boundary layer at Haidian station)
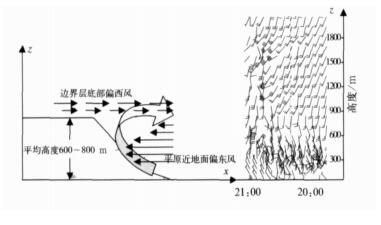
图 7 大暴雨落区附近近地面垂直风廓线分布地形作用概念图
Fig. 7 Topographic influence on distribution of surface vertical wind profilers in heavy rainfall region
-
[1] 毕宝贵.中尺度地形对陕南暴雨的影响研究.南京:南京信息工程大学, 2004. [2] 陶诗言.中国之暴雨.北京:科学出版社, 1980. [3] 孙淑清, 马廷标, 孙纪改.低空急流与暴雨相互关系的对比分析.气象学报, 1979, 37(4): 36-44. http://www.cnki.com.cn/Article/CJFDTOTAL-QXXB197904004.htm [4] 孙淑清, 翟国庆.低空急流的不稳定性及其对暴雨的触发作用.大气科学, 1980, 4(4): 327-337. http://www.cnki.com.cn/Article/CJFDTOTAL-DQXK198004005.htm [5] Ninomiya K, Akiyama T, Ikawa M. Evolution and fine structure of a long-lived meso-α scale convective system in Baiu front zone. Part Ⅰ: Evolution and meso-β-scale characteristics. J Meteor Soc Japan, 1988, 66: 331-350. http://cat.inist.fr/?aModele=afficheN&cpsidt=6980599 [6] Ninomiya K, Akiyama T, Ikawa M. Evolution and fine structure of a long-lived meso-α scale convective system in Baiu front zone. Part Ⅱ: Evolution and meso-γ-scale characteristics of precipitation. J Meteor Soc Japan, 1988, 66: 351-371. [7] Shibagaki Y, Yabanaka M D, Shimizu S, et al. Meso-β to meso-γ-scale wind circulations associated with precipitating clouds near Beiu front observed by the MU and meteorological radars. J Meteor Soc Japan, 2000, 78: 69-91. [8] 周海光, 王玉彬.2003年6月30日梅雨锋大暴雨β和γ中尺度结构的双多普勒雷达反演.气象学报, 2005, 63(3): 301-312. http://kns.cnki.net/KCMS/detail/detail.aspx?dbcode=CJFQ&dbname=CJFD2005&filename=QXXB200503005&v=MDA1ODBGckNVUkwyZlpPUnRGeXZnVWI3UE5EWFRiTEc0SHRUTXJJOUZZWVI4ZVgxTHV4WVM3RGgxVDNxVHJXTTE= [9] 倪允琪, 周秀骥.中国长江流域中下游梅雨锋暴雨形成机理及监测与预测理论和方法研究.气象学报, 2005, 63(3): 647-661. http://www.cnki.com.cn/Article/CJFDTOTAL-QXXB200405011.htm [10] 冯伍虎.强暴雨中尺度系统发展结构和机理的非静力数值模式模拟研究.兰州:兰州大学, 2006. [11] 王令, 康玉霞, 焦热光, 等.北京地区强对流天气雷达回波特征.气象, 2004, 30(7): 31-36. http://www.cnki.com.cn/Article/CJFDTOTAL-QXXX200407006.htm [12] 俞小鼎, 郑媛媛, 张爱民, 等.安徽一次强烈龙卷的多普勒天气雷达分析.高原气象, 2006, 25(5): 914-924. http://www.cnki.com.cn/Article/CJFDTOTAL-GYQX200605019.htm [13] 刘黎平, 阮征, 覃丹宇.长江流域梅雨锋暴雨过程的中尺度结构个例分析.中国科学 (D辑), 2004, 34(12): 1193-1201. http://www.cnki.com.cn/Article/CJFDTOTAL-JDXK20041200C.htm [14] 刘淑媛, 郑永光, 陶祖钰.利用风廓线雷达资料分析低空急流的脉动与暴雨关系.热带气象学报, 2003, 19(3): 285-290. http://cpfd.cnki.com.cn/Article/CPFDTOTAL-BJQX200811001013.htm [15] 王欣, 卞林根, 彭浩, 等.风廓线仪系统探测试验与应用.应用气象学报, 2005, 16(5) : 693-698. http://qikan.camscma.cn/jams/ch/reader/view_abstract.aspx?file_no=20050590&flag=1 [16] 俞小鼎, 姚秀萍, 熊廷南, 等.多普勒天气雷达原理与业务应用.北京:气象出版社, 2006. [17] 朱乾根, 林锦瑞, 寿绍文, 等.天气学原理和方法.北京:气象出版社, 1981. -

 下载:
下载:

 点击查看大图
计量
- 摘要浏览量: 7964
- HTML全文浏览量: 3887
- PDF下载量: 4839
- 被引次数: 0
