
 设为首页
设为首页 加入收藏
加入收藏

交叉定标产生的NOAA卫星长期大气温度观测资料
A Long-term Atmospheric Temperature Dataset Derived from NOAA Microwave Sounding Unit with Cross-calibration
-
摘要: 介绍一套用于气候变化研究的NOAA卫星微波观测资料, 资料为全球5 d平均, 2.5°×2.5°经纬网格, 3个深层大气(对流中层、对流层顶以及平流层下层)的温度分布。该文简介了资料产生的方法, 包括交叉定标、角度订正、网格化以及网格误差修正等, 给出了使用这套资料分析得到的1987—2006年间不同大气层的温度变化趋势, 并提供了获取这套资料的方法。Abstract: The Microwave Sounding Unit(MSU)on board the National Oceanic and Atmospheric Administration(NOAA)polar-orbiting satellites measures the atmospheric temperature from the surface to the lower stratosphere under all weather conditions, excluding precipitation. These instruments are extensively used to determine the atmospheric temperature trend. However, calibration errors are a major source of uncertainties in the trend determination. Recently, NOAA/National Environmental Satellite, Data and Information Services has developed a non-linear sequential calibration method using simultaneous nadir overpass(SNO)to reduce calibration errors and then a long term MSU deep layer atmospheric temperature dataset is generated based on the new calibration. The dataset is introduced, which includes global 5-day averaged deep-layer temperatures for the mid-troposphere, tropopause, and lower-stratosphere with grid resolution of 2.5° latitude by 2.5° longitude. Also, the methodologies for the dataset generation are described, which including cross-calibration, incident angle correction, grid data generation, and bias correction in gridded data. The 20-year climate trends during 1987—2006 for the three layers are obtained from the dataset. Finally, the website for acquiring the dataset is provided.
-
Key words:
- NOAA;
- satellite;
- MSU;
- microwave sounding;
- atmospheric temperature;
- calibration
-
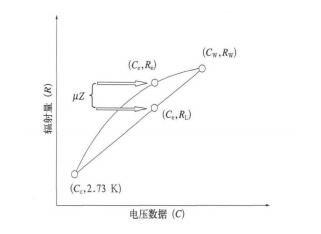
图 1 定标原理
Fig. 1 Schematic viewing the calibration principle of the Microwave Sounding Unit

图 2 用NOAA 11和NOAA 12的SNO亮温比较线性定标和非线性SNO定标效果
(a)线性定标的离散亮温比较,(b)非线性SNO定标的离散亮温比较, (c)对应(a)的两颗卫星亮温差与温度的比较,(d)对应(b)的两颗卫星亮温差与温度的比较(Tl代表线性定标所产生的亮温, Tb代表非线性定标所产生的亮温; N11和N12分别代表NOAA 11和NOAA 12)
Fig. 2 Demonstration of the SNO non-linear calibration effect with scatter plots of the SNO brightness temperatures between NOAA-11 and NOAA-12
(a)Tl scatter plot between NOAA-11 and NOAA-12 with linear calibration,(b)Tb scatter plot between NOAA-11 and NOAA-12 with SNO non-linear calibration,(c)Tl differences between NOAA-12 and NOAA-11 versus NOAA-11 Tl,(d)Tb differences between NOAA-12 and NOAA-11 versus NOAA-11 Tb (Tl represents brightness temperature obtained from linear calibration and Tb is the brightness temperature obtained from the SNO nonlinear calibration; N11 and N12 represent NOAA-11 and NOAA-12, respectively)
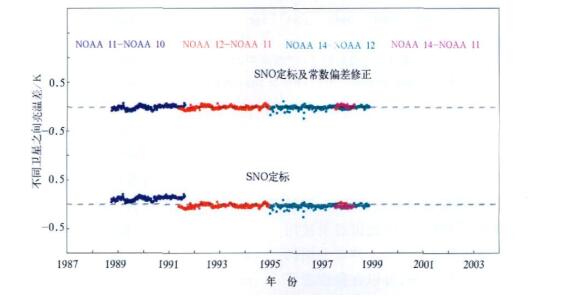
图 3 不同卫星之间的亮温差时间序列
Fig. 3 Brightness temperature difference time series of 5-day and global ocean averages between different satellites
-
[1] Spencer R W, Christy J R. Precision and radiosonde validation of satellite gridpoint temperature anomalies. Part Ⅰ: MSU channel 2. J Climate, 1992, 5: 847-857. doi: 10.1175/1520-0442(1992)005<0847:PARVOS>2.0.CO;2 [2] Spencer R W, Christy J R. Precision and radiosonde validation of satellite gridpoint temperature anomalies. Part Ⅱ : Tropospheric retrieval and trends during 1979--90. J Climate, 1992, 5: 858-866. doi: 10.1175/1520-0442(1992)005<0858:PARVOS>2.0.CO;2 [3] Christy J R, Spencer R W, Lobel E S. Analysis of the merging procedure for the MSU daily temperature time series. J Climate, 1998, 11: 2016-2041. doi: 10.1175/1520-0442-11.8.2016 [4] Christy J R, Spencer R W, Braswell W D. MSU tropospheric temperatures: Dataset construction and radiosonde comparisons. J Atmos Oceanic Technol, 2000, 17: 1153-1170. doi: 10.1175/1520-0426(2000)017<1153:MTTDCA>2.0.CO;2 [5] Christy J R, Spencer R W, Norris W B, et al. Error estimates of version 5.0 of MSU-AMSU bulk atmospheric temperature. J Atmos Oceanic Technol, 2003, 20: 613-629. doi: 10.1175/1520-0426(2003)20<613:EEOVOM>2.0.CO;2 [6] Meats C A, Schabel M C, Wentz F J. A reanalysis of the MSU Channel 2 tropospheric temperature record. J Climate, 2003, 16: 3650-3664. doi: 10.1175/1520-0442(2003)016<3650:AROTMC>2.0.CO;2 [7] Vinnikov K Y, Grody N C. Global warming trend of mean tropospheric temperature observed by satellites. Science, 2003, 302 : 269-272. doi: 10.1126/science.1087910 [8] Grody N C, Vinnikov K Y, Goldberg M D, et al. multi, satellites observations for climate studies Calibration of Sounding Unit(MSU). J Geophys Res, 2004, 109 : D24104, doi: 10.1029/2004JD005079. [9] Fu Q, Johanson C M, Warren S G, et al. Contribution of stratospheric coofing to satellite-inferred tropospheric trends. Nature, 2004, 429: 55-58. doi: 10.1038/nature02524 [10] Mears C A, Wentz F J. The effect of diurnal correction on the satellite-derived lower tropospheric temperature. Science, 2005, 309: 1548-1551. doi: 10.1126/science.1114772 [11] Cao C, Weinreb M, Xu H. Predicting simultaneous nadir overpasses among polar-obiting meteorological satellites for the intersatellite calibration of radiometers. J Atmos Oceanic Technol, 2004, 21: 537-542. doi: 10.1175/1520-0426(2004)021<0537:PSNOAP>2.0.CO;2 [12] Zou C Z, Goldberg M, Cheng Z, et al. Recalibration of microwave sounding unit for climate studies using simultaneous nadir overpasses. J Geophys Res, 2006, 111: D19114, doi: 10. 1029/2005JD006798, issn: 0148-0227. [13] Goldberg M D, Crosby D S, Zhou L. The limb adjustment of AMSU-A observations: Methodology and validation. J Appl Meteor, 2001, 40: 70-83. doi: 10.1175/1520-0450(2001)040<0070:TLAOAA>2.0.CO;2 [14] Zou C Z, Gao M. A 20-year MSU Dataset for Atmospheric Temperature Change Studies. Atmospheric and Environmental Remote Sensing Data Processing and Utilization Ⅲ: Readiness for GEOSS Proc SHE, 2007, 6684: 668403, doi: 10.1117/ 12. 734113. -

 下载:
下载:

 点击查看大图
计量
- 摘要浏览量: 4056
- HTML全文浏览量: 669
- PDF下载量: 1358
- 被引次数: 0
