
 设为首页
设为首页 加入收藏
加入收藏

Characteristics and Evolutions of Probability Distribution of Summer Extreme High Temperatures in China
-
摘要: 针对夏季高温极值分布存在偏态性,利用Box-Cox变换,得到一种偏态概率分布拟合函数。基于偏态分布函数中的偏态指数和最概然高温极值,揭示了我国夏季高温极值的概率分布特征及其在20世纪80年代前后的变化规律,发现我国夏季高温极值的概率分布主要呈正偏分布型,最概然高温极值变化较好地反映了分布型的改变。研究不同时间尺度内极值对偏态指数和最概然高温极值的影响发现,最概然高温极值较为稳定,10年尺度内受极值影响较小,而偏态指数所受影响随着时间尺度的增大而越发显著。Abstract: In view of the non-normal distribution existed in summer extreme high temperature (SEHT) in China, a skewed probability distribution function is proposed to study the SEHT, which derived from Box-Cox Transformation of SEHT data. Based on a skewness index (SI) and the most probable extreme high temperature (MPEHT), the characteristics and evolutionary rules of the probability distributions in the SEHT are described before and after 1980s. The results show that from 1961 to 2008, the probability distributions of the SEHT at most meteorological stations are positive skew, and particularly in the southeastern Southwest China. While the probability distributions show negative skewness in most areas of the south to the middle and lower reaches of the Yangtze River. The highest magnitudes of the SEHT lie in the central-eastern China and the western Northwest China, secondary magnitudes lie in Northeast China and most of Inner Mongolia, and the smallest magnitudes in the central Northwest China and most parts of Southwest China.Before and after 1980s, the probability distribution changes greatly in most parts of central-eastern China, central Southeast China, most of Xinjiang, and northeastern Inner Mongolia, respectively. The results indicate that there are some weakening trends for both positive skewed distribution pattern and negative skewed distribution pattern, and the MPEHT has a common trend to approximate the mean values of the SEHT, which show that the changes of the distribution patterns can reflect some change direction of the MPEHT. There is a significant cooling trend in those areas especially for the MPEHT, while in the secondary or smallest magnitudes regions, obvious warming trend is found.Further study on the responses of SI and MPEMT to different time scales of SHET suggests that sliding removing some sequential SEHT has influences on SI and MPEMT.The SI is affected obviously to south of the Yangtze River, but changes relatively less in other areas. The larger time scale of SEHT is removed, the more significant impact appears on the probability distribution. MPEMT nearly remains the same when removing different time scale of SHET, so it is a relatively stable value, and can be regarded as a possible new way to define a threshold of extreme high temperature events.
-
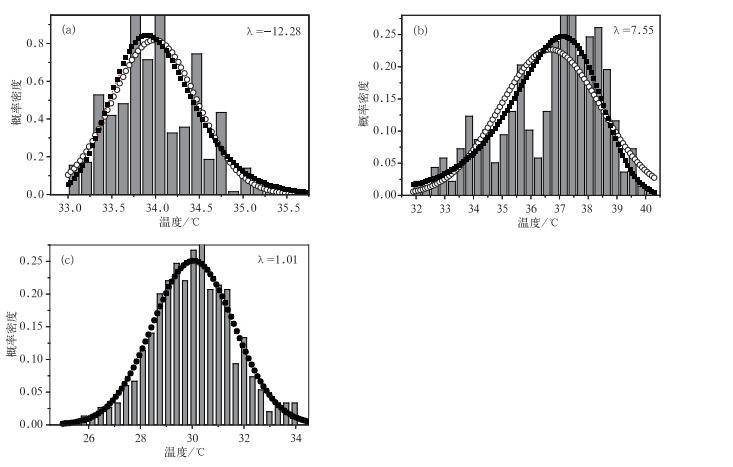
图 1 我国夏季高温极值的正偏、负偏、高斯分布
(直方图对应夏季高温极值的概率统计分布,圈点线为高斯拟合,实点线为偏态函数拟合)(a) 海南东方站,(b) 浙江杭州站,(c) 内蒙古化德站
Fig. 1 The positive skew, negative skew, and normal distribution of summer extreme high temperatures in China
(the histogram is experience distribution, with Gaussian fitting in hollow points line, skewness fitting in solid points line) (a) Dongfang station in Hainan, (b) Hangzhou station in Zhejiang, (c) Huade station in Inner Mongolia
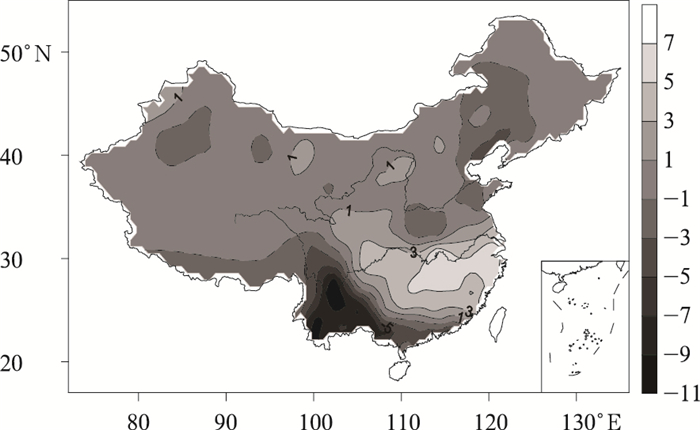
图 2 1961—2008年我国夏季高温极值的偏态指数分布图
Fig. 2 The skewness index of summer extreme high temperatures in China during 1961—2008
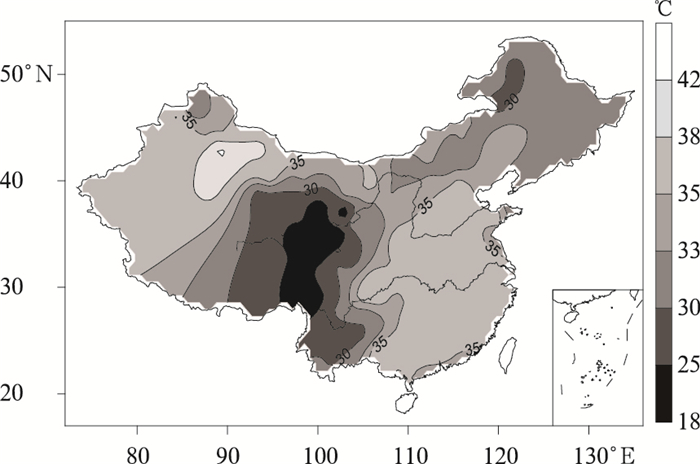
图 3 1961—2008年我国夏季最概然高温极值的分布图
Fig. 3 The most probable extreme high temperature in China during 1961—2008
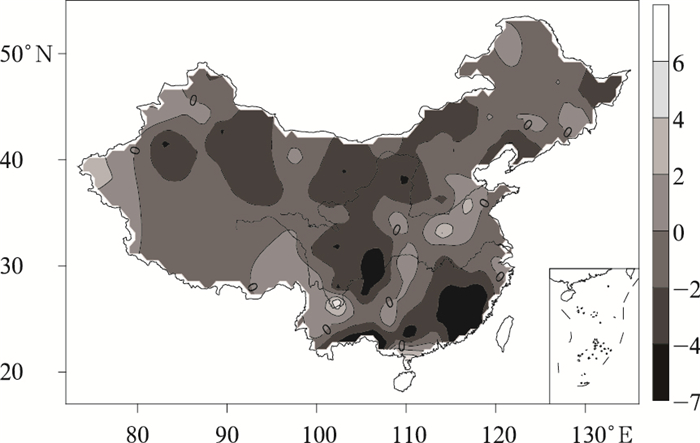
图 4 20世纪80年代前后我国夏季高温极值偏态指数变化分布
Fig. 4 The changes of the skewness index of extreme high temperatures in China before and after 1980s

图 5 20世纪80年代前后我国夏季最概然高温极值变化分布
Fig. 5 The changes of the most probable extreme high temperature in China before and after 1980s

图 6 剔除不同尺度极值后偏态指数变化的均值分布图 (a) 剔除2年尺度,(b) 剔除5年尺度,(c) 剔除10年尺度
Fig. 6 The changes in skewness index after removing different scales extreme high temperatures
(a) removing 2-year imescale, (b) removing 5-year timescale, (c) removing 10-year timescale
-
[1] 胡宜昌, 董文杰, 何勇. 21世纪初极端天气气候事件研究进展.地球科学进展, 2007, 22(10): 1066-1075. doi: 10.3321/j.issn:1001-8166.2007.10.011 [2] 魏凤英, 曹鸿兴, 王丽萍. 20世纪80—90年代中国气候增暖进程的统计事实.应用气象学报, 2003, 14(1): 79-86. http://qikan.camscma.cn/jams/ch/reader/view_abstract.aspx?file_no=20030109&flag=1 [3] 王馥棠.近十年来我国气候变暖影响研究的若干进展.应用气象学报, 2002, 13(6):755-766. http://qikan.camscma.cn/jams/ch/reader/view_abstract.aspx?file_no=20020699&flag=1 [4] 陈隆勋, 朱文琴, 王文, 等.中国近45年来气候变化的研究.气象学报, 1998, 56(3): 257-271. doi: 10.11676/qxxb1998.023 [5] 丁一汇, 任国玉, 石广玉, 等.气候变化国家评估报告 (Ⅰ):中国气候变化的历史和未来趋势.气候变化研究进展, 2006, 2(1):4-8. http://www.cnki.com.cn/Article/CJFDTOTAL-QHBH200601001.htm [6] 张勇, 曹丽娟, 许吟隆, 等.未来我国极端温度事件变化情景分析.应用气象学报, 2008, 19(6):655-660. http://qikan.camscma.cn/jams/ch/reader/view_abstract.aspx?file_no=20080603&flag=1 [7] 杨萍, 刘伟东, 王启光, 等.近40年我国极端温度变化趋势和季节特征.应用气象学报, 2010, 21(1):29-36. http://qikan.camscma.cn/jams/ch/reader/view_abstract.aspx?file_no=20100104&flag=1 [8] 杨萍, 封国林, 刘伟东, 等.空间点过程理论在极端气候事件中的应用研究.应用气象学报, 2010, 21(3):352-359. http://qikan.camscma.cn/jams/ch/reader/view_abstract.aspx?file_no=20100311&flag=1 [9] Render S, Petersen M R. Role of global warming on the statistics of record-breaking temperatures. Phys Rev E, 2006, 74: 0611141-06111414. https://www.mendeley.com/research-papers/role-global-warming-statistics-recordbreaking-temperatures/ [10] Györgyi G, Moloney N R, Rácz Z. Extreme statistics for time series: Distribution of the high relative to the initial value. Phys Rev E, 2007, 76: 0411191-04111912. http://www.ams.org/mathscinet-getitem?mr=2365594 [11] 封国林, 王启光, 侯威, 等.气象领域极端事件的长程相关性.物理学报, 2009, 58(4): 2853-2861. doi: 10.7498/aps.58.2853 [12] 章大全, 钱忠华.利用中值检测方法研究近50年中国极端气温变化趋势.物理学报, 2008, 57(7): 4634-4640. doi: 10.7498/aps.57.4634 [13] 侯威, 杨萍, 封国林.中国极端干旱事件的年代际变化及其成因.物理学报, 2008, 57(6): 3932-3940. doi: 10.7498/aps.57.3932 [14] 龚志强, 王晓娟, 支蓉, 等.中国近58年温度极端事件的区域特征及其与气候突变的联系.物理学报, 2008, 58(6): 4342-4353. http://www.cnki.com.cn/Article/CJFDTOTAL-WLXB200906115.htm [15] 熊安元.长江中游持续暴雨期中尺度降水系统的统计分析.应用气象学报, 1995, 6(4):496-500. http://qikan.camscma.cn/jams/ch/reader/view_abstract.aspx?file_no=19950476&flag=1 [16] Sabhapandit S, Majumdar S N. Density of near-extreme events. Phys Rev Lett, 2007, 98: 142011-142014. http://www.ncbi.nlm.nih.gov/pubmed/17501249 [17] Györgyi G, Moloney N R, Ozogány K, et al. Finite-size scaling in extreme statistics. Phys Rev Lett, 2008, 100:2106011-2106014. http://www.ncbi.nlm.nih.gov/pubmed/18518593 [18] Labraga J C, Villalba R. Climate in the Monte Desert: Past trends, present conditions, and future projections. Journal of Arid Environments, 2009, 73: 154-163. doi: 10.1016/j.jaridenv.2008.03.016 [19] Clarke R T, Paiva R D de, Uvo C B. Comparison of methods for analysis of extremes when records are fragmented: A case study using Amazon basin rainfall data. J Hydrol, 2009, 368: 26-29. doi: 10.1016/j.jhydrol.2009.01.025 [20] Xu Y, Xu C H, Gao X J, et al. Projected changes in temperature and precipitation extremes over the Yangtze River Basin of China in the 21st century. Quaternary International, 2009, 208: 44-52. doi: 10.1016/j.quaint.2008.12.020 [21] 丁裕国, 刘吉峰, 张耀存.基于概率加权估计的中国极端气温时空分布模拟试验.大气科学, 2004, 28(5): 771-782. http://www.cnki.com.cn/Article/CJFDTOTAL-DQXK200405010.htm [22] 丁裕国, 郑春雨, 申红艳.极端气候变化的研究进展.沙漠与绿洲气象, 2008, 2(6): 1-5. http://www.cnki.com.cn/Article/CJFDTOTAL-XJQX200806003.htm [23] 陈兴旺.广义极值分布理论在重现期计算的应用.气象与减灾研究, 2008, 31(4): 52-54. http://www.cnki.com.cn/Article/CJFDTOTAL-HXQO200804012.htm [24] 欧进萍, 林迟.基于结构全寿命设计需求的哈尔滨地区气温统计分析.自然灾害学报, 2009, 18(2): 4-14. http://www.cnki.com.cn/Article/CJFDTOTAL-ZRZH200902001.htm [25] Box G E P, Cox D R. An analysis of transformations. J Roy Statist Soc (Ser B), 1964, 26: 211-252. http://www.ams.org/mathscinet-getitem?mr=192611 [26] Buchinsky M. Quantile regression, Box-Cox transformation model, and the U S wage structure, 1963—1987. Journal of Econometrics, 1995, 65: 109-154. doi: 10.1016/0304-4076(94)01599-U [27] 薛跃, 盛党红. Box-Cox变换原理及其在财务比率正态分布中的作用.南京理工大学学报, 2005, 29(5): 627-630. http://www.cnki.com.cn/Article/CJFDTOTAL-NJLG200505031.htm [28] 吕纯濂, 陈舜华.带有变量中误差非正态模型中的Box-Cox变换.南京气象学院学报, 1997, 20(1): 85-90. http://www.cnki.com.cn/Article/CJFDTOTAL-NJQX701.011.htm [29] Bonsal B R, Zhang X B, Vincent L A, et al. Characteristic of daily and extreme temperature over Canada. J Climate, 2001, 14: 1959-1976. doi: 10.1175/1520-0442(2001)014<1959:CODAET>2.0.CO;2 -

 下载:
下载:

 点击查看大图
计量
- 摘要浏览量: 4289
- HTML全文浏览量: 903
- PDF下载量: 2350
- 被引次数: 0
