
 设为首页
设为首页 加入收藏
加入收藏

Comparisons of Boundary Mixing Layer Depths Determined by the Empirical Calculation and Radiosonde Profiles
-
摘要: 根据Nozaki计算混合层厚度的经验参数化方法,利用部分时段的北京、黑龙江龙凤山、浙江临安、新疆阿勒泰、海南三亚、青海西宁、云南腾冲7个站的地面常规气象观测资料,计算14:00(北京时) 的混合层厚度,并与短期的臭氧探空资料中的Vaisala RS-80气象探空仪观测资料 (位温廓线和折射系数梯度) 分别确定的混合层厚度作对比分析。结果表明:由气象探空资料位温廓线和折射系数梯度分别确定的混合层厚度一致性很好,同时用这两种方法可以较为准确地确定混合层厚度。Nozaki方法可以较好地揭示混合层厚度日变化特征;但是当混合层厚度大于2000 m时,该方法计算值偏小,而小于1000 m时稍偏大;该方法计算值在北方站点 (北京、龙凤山、阿勒泰、西宁) 偏高,南方站点 (三亚、临安、腾冲) 偏低,而且计算值在无云时误差较大,多云时误差较小。Abstract: Mixing layer is one typical type of atmosphere boundary layer, and it is named after strong vertical mixing which leads to the nearly constant variables, such as potential temperature and water vapor in this layer. The depth of mixing layer is an important parameter to identify features of thermodynamics and atmospheric dynamics in the boundary layer, and also a key to monitor the air quality. Mixing layer has very distinct daily variation as different meteorological conditions and synoptic processes largely influence the structure of boundary layer. Mixing layer becomes thicker under clear sky conditions, while remains physically stable and almost invariant during a single day under cloudy or raining weather conditions. Therefore, measurements and calculation of mixing layer depth are worth studying.The depths of mixing layer at 14:00 of Beijing, Longfengshan, Lin'an, Aletai, Sanya, Xining and Tengchong are compared using two kinds of datasets: The Nozaki empirical method and the radiosonde observational data reduced by vertical profiles of potential temperature and refractivity. It shows that the two observational depths are in good agreement, and the radiosonde measurements of mixing layer can be seen as criteria in the comparison with the Nozaki empirical method. Few bad linear correlation points of mixing layer depth from potential temperature profiles and refractivity profiles indicate that depth of mixing layer determined by refractivity profiles sometimes cannot find out the actual mixing layer, possibly due to dramatic variation of refractivity profiles under stable atmosphere vertical structure conditions.The comparisons illustrate that the Nozaki method may reflect the daily variations of mixing layer as those shown in observational dataset. However, the Nozaki method underestimates mixing layer depth when the mixing layer is above 2000 m. On the contrary, it overestimates mixing layer depth when the mixing layer is lower than 1000 m. Nozaki method also overestimates mixing layer depth at the sites (Beijing, Longfengshan, Aleitai, Xining) located at higher latitudes, but underestimates mixing layer depth in the sites (Sanya, Lin'an, Tengchong) at lower latitudes. Errors of Nozaki method are smaller under cloudy (total cloud amount is about 3—7) weather conditions, while larger in clear days. The lack of considering terrain effect and the simplifying of physical process maybe sources of comparative error of Nozaki method. These results suggest that the empirical determination of mixing layer depth need more subtle consideration before extensive use.
-
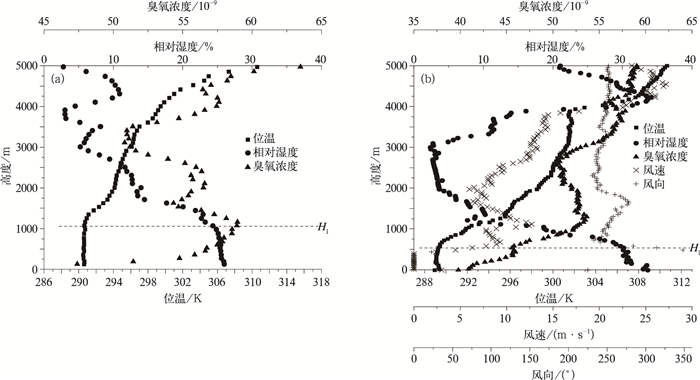
图 1 典型的气象探空资料位温曲线判断混合层厚度结果 (H1:混合层厚度)
(a) 北京,2005年4月11日, (b) 临安,2001年3月5日
Fig. 1 Typical potential temperature profiles to identify mixing layer depth (H1 denotes mixing layer depth)
(a) in Beijing on 4 April 2005, (b) in Lin'an on 15 March 2001
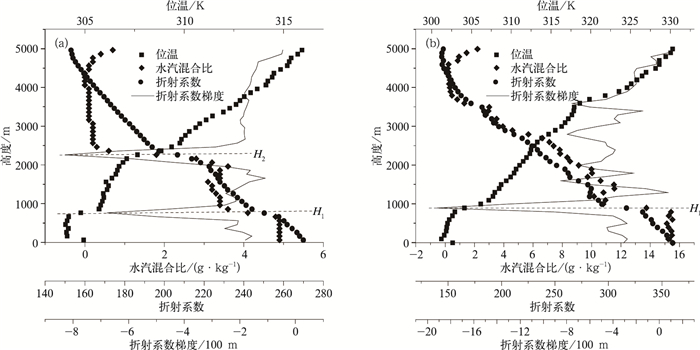
图 2 典型的折射系数与折射系数梯度曲线用于确定混合层厚度 (H1:混合层厚度;H2:残留层高度)
(a) 阿勒泰,2005年5月9日, (b) 三亚,2004年4月19日
Fig. 2 Typical refractivity profiles to identify mixing layer depth (H1 denotes mixing layer depth; H2 denotes residual layer depth) (a) in Aletai on 9 May 2005, (b) in Sanya on 19 April 2004
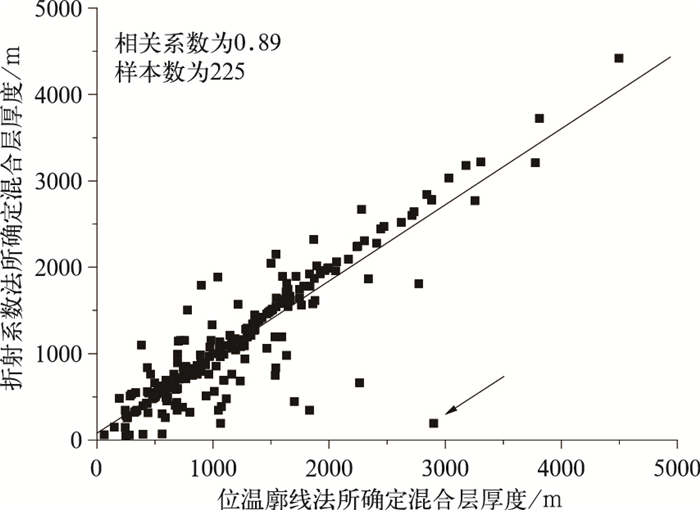
图 3 气象探空数据的位温廓线法与折射系数法所确定的混合层厚度的对比
Fig. 3 Comparison of mixing layer depths determined by potential temperature and refractivity profiles, respectively

图 4 龙凤山等7个站点由位温廓线法、折射系数法和Nozaki方法得到的混合层厚度对比
Fig. 4 Mixing layer depths determined by potential temperature, refractivity profiles and Nozaki method at 7 sites
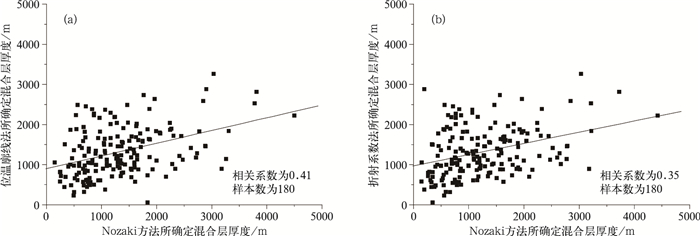
图 5 Nozaki方法与探空曲线确定混合层厚度的比较
(a) 位温廓线法与Nozaki方法对比,(b) 折射系数法与Nozaki方法对比
Fig. 5 Comparison of mixing layer depths determined by Nozaki method and radiosonde profiles
(a) Nozaki method vs potential temperature profiles, (b) Nozaki method vs refractivity profiles

图 6 7个站点云量分组与不同方法确定的混合层厚度差值的关系
Fig. 6 Differences of mixing layer depths categorized by cloud cover of 7 sites
表 1 龙凤山等7个站点地表覆盖状况及气象探空气球放飞时间和样本统计
Table 1 Land-cover types, delivering time of radiosonde balloons and quantities of balloons at 7 sites
地点 地表状况 位置 海拔/m 臭氧探空气球
放飞时间总样
本量剔除
样本量所用
样本量气球放飞
时间龙凤山 森林覆盖 44°N,127°E 160 2005-04-01—05-13 21 0 21 11:00—12:00 北京 城市郊区 39°N,116°E 34 2002-01-11—01-23
2005-04-11—05-1561
61
05
1614:00
14:00临安 森林覆盖 30°N,119°E 98 2001-02-21—04-11
2004-04-05—05-1926
190
026
1914:00
14:00阿勒泰 平原郊区 47°N,88°E 737 2005-04-01—05-13 22 0 22 13:00—14:00 三亚 海滨郊区 18°N,109°E 6 2004-04-02—05-21 24 1 23 14:00 西宁 山地郊区 36°N,101°E 2296 1995-10-16—1996-08-03
2002-01-08—01-28
2005-04-04—05-1346
9
221
0
245
9
2010:00左右
13:00—14:00
13:00—14:00腾冲 高原郊区 25°N,98°E 1655 2004-04-03—05-19 20 1 19 14:00  下载: 导出CSV
表 2 Nozaki方法计算值随不同混合层厚度与位温廓线法和折射系数法所确定值的差别
Table 2 Variations of mixing layer depths between Nozaki method and measurements of radiosonde profiles
混合层厚
度范围/mNozaki方法与位温
廓线法差值/mNozaki方法与折射
系数法差值/m0~1000 443 553 1000~2000 -65 -108 2000~3000 -886 -931 3000以上* -1449 -1201 注:*由于3000 m以上厚度的混合层样本数比较少,所以3000 m以上混合层厚度归为一类。
下载: 导出CSV
表 3 不同方法所确定的龙凤山等7个站点混合层厚度平均值及相对误差
Table 3 Mean and relative error of mixing layer depths determined by 3 methods at 7 sites
地点 位温廓线法/m 折射系数法/m Nozaki方法/m Nozaki方法与位温
廓线法相对误差Nozaki方法与折射
系数法相对误差龙凤山 1125 1091 1266 0.13±0.53 0.33±0.78 北京 1536 1450 1403 0.11±0.56 0.23±0.74 临安 1597 1489 963 -0.26±0.51 -0.17±0.57 阿勒泰 1136 1013 1790 0.82±0.86 0.99±0.89 三亚 968 967 1091 0.29±0.57 0.30±0.54 西宁① 586 593 1422 2.27±2.07 2.19±1.98 西宁② 1798 1660 1927 0.31±0.74 1.02±3.11 腾冲 1130 1172 1184 0.37±0.81 0.52±1.24 注:① 为2002年1月的数据,② 为2005年4—5月的数据。
下载: 导出CSV
-
[1] Stull R B.边界层气象学导论.北京:气象出版社, 1991:3-20. [2] Basha G, Ratnam M V.Identification of atmospheric boundary layer height over a tropical station using high resolution radiosonde refractivity profiles: Comparison with GPS Radio occultation measurements. J Geophys Res, 2009, 114, D16101, doi: 10.1029/2008JD011692. [3] Hennemuth B, Lammert A. Determination of the atmospheric boundary layer height from radiosonde and lidar backscatter. Boundary-Layer Meteorology, 2006, 120:181-200. doi: 10.1007/s10546-005-9035-3 [4] Shaw W J, Pekour M S, Coulter R L, et al.The daytime mixing layer observed by radiosonde, profiler, and lidar during MILAGRO.Atmos Chem Phys Discuss, 2007, 7: 15025-15065. doi: 10.5194/acpd-7-15025-2007 [5] Holzworth G C. Esimates of mean maximum mixing depths in the contiguous united states. Mon Wea Rev, 1964, 92: 235-242. doi: 10.1175/1520-0493(1964)092<0235:EOMMMD>2.3.CO;2 [6] 郑向东, 丁国安, 孙敏峰, 等.北京冬季低层大气O3垂直分布观测结果的研究.应用气象学报, 2002, 13(增刊):101-108. http://kns.cnki.net/KCMS/detail/detail.aspx?filename=yyqx2002s1010&dbname=CJFD&dbcode=CJFQ [7] 程水源, 张宝宁.混合层厚度的确定与计算方法研究.中国环境科学, 1997, 17(6):512-517. http://www.cnki.com.cn/Article/CJFDTOTAL-ZGHJ706.008.htm [8] 廖国莲.混合层厚度的计算方法及影响因子.中山大学研究生学刊 (自然科学, 医学版), 2005, 26(4):66-72. http://www.cnki.com.cn/Article/CJFDTOTAL-YJSK200504009.htm [9] 张文煜, 冯广泓.复杂地形上确定混合层厚度方法的探讨.兰州大学学报, 1995, 31(3):151-152. http://www.cnki.com.cn/Article/CJFDTOTAL-LDZK503.030.htm [10] 程水源, 席德立.关于确定混合层厚度的几种方法.环境科学进展, 1997, 5(4):64-68. http://www.cnki.com.cn/Article/CJFDTOTAL-HJJZ704.007.htm [11] 陈炯, 王建捷.北京地区夏季边界层结构日变化的高分辨模拟对比.应用气象学报, 2006, 17(4):403-411. http://qikan.camscma.cn/jams/ch/reader/view_abstract.aspx?file_no=20060469&flag=1 [12] 卞林根, 程彦杰.北京大气边界层中风和温度廓线的观测研究.应用气象学报, 2002, 13(1):13-25. http://www.cnki.com.cn/Article/CJFDTOTAL-YYQX2002S1001.htm [13] 崔克强.边界层湍流通量参数化方案.应用气象学报, 1997, 8(1):43-49. http://kns.cnki.net/KCMS/detail/detail.aspx?filename=yyqx7s1.006&dbname=CJFD&dbcode=CJFQ [14] 杨玉华, 徐祥德.北京城市边界层热岛的日变化周期模拟.应用气象学报, 2003, 14(1):61-68. http://qikan.camscma.cn/jams/ch/reader/view_abstract.aspx?file_no=20030107&flag=1 [15] Holzworth G C. Mixing Heights, Wind Speeds and Potential for Urban Air Pollution Through Contiguous United States. AP-101, US EPA. [16] Holzworth G C. Mixing depths, wind speeds and air pollution potential for selected locations in the United States. J Appl Meteorology, 1967, 6:1039-1044. doi: 10.1175/1520-0450(1967)006<1039:MDWSAA>2.0.CO;2 [17] Nozaki K Y. Mixing Depth Model Vsing Hourly Surface Observations. Report 7053, USAF Environmental Technical Applications Center, 1973. [18] Cheng S Y, Huang G H, Chakma A, et al. Estimation of atmospheric mixing heights using data from airport meteorological stations. J Environ Sci Health, 2001, 36(4): 521-532. doi: 10.1081/ESE-100103481 [19] Pasquill F. The estimation of the dispersion of windborne material. Meteorological Magazine, 1961, 90:33-49. https://www.pubfacts.com/detail/5707561/Blood-flow-of-the-cerebral-cortex-in-intracranial-hypertension [20] Stull R B.边界层气象学导论.北京:气象出版社, 1991: 402-403. [21] Garratt J R. Review of drag coefficients over oceans and continents. Mon Wea Rev, 1977, 105(7): 915. doi: 10.1175/1520-0493(1977)105<0915:RODCOO>2.0.CO;2 [22] Thayer G G. An improved equation for radio refractive index of air. Radio Sci, 1974, 9:803-807. doi: 10.1029/RS009i010p00803 -

 点击查看大图
计量
- 摘要浏览量: 4981
- HTML全文浏览量: 1117
- PDF下载量: 3219
- 被引次数: 0
