
 设为首页
设为首页 加入收藏
加入收藏

Height Assignment Error of FY-2E Atmospheric Motion Vectors and Its Application to Data Assimilation
-
摘要: FY-2E气象卫星云导风产品观测误差较大的主要原因是高度指定存在较大误差。针对该问题,采用一维变分方法对云导风高度进行调整。统计分析表明:经高度调整后的FY-2E气象卫星云导风产品质量得到很大改善;采用新息向量法,选取零阶Bessel函数模型,在观测空间分离背景误差和观测误差方差得到云导风的观测误差。运用GRAPES全球模式进行数值模拟,结果表明:采用新的观测误差方案和经过高度调整后的云导风产品能提高数值模式在北半球的短期预报能力,高层的改进效果明显好于中低层。并根据云导风反演原理及算法,讨论了FY-2E气象卫星云导风高度指定系统性偏高的主要原因,以求进一步改善云导风产品的质量。Abstract: Atmospheric motion vectors (AMVs) can provide plenty of useful information for synoptic analysis and numerical weather prediction, because of their excellent temporal and spatial coverage. It is of great value to apply FY-2E AMVs efficiently with the purpose of improving the initial fields and numerical forecasts. The existing assimilation systems in China are in lack of systematic guidance on the quality of FY-2E AMVs, and therefore call for research on optimizing the parameters in data assimilation system, which is very important and foundational to numerical weather prediction.The error characteristics of FY-2E AMVs are investigated on the basis of quality indicator attached. Statistical results demonstrate that the quality indicator of FY-2E AMVs has relatively weak implication of quality, because speed biases and root mean square errors with high quality indicator are still very large. With the study of inversion theory of AMVs, it is found that the inaccuracy of height assignment is the main problem that causes large observation error. According to this problem, the one-dimensional variational method is employed to adjust the height of AMVs. At the same time, the improvement is compared before and after height adjustment by means of radiosonde observations. As a result, it shows that the quality of FY-2E AMVs can be improved greatly after height adjustment. The absolute error of wind speed at every level in the northern hemisphere extra-tropics is reduced from 4 m·s-1 to 2 m·s-1 or less, while root mean square error from 10 m·s-1 to 6 m·s-1 or below. And the situation improved in the Southern Hemisphere extra-tropics is even more apparent. Height bias has been controlled within 20 hPa at every level below 150 hPa after height adjustment, and the characteristic of single-level wind field is evident. These facts reflect that the height of AMVs designated is systemically high in the Northern and Southern Hemispheres extra-tropics.Furthermore, the method of innovation vector and zero-order Bessel fitting function which is based on the theory of least square method are adopted together to partition background and observation error variances in the observation space, and thus the observation error of AMVs and the quality control coefficient can be estimated according to the statistical distribution of the innovation vectors. In order to validate the assumption on uncorrelated observation errors required in 3DVAR method, observation errors are inflated to avoid the influence caused by correlated errors. Finally, the predictability and impact of FY-2E AMVs data assimilation schemes is assessed in GRAPES global numerical prediction system. The results confirm that short-range forecast ability for the global numerical weather prediction system can be improved in the Northern Hemisphere, by introducing new observation error schemes with height adjustment. The improvement above high levels appears better than those of middle and low levels.
-
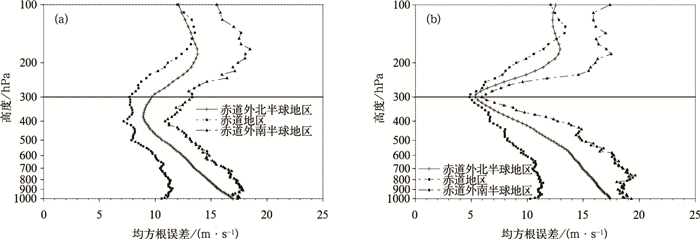
图 1 300 hPa FY-2E云导风产品与探空资料整层风场的均方根误差垂直廓线 (a) 调整前, (b) 调整后
Fig. 1 RMSE profile between 300 hPa FY-2E AMVs and entire profile of collocated radiosonde observations
(a) before height adjustment, (b) after height adjustment
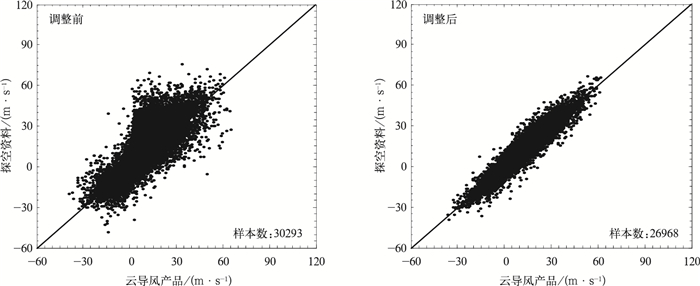
图 2 赤道外北半球50~400 hPa FY-2E云导风产品与探空资料纬向风速散点分布
Fig. 2 Scatter plots of zonal wind of FY-2E AMVs against radiosonde observations at 50—400 hPa in the North Hemisphere extra-tropics
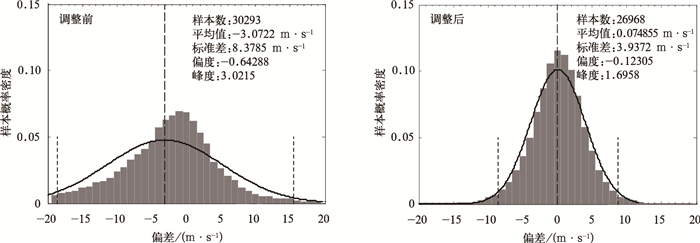
图 3 赤道外北半球地区50~400 hPa FY-2E云导风产品与探空资料纬向风风速偏差的样本概率分布
(光滑曲线为正态分布曲线,长虚线为平均值,两短虚线分别为μ±2σ)
Fig. 3 Probability distribution of zonal wind speed deviation of FY-2E AMVs to radiosonde observations at 50—400 hPa in the Northern Hemisphere extra-tropics
(smooth curve is normal distribution curve, long dashed line is mean value, two short dashed lines are μ±2σ, respectively)
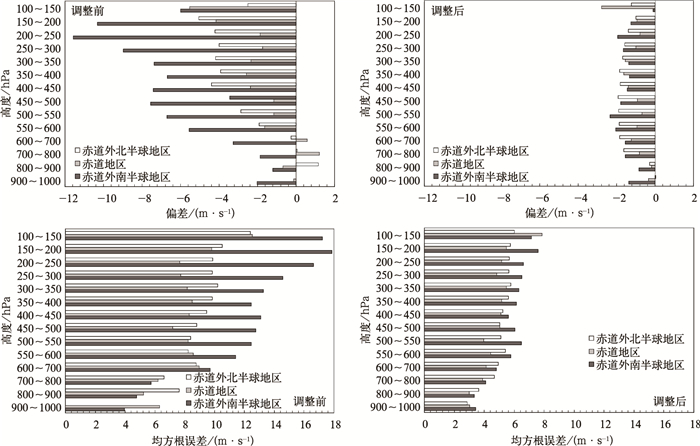
图 4 高度调整前后FY-2E云导风产品与探空资料全风速偏差和均方根误差的垂直分布
Fig. 4 Speed bias and RMSE of FY-2E AMVs calculated before height adjustment and after height adjustment against radiosonde observations at each height level
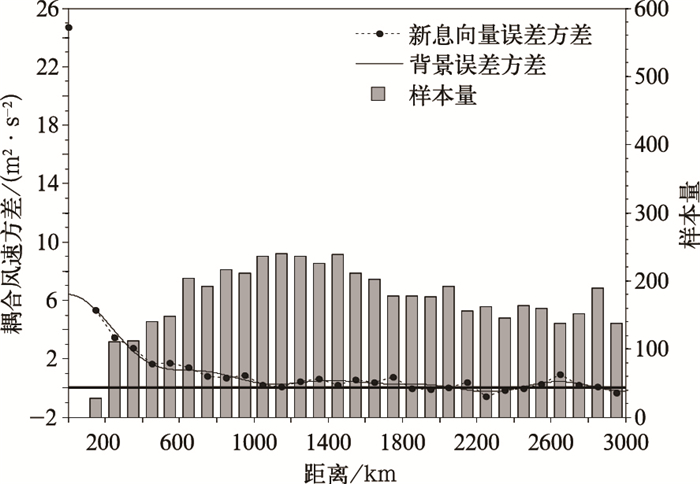
图 5 250 hPa新息向量误差方差与拟合的背景误差方差函数曲线
Fig. 5 Error variance of innovation vectors and fitted background error variance functions

图 6 北半球区域 (0°~90°N, 40°~170°E) 数值试验的预报改进率
Fig. 6 Rate of forecast experiment improvement in the region of the North Hemisphere (0°—90°N, 40°E—170°E)
表 1 经验系数设置
Table 1 Settings of coefficients
经验系数 赤道外
北半球地区赤道地区 赤道外
南半球地区FU/(m·s-1) 4.1 2.2 3.6 FV/(m·s-1) 3.8 2.0 3.0 FT/℃ 10.0 10.0 10.0 FP/hPa 150 80 150 FS(m·s-1) 4.0 3.2 4.2 FD/(°) 30 40 25  下载: 导出CSV
表 2 垂直层次的划分
Table 2 The partition of vertical levels
层次/hPa 云导风高度范围/hPa 1000 ≥925 850 925~775 700 775~600 500 600~450 400 450~350 300 350~275 250 275~225 200 225~175 150 175~125 100 ≤125
下载: 导出CSV
表 3 各层云导风的观测误差均方差 (单位:m·s-1)
Table 3 Observation errors of AMVs at each level (unit:m·s-1)
层次/hPa 计算观测误差 旧方案观测误差 新方案观测误差 1000 2.3 6.5 850 2.3 6.8 700 3.4 2.5 6.2 500 4.5 3.0 6.5 400 4.6 3.5 6.8 300 5.0 3.7 7.1 250 4.3 3.5 6.5 200 4.0 3.5 6.0 150 4.8 3.4 7.2 100 3.3 8.6
下载: 导出CSV
-
[1] 侯青, 许健民.卫星导风资料所揭示的对流层上部环流形势与我国夏季主要雨带之间的关系.应用气象学报, 2006, 17(2): 138-144. http://qikan.camscma.cn/jams/ch/reader/view_abstract.aspx?file_no=20060224&flag=1 [2] Ottenbacher A, Tomassini M, Holmlund K, et al. Low-level cloud cotion cinds from meteosat high-resolution visible Imagery. Wea Forecasting, 1997, 12: 175-184. doi: 10.1175/1520-0434(1997)012<0175:LLCMWF>2.0.CO;2 [3] Velden C S, Olander T L, Wanzong S. The impact of multispectral GOES-8 wind information on Atlantic tropical cyclone track forecasts in 1995. Part I: Dataset methodology, description, and case analysis. Mon Wea Rev, 1998, 126: 1202-1218. doi: 10.1175/1520-0493(1998)126<1202:TIOMGW>2.0.CO;2 [4] 许健民, 张其松, 方翔.用红外和水汽两个通道的卫星测值指定云迹风的高度.气象学报, 1997, 55(4): 408-417. doi: 10.11676/qxxb1997.041 [5] Xu J M, Holmlund K, Zhang Q S, et al. Comparison of two schemes for derivation of atmospheric motion vectors. J Geophys Res, 2002, 107(14): 1-15. https://www.researchgate.net/publication/248802364_Comparison_of_two_schemes_for_derivation_of_atmospheric_motion_vectors [6] 许健民, 张其松, 王大昌, 等.云迹风计算中的两个几何问题.应用气象学报, 1997, 8(1): 11-18. http://qikan.camscma.cn/jams/ch/reader/view_abstract.aspx?file_no=19970102&flag=1 [7] 许健民, 张其松.卫星风推导和应用综述.应用气象学报, 2006, 17(5): 574-582. http://qikan.camscma.cn/jams/ch/reader/view_abstract.aspx?file_no=20060599&flag=1 [8] Smith W L. An improved method for calculating tropospheric temperature and moisture from satellite radiometer measurements. Mon Wea Rev, 1968, 96: 387-396. doi: 10.1175/1520-0493(1968)096<0387:AIMFCT>2.0.CO;2 [9] Szejwach G. Determination of semi-transparent cirrus cloud temperature from infrared radiances: Application to METEOSAT. J Appl Meteor, 1982, 21: 384-393. doi: 10.1175/1520-0450(1982)021<0384:DOSTCC>2.0.CO;2 [10] Nieman S J, Schmetz J, Menzel W P. A comparison of several techniques to assign heights to cloud tracers. J Appl Meteor, 1993, 32: 1559-1568. doi: 10.1175/1520-0450(1993)032<1559:ACOSTT>2.0.CO;2 [11] Schmetz J, Kenneth H, Joel H, et al. Operational cloud-motion winds from meteosat infrared images. J Appl Meteor, 1993, 32: 1206-1225. doi: 10.1175/1520-0450(1993)032<1206:OCMWFM>2.0.CO;2 [12] Hayden C M, Velden C S. Quality Control and Assimilation Experiments with Satellite Derived Wind Estimates. Preprints, Ninth Conf on Numerical Weather Prediction. Denver, CO, Amer Meteor Soc, 1991: 19-23. [13] Purser R J, McQuigg R. A Successive Correction Analysis Scheme Using Recursive Numerical Filter. Met O 11 Tech Note, No. 154, British Meteor Service, 1982: 17. [14] Cressman G P. An operational objective analysis system. Mon Wea Rev, 1959, 87: 367-374. doi: 10.1175/1520-0493(1959)087<0367:AOOAS>2.0.CO;2 [15] Barnes S L. A technique for maximizing details in numerical weather map analysis. J Appl Meteor, 1964, 3: 396-409. doi: 10.1175/1520-0450(1964)003<0396:ATFMDI>2.0.CO;2 [16] Hayden C M, Purser R J. Recursive filter objective analysis of meteorological fields: Applications to NESDIS operational processing. J Appl Meteo, 1995, 34: 3-15. doi: 10.1175/1520-0450-34.1.3 [17] Hollingsworth A, Lönnberg P. The statistical structure of short-range forecast errors as determined from radiosonde data. Part Ⅰ: The wind field. Tellus, 1986, 38A: 111-136. doi: 10.1111/tela.1986.38A.issue-2 [18] Lönnberg P, Hollingsworth A. The statistical structure of short-range forecast errors as determined from radiosonde data. Part Ⅱ: The covariance of height and wind errors. Tellus, 1986, 38A: 137-161. doi: 10.1111/tela.1986.38A.issue-2 [19] Xu Q, Wei L, Tuyl A V, et al. Estimation of three-dimensional error covariances. Part I: Analysis of height innovation vectors. Mon Wea Rev, 2001, 129: 2126-2135. doi: 10.1175/1520-0493(2001)129<2126:EOTDEC>2.0.CO;2 [20] Xu Q, Wei L. Estimation of three-dimensional error covariances. Part Ⅱ: Analysis of wind innovation vectors. Mon Wea Rev, 2001, 129: 2939-2954. doi: 10.1175/1520-0493(2001)129<2939:EOTDEC>2.0.CO;2 -

 点击查看大图
计量
- 摘要浏览量: 3449
- HTML全文浏览量: 991
- PDF下载量: 1361
- 被引次数: 0
