
 设为首页
设为首页 加入收藏
加入收藏

Numerical Simulation of Atmospheric Duct in Typhoon Subsidence Area
-
摘要: 受台风鹿莎影响,处在其西侧外围下沉区域的南京地区于2002年8月31日出现了一次大气波导过程,利用大气中尺度模式WRF对其成因进行了详细的数值模拟研究。WRF数值模拟较好地再现了此次波导的演变过程,即波导在31日傍晚开始形成,次日凌晨达到最强,日出后迅速减弱消失。基于数值模拟高时空分辨率的输出结果,对波导成因进行细致分析,结果表明:湿度突变层和逆温层的同时存在导致了波导的发生,前者是其形成的关键因素,而后者的作用主要体现在增强其强度;台风前期流场从海上带来大量的水汽,台风后期流场将北方高空干空气输送到受高压下沉运动控制的南京地区,造成近地层出现下湿上干的剧烈湿度梯度;下沉运动强度并不足以直接导致南京地区的逆温层,但其控制下的晴朗天气非常有利于夜间地面长波辐射冷却而形成逆温。Abstract: The atmospheric duct is a kind of anomalous refraction phenomena in the troposphere atmosphere. It can change the normal propagation characteristic of the electromagnetic wave, and has a significant influence on radar detections and radio communications. The emergence of duct strongly depends on the weather conditions and it often occurs in the subsidence area west to a typhoon.With the rapid development and extensive application of atmospheric numerical models, high-resolution numerical modeling has become an important tool to get insight of duct.Using the WRF model, the atmospheric duct process occurred on 31 August 2002 over Nanjing region in a subsidence area west to Typhoon Rusa is studied in details. The WRF numerical simulation reproduces well the evolution of the duct, which starts to form in the evening of 31 August, reaches the strongest level the next early morning, weakened and disappeared rapidly after sunrise. Based on numerical simulation output with high spatial-temporal resolution, results show that humidity gradient is a key factor to the formation of this duct, and the humidity invertion enhances its strength. The outside low-level flow in the typhoon early stage brings plenty of moisture from the sea to Nanjing region in the near surface layer. The typhoon moves northeastward and dry air mass is transported from the north by the outside high-level flow in the typhoon late stage, and sink down due to high pressure, so an intense gradient of humidity which is prerequisite for the formation of duct appears in the near surface layer. The subsidence itself is not strong enough to directly cause the inversion, but the clear-sky weather caused by it is favorable for long-wave radiation cooling during night time, which is the primary cause for the inversion formation. The inversion formation hinders the upward transport of water vapor, so that the humidity gradient develops further. Besides, the simulation results also reflect the marine atmospheric duct.These results also show that the high-resolution atmospheric meso-scale numerical simulation can be used as an effective means of studying and forecasting duct.
-
Key words:
- typhoon;
- subsidence;
- atmospheric duct;
- WRF numerical simulation
-
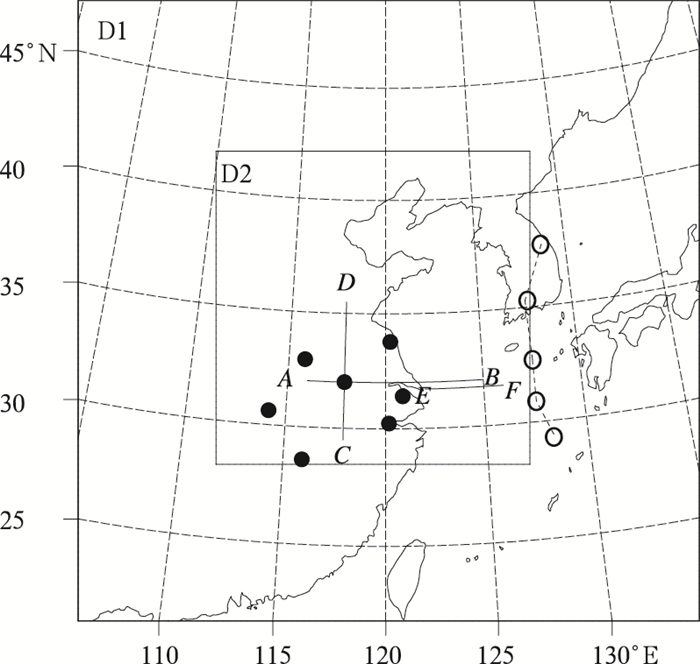
图 1 WRF模拟区域嵌套示意图
(黑点为2002年8月31日20:00南京及周围地区出现波导的探空站点,虚线连接的空白圆圈为台风鹿莎的移动路径,间隔为12 h,起止时间为8月30日00:00—9月1日00:00)
Fig. 1 WRF modeling domains
(the black dots indicate duct-occurred stations in Nanjing and its neighboring area at 2000 BT 31 August 2002; the empty circles linked by dash line indicate the typhoon track from 0000 BT 30 August to 0000 BT 1 September in 2002; the interval between two neighboring circles is 12 h)
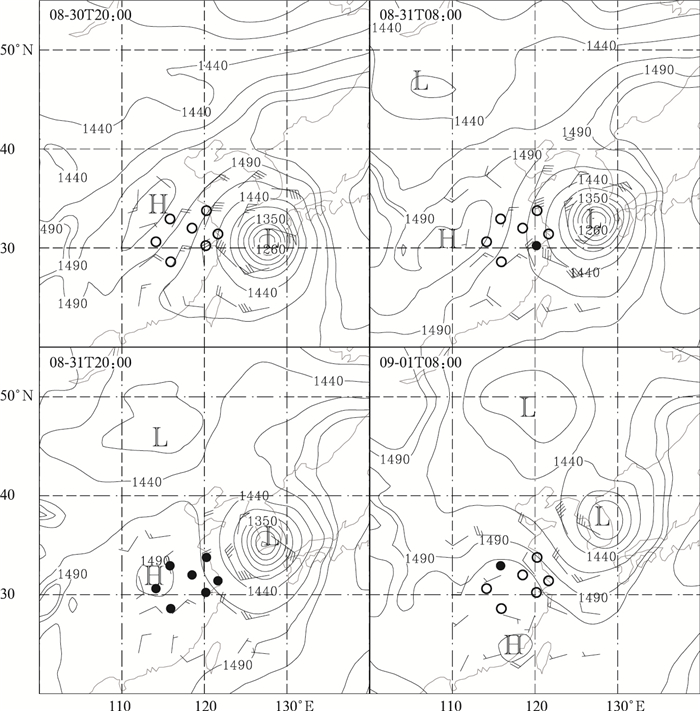
图 2 FNL再分析数据850 hPa位势高度场 (单位:gpm) 与风场 (全风速杆为4 m·s-1)
(实心圆与空心圆分别为出现与未出现大气波导的探空站点)
Fig. 2 The potential heights (unit:gpm) and winds (a full barb indicates 4 m·s-1) analysis of FNL data at 850 hPa
(solid circles and empty circles indicate the stations with and without duct, respectively)
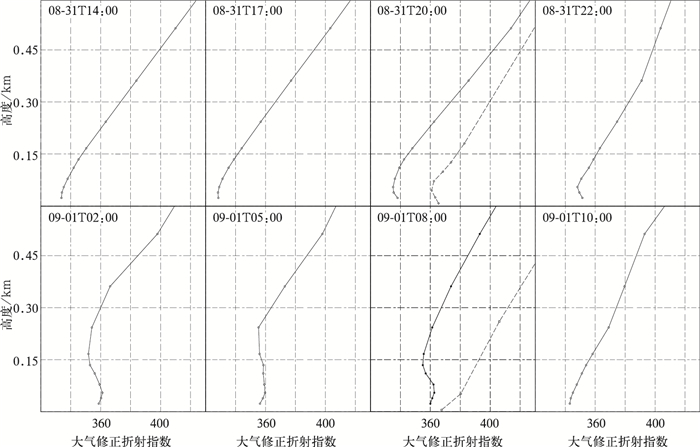
图 3 控制试验模拟的南京站大气波导的演变
(实线为模拟值,虚线为观测值)
Fig. 3 Evolution of the simulated modified refractivity at Nanjing Station
(the solid line represents the simulated one; the dashed line represents the observed one)
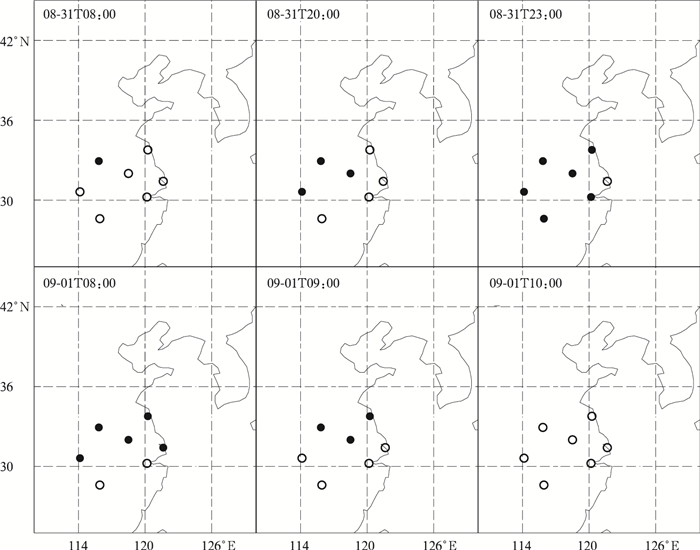
图 4 控制试验模拟的大气波导分布
(实心圆与空心圆分别为出现与未出现大气波导的探空站点)
Fig. 4 Distribution of the simulated duct by the control experiment
(solid circles and empty circles indicate the stations with and without duct, respectively)
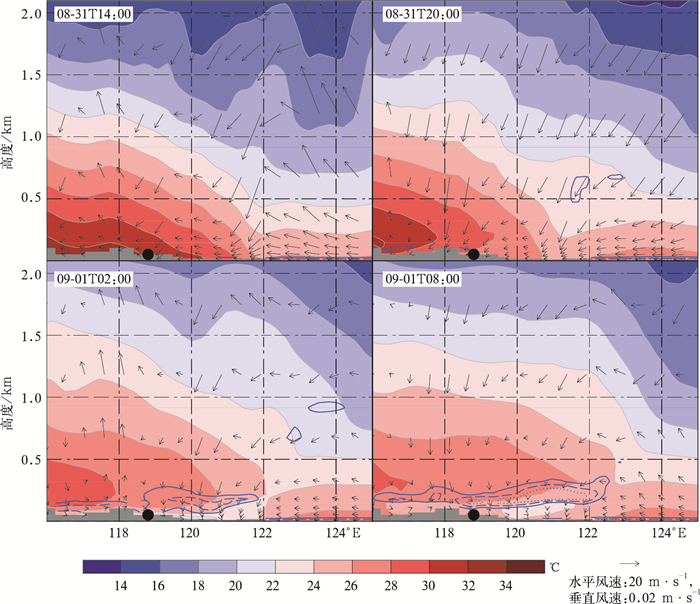
图 5 控制试验模拟的温度和大气波导沿图 1中线段AB的垂直剖面
(填充色为温度, 单位:℃; 蓝色实线、虚线、点线分别代表0,-80,-160 M·km-1的大气修正折射指数垂直梯度;箭头代表风矢量;黑点代表南京站位置)
Fig. 5 Vertical sections of the simulated temperature and duct along AB shown in Fig. 1
(colorful shaded represents temperature, unit:℃; blue solid, dashed and dotted lines represent the vertical gradient of modified refractivity with value 0, -80, -160 M·km-1, respectively; the arrows represent wind, the black dot on the horizontal axis represents the location of Nanjing Station)
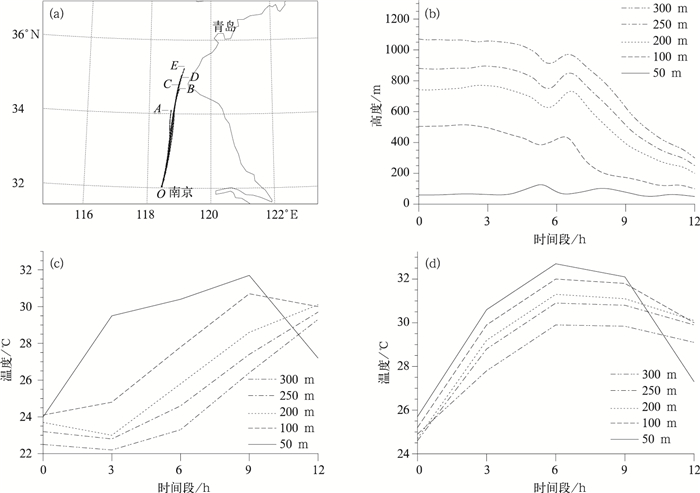
图 6 南京上空不同高度气块12 h后向追踪轨迹 (a) 和后向追踪中气块高度 (b)、温度 (c) 随时间的变化以及南京地区局地温度 (d) 的时间变化
(AO, BO, CO, DO与EO为不同高度气块的移动路径,O为南京站位置)
Fig. 6 The 12 h backward trajectory of air mass at different heights from Nanjing (a) and temporal changes of heights (b) and temperatures (c) of backward trajectories, and local temperature (d) at Nanjing Station
(AO, BO, CO, DO and EO indicate the trajectorys of the air mass from different heights, respectively; O indicates the location of Nanjing Station)
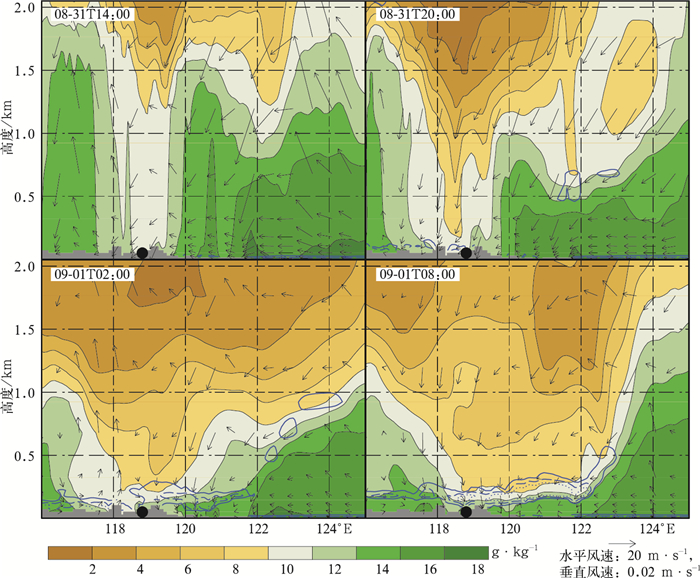
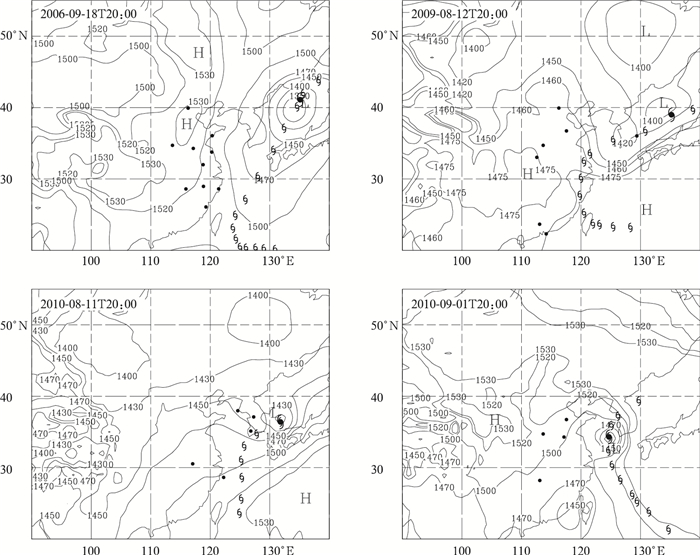
图 9 4个台风个例FNL再分析数据850 hPa位势高度场与波导区域
(空心台风符号为台风路径,实心台风符号代表波导发生时刻台风的位置,实心圆为发生波导的探空站点)
Fig. 9 FNL analysis at 850 hPa and duct areas of four typhoon cases
(hollow typhoon symbol indicates the track of typhoon, solid typhoon symbol indicates the location of the typhoon when ducts occurred, and solid circles indicate duct-occurred stations)

图 10 海上波导与水汽混合比的垂直梯度沿图 1中线段EF的垂直剖面
(填充色为水汽混合比的梯度; 蓝色实线、虚线、点线分别代表0,-80,-160 M·km-1的大气修正折射指数垂直梯度;箭头为风场)
Fig. 10 Vertical gradient sections of water mixing ratio and duct along EF in Fig.1
(colorful shaded is the vertical gradient of water mixing ratio; blue solid, dashed and dotted lines represent the vertical gradient of modified refractivity with value 0, -80, -160 M·km-1, respectively; arrows represent wind)
-
[1] 张军.军事气象学.北京:气象出版社, 2005:76-84. [2] 姚展予, 赵柏林, 李万彪, 等.大气波导特征分析及其对电磁波传播的影响.气象学报, 2000, 58(5): 605-616. doi: 10.11676/qxxb2000.062 [3] 郑琦, 邢文革.大气波导效应及其对低空探测的影响分析.现代雷达, 2005, 27(5): 19-21. http://www.cnki.com.cn/Article/CJFDTOTAL-XDLD200505005.htm [4] 张星, 张祥林.大气波导对雷达测距和测高的影响.火力与指挥控制, 2006, 31(8): 84-90. http://www.cnki.com.cn/Article/CJFDTOTAL-XDFJ200802021.htm [5] 王华, 张永刚, 张宇, 等. 大气波导对多普勒气象雷达的影响分析//中国气象学会2006年年会论文集. 2006: 877-883. [6] 何彩芬, 黄旋旋, 丁烨毅.宁波非气象雷达回波的人工智能识别及滤波.应用气象学报, 2007, 18(6): 856-863. doi: 10.11898/1001-7313.200706129 [7] Turton J D, Bennetts D A, Farmer S F G. An introduction to radio ducting. Mateo Mag, 1988, 117: 245-254. https://www.researchgate.net/publication/285863675_An_introduction_to_radio_ducting [8] 潘中伟, 刘成国, 郭丽.东南沿海波导结构的预报方法.电波科学学报, 1996, 11(3): 58-64. http://www.cnki.com.cn/Article/CJFDTOTAL-DBKX603.009.htm [9] 刘成国, 黄际英, 江长荫.东南沿海对流层大气波导结构的出现规律.电波科学学报, 2002, 17(5): 509-513. http://www.cnki.com.cn/Article/CJFDTOTAL-DBKX200205015.htm [10] 胡晓华, 费建芳, 李娟, 等.一次受台风影响的大气波导过程分析和数值模拟.海洋预报, 2007, 24(2): 17-25. doi: 10.11737/j.issn.1003-0239.2007.02.003 [11] 胡晓华, 费建芳, 张翔, 等.一次大气波导过程的数值模拟.气象科学, 2008, 28(3): 294-300. http://www.cnki.com.cn/Article/CJFDTOTAL-QXKX200803009.htm [12] 王振会, 郝晓静, 张玉生, 等.一次台风过程大气波导特征分析.安徽农业科学, 2009, 37(3): 1198-1200. http://www.cnki.com.cn/Article/CJFDTOTAL-AHNY200903118.htm [13] 官莉, 顾松山, 火焰, 等.大气波导形成条件及传播路径模拟.南京气象学院学报, 2003, 26(5): 631-637. http://www.cnki.com.cn/Article/CJFDTOTAL-NJQX200305007.htm [14] 苗世光, 孙桂平, 马艳, 等.青岛奥帆赛高分辨率数值模式系统研制与应用.应用气象学报, 2009, 20(3): 370-378. doi: 10.11898/1001-7313.20090315 [15] 王建捷, 王迎春, 崔波, 等.北京地区中尺度非静力数值预报系统的开发与实时预报应用.应用气象学报, 1999, 10(4): 385-393. http://qikan.camscma.cn/jams/ch/reader/view_abstract.aspx?file_no=19990497&flag=1 [16] 穆海振, 徐家良, 柯晓新, 等.高分辨率数值模式在风能资源评估中的应用初探.应用气象学报, 2006, 17(2): 152-159. doi: 10.11898/1001-7313.20060204 [17] 王鹏云, 潘在桃.中尺度业务预报试验数值模式系统.应用气象学报, 1992, 3(3): 257-265. http://qikan.camscma.cn/jams/ch/reader/view_abstract.aspx?file_no=19920345&flag=1 [18] Atkinson B W, Li J G, Plant R S. Numerical modeling of the propagation environment in the atmospheric boundary layer over the Persian Gulf. J Apple Meteor, 2001, 40: 586-683. doi: 10.1175/1520-0450(2001)040<0586:NMOTPE>2.0.CO;2 [19] Atkinson B W, Zhu M. Coastal effect on radar propagation in atmospheric ducting conditions. Meteorol Appl, 2006, 13: 53-62. doi: 10.1017/S1350482705001970 [20] Zhu M, Atkinson B W. Simulated climatology of atmospheric ducts over the Persian Gulf area. Bound Layer Meteor, 2005, 115: 433-452. doi: 10.1007/s10546-004-1428-1 [21] Burk S D, Thompson W T. Meso-scale modeling of summertime refractive conditions in the southern California Bight. J Appl Meteorol, 1997, 36:22-31. doi: 10.1175/1520-0450(1997)036<0022:MMOSRC>2.0.CO;2 [22] 陈莉, 高山红, 康士峰, 等.中国近海大气波导的时空特征分析.电波科学学报, 2009, 24(4): 702-708. http://www.cnki.com.cn/Article/CJFDTOTAL-DBKX200904022.htm [23] Bean B R, Dutton E J. Radio Meteorology. New York: Dover Publication Inc, 1968:435. [24] Babin S M. A case study if sub refractive conditions at Wallops Island, Virginia. J Appl Meteorol, 1995, 34: 1028-1038. doi: 10.1175/1520-0450(1995)034<1028:ACSOSC>2.0.CO;2 [25] Babin S M. Surface duct height distributions for Wallops Island Virginia, 1985—1994.J Appl Meteorol, 1996, 35: 86-93. doi: 10.1175/1520-0450(1996)035<0086:SDHDFW>2.0.CO;2 [26] 陈莉. 中国近海大气波导的统计特征分析及演变机理的数值研究. 青岛: 中国海洋大学, 2010. [27] Hong S Y, Noh Y, Dudhia J. A new vertical diffusion package with an explicit treatment of entrainment processes. Mon Wea Rev, 2006, 134:2318-2341. doi: 10.1175/MWR3199.1 [28] Kain J S, Fritsch J M. A one-dimensional entraining/detraining plume model and its application in convective parameterization. J Atmos Sci, 1990, 47: 2784-2802. doi: 10.1175/1520-0469(1990)047<2784:AODEPM>2.0.CO;2 [29] Lin Y L, Farley R D, Orville H D. Bulk parameterization of the snow field in a cloud model. J Climate Appl Meteor, 1983, 22: 1065-1092. doi: 10.1175/1520-0450(1983)022<1065:BPOTSF>2.0.CO;2 [30] Mlawer E J, Taubman S J, Brown P D, et al. Radiative transfer for inhomogeneous atmospheres: RRTM, a validated correlated-k model for the longwave. J Geophys Res, 1997, 102: 16663-16682. doi: 10.1029/97JD00237 [31] Chen F, Dudhia J. Coupling an advanced land-surface/hydrology model with the Penn State/NCAR MM5 modeling system. Part Ⅰ:Model description and implementation. Mon Wea Rev, 2001, 129: 569-585. doi: 10.1175/1520-0493(2001)129<0569:CAALSH>2.0.CO;2 [32] 高山红, 齐伊玲, 张守宝, 等.利用循环3DVAR改进黄海海雾数值模拟初始场Ⅰ:WRF数值试验.中国海洋大学学报, 2010, 40(10): 1-9. http://www.cnki.com.cn/Article/CJFDTOTAL-QDHY201010000.htm [33] Parrish D F, Derber J C. The national meteorological center's spectral statistical-interpolation analysis system. Mon Wea Rev, 1992, 120: 1747-1763. doi: 10.1175/1520-0493(1992)120<1747:TNMCSS>2.0.CO;2 -

 下载:
下载:

 点击查看大图
计量
- 摘要浏览量: 3247
- HTML全文浏览量: 1083
- PDF下载量: 2266
- 被引次数: 0
