
 设为首页
设为首页 加入收藏
加入收藏

Contrastive Study on Two Boundary Layer Parameterization Schemes Using TWP-ICE Experiment Data
-
摘要: 利用高分辨率WRF单气柱模式,选取了两种边界层参数化方案 (YSU,MYJ),对TWP-ICE (Tropical Warm Pool International Cloud Experiment) 试验期间的个例进行数值模拟,比较了两种方案对边界层结构、云和降水模拟的影响。结果表明:季风活跃期,YSU方案模拟的湍流交换系数较小,湍流混合偏弱,边界层内热通量偏小,使地表热量和水汽不易向上输送,水汽含量在近地表明显偏多,而在边界层及其以上大气层具有显著的干偏差,因此该方案模拟的云中液态水和固态水含量偏低,云量偏少,降水率偏小;MYJ方案对于季风活跃期的边界层结构具有较好的模拟能力,其模拟的云和降水更为准确。季风抑制期,MYJ方案模拟的夜间边界层结构存在较大误差,这是因为该方案模拟的夜间湍流交换系数较大,湍流混合偏强,边界层内热通量偏大,模拟的位温和水汽混合比在边界层内随高度变化较小,而观测廓线在边界层内存在较大梯度。季风抑制期两种方案模拟的云和降水均比观测值偏多,方案之间的差异较小。Abstract:
TWP-ICE (Tropical Warm Pool International Cloud Experiment) is carried out at Darwin Station in northern Australia by Europe and the United States, observations can be used for numerical simulation study. High resolution WRF single column model is used to simulate a case during TWP-ICE with two boundary layer parameterization schemes (YSU and MYJ schemes). Simulation results of boundary layer structure, cloud and precipitation with these two boundary layer parameterization schemes are compared.The whole simulation process can be divided into two phases, which are monsoon active period and monsoon suppressed period. During monsoon active period, the boundary layer structure simulated by MYJ scheme is better than YSU scheme. Small turbulent exchange coefficient is simulated by YSU scheme leading to weak turbulent mixing and small heat flux in boundary layer during monsoon active period, which prevents the heat and moisture of surface from upward transporting. Therefore, the simulated potential temperature and vapor mixing ratio are significantly higher than observations at the bottom boundary layer, and the simulated vapor mixing ratio is lower than observation at the top of boundary layer. During monsoon suppressed period, great turbulent exchange coefficient is simulated by MYJ scheme at night, leading to strong turbulent mixing and large heat flux, and the simulated potential temperature and vapor mixing ratio variation with height are smaller than observations, so MYJ scheme cannot simulate the structure of nocturnal boundary layer well.Also, the simulation of cloud and precipitation is affected by the boundary layer parameterization schemes. During monsoon active period, weak turbulent mixing is simulated by YSU scheme, leading to the wet bias near the surface and dry bias above. As a result, YSU scheme simulates smaller cloud liquid water content and frozen water content, less cloud fraction and lower precipitation rate. During the same period, MYJ scheme simulates the boundary layer structure well, and can better simulate cloud and precipitation. During monsoon suppressed period, the cloud fraction and precipitation simulated with both schemes show no significant difference, both exceeding observations.
-
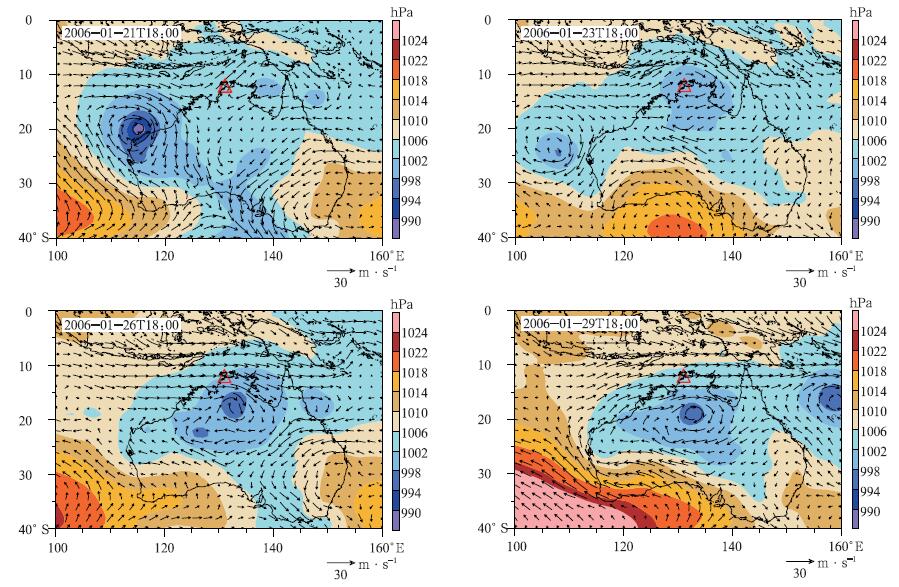
图 1 FNL资料的海平面气压场 (阴影) 和850 hPa风场 (矢量)(三角符号代表达尔文站)
Fig. 1 Sea level pressure (shaded) and 850 hPa wind (arrow) from FNL data (triangle mark indicates the location of Darwin Station)

图 2 YSU方案和MYJ方案模拟的湍流交换系数随时间和高度分布
Fig. 2 Time-height cross sections of simulated turbulent exchange coefficient by YSU scheme and MYJ scheme

图 3 两种方案模拟的热通量随时间和高度分布
(a) YSU方案模拟的感热通量, (b) MYJ方案模拟的感热通量, (c) YSU方案模拟的潜热通量, (d) MYJ方案模拟的潜热通量
Fig. 3 Time-height cross sections of simulated heat flux by two schemes
(a) sensible heat flux simulated by YSU scheme, (b) sensible heat flux simulated by MYJ scheme, (c) latent heat flux simulated by YSU scheme, (d) latent heat flux simulated by MYJ scheme
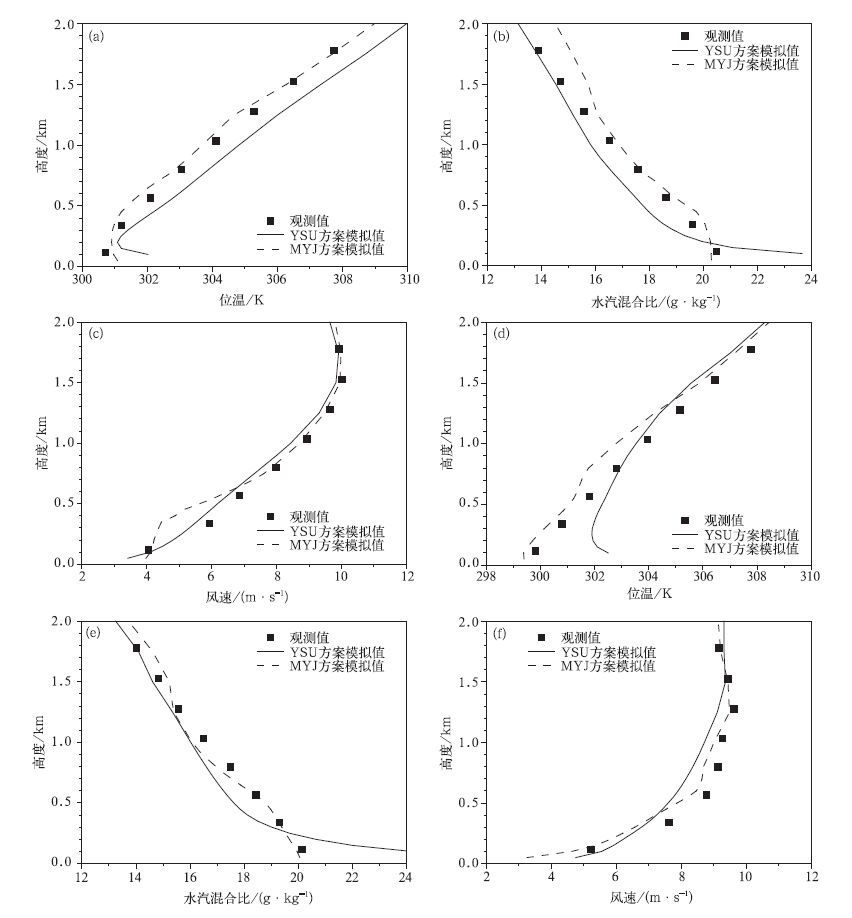
图 4 季风活跃期 (2006年1月21—25日) 观测和模拟的气象要素垂直廓线
(a)03:00平均位温, (b)03:00平均水汽混合比, (c)03:00平均风速, (d)15:00平均位温, (e)15:00平均水汽混合比, (f)15:00平均风速
Fig. 4 Mean vertical profiles of observed and simulated meteorological elements during active monsoon (21 January 2006-25 January 2006)
(a) potential temperature at 0300 UTC, (b) vapour mixing ratio at 0300 UTC, (c) wind speed at 0300 UTC, (d) potential temperature at 1500 UTC, (e) vapour mixing ratio at 1500 UTC, (f) wind speed at 1500 UTC
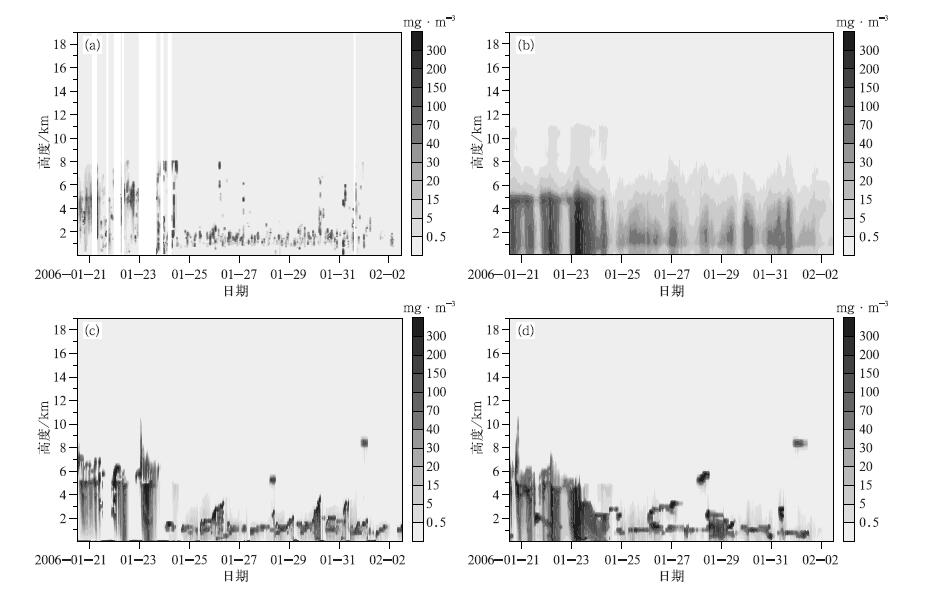
图 6 观测和模拟的液态水含量随时间和高度分布
(a) 雷达观测, (b) 云模式模拟值, (c) YSU方案模拟值, (d) MYJ方案模拟值
Fig. 6 Time-height cross sections of observed and simulated liquid water content
(a) observed by radar, (b) simulated by cloud-resolving model, (c) simulated by YSU scheme, (d) simulated by MYJ scheme
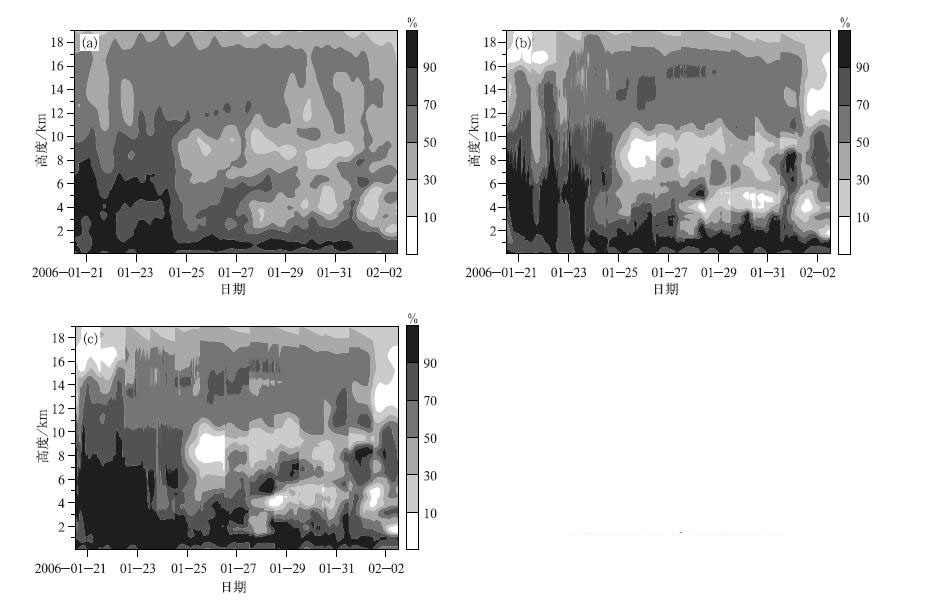
图 7 观测和模拟的相对湿度随时间和高度分布
(a) 观测值, (b) YSU方案模拟值, (c) MYJ方案模拟值
Fig. 7 Time-height cross sections of observed and simulated relative humidity
(a) observed, (b) simulated by YSU scheme, (c) simulated by MYJ scheme

图 8 观测和模拟的固态水含量随时间和高度分布
(a) 卫星观测, (b) 云模式模拟值, (c) YSU方案模拟值, (d) MYJ方案模拟值
Fig. 8 Time-height cross sections of observed and simulated frozen water content
(a) observed by satellite, (b) sumulated by cloud-resolving model, (c) simulated by YSU scheme, (d) simulated by MYJ scheme
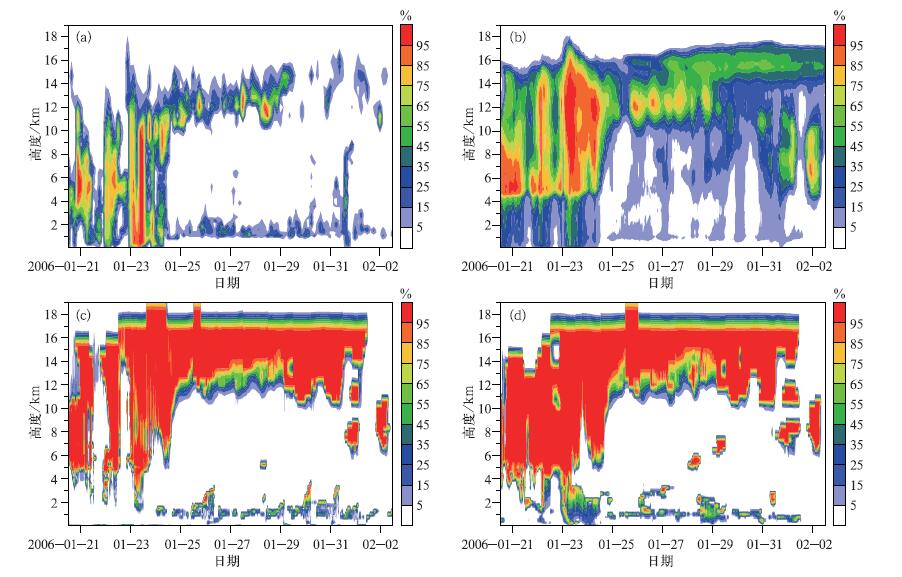
图 9 观测和模拟的云量随时间和高度分布
(a) 观测值, (b) 云模式模拟值, (c) YSU方案模拟值, (d) MYJ方案模拟值
Fig. 9 Time-height cross sections of observed and simulated cloud fraction
(a) observed, (b) simulated by cloud-resolving model, (c) simulated by YSU scheme, (d) simulated by MYJ scheme
-
[1] 顾建峰, 殷鹤宝, 徐一鸣, 等.MM5在上海区域气象中心数值预报中的改进和应用.应用气象学报, 2000, 11(2):189-198. http://qikan.camscma.cn/jams/ch/reader/view_abstract.aspx?file_no=20000228&flag=1 [2] Xie B, Fung J C H, Chan A, et al.Evaluation of nonlocal and local planetary boundary layer schemes in the WRF model.J Geophys Res, 2012, 117:D12103. https://www.researchgate.net/publication/258662802_Evaluation_of_nonlocal_and_local_planetary_boundary_layer_schemes_in_the_WRF_model [3] Xie B, Hunt J C R, Carruthers D J, et al.Structure of the planetary boundary layer over Southeast England:Modeling and measurements.J Geophys Res, 2013, 118:7799-7818. https://www.researchgate.net/publication/260722166_Structure_of_the_planetary_boundary_layer_over_Southeast_England_Modeling_and_measurements [4] Cintineo R, Otkin J, Xue M, et al.Evaluating the performance of planetary boundary layer and cloud microphysical parameterization schemes in convection-permitting ensemble forecasts using synthetic GOES-13 satellite observations.Mon Wea Rev, 2014, 142:163-182. doi: 10.1175/MWR-D-13-00143.1 [5] 陈炯, 王建捷.北京地区夏季边界层结构日变化的高分辨模拟对比.应用气象学报, 2006, 17(4):403-411. doi: 10.11898/1001-7313.20060403 [6] 刘梦娟, 陈敏.BJ-RUC系统对北京夏季边界层的预报性能评估.应用气象学报, 2014, 25(2):212-221. doi: 10.11898/1001-7313.20140211 [7] Hong S, Pan H.Nonlocal boundary layer vertical diffusion in a medium-range forecast model.Mon Wea Rev, 1996, 124:2322-2339. doi: 10.1175/1520-0493(1996)124<2322:NBLVDI>2.0.CO;2 [8] Jankov I, Gallus W A, Segal M, et al.The impact of different WRF model physical parameterizations and their interactions on warm season MCS rainfall.Wea Forecasting, 2005, 20:1048-1060. doi: 10.1175/WAF888.1 [9] Jankov I, Schultz P J, Anderson C J, et al.The impact of different physical parameterizations and their interactions on cold season QPF in the American River Basin.J Hydrometeor, 2007, 8:1141-1151. doi: 10.1175/JHM630.1 [10] 王晨稀, 端义宏.短期集合预报技术在梅雨降水预报中的试验研究.应用气象学报, 2003, 14(1):69-78. http://qikan.camscma.cn/jams/ch/reader/view_abstract.aspx?file_no=20030108&flag=1 [11] 王康康, 张维桓, 秦凯兵.一η模式中高分辨边界层方案及对降水影响的数值试验.高原气象, 2004, 23(5):620-628. http://www.cnki.com.cn/Article/CJFDTOTAL-GYQX200405007.htm [12] 朱蓉, 徐大海.中尺度数值模拟中的边界层多尺度湍流参数化方案.应用气象学报, 2004, 15(5):543-555. http://qikan.camscma.cn/jams/ch/reader/view_abstract.aspx?file_no=20040567&flag=1 [13] 陈炯, 王建捷.边界层参数化方案对降水预报的影响.应用气象学报, 2006, 17(增刊I):11-17. http://www.cnki.com.cn/Article/CJFDTOTAL-YYQX2006S1001.htm [14] May P T, Mather J H, Vaughan G, et al.The tropcical warm pool international cloud experiment.Bull Amer Meteor Soc, 2008, 89:629-645. doi: 10.1175/BAMS-89-5-629 [15] Ghan S, Randall D, Xu K, et al.A comparison of single column model simulation of summertime midlatitude continental convection.J Geophys Res, 2000, 105:2091-2124. doi: 10.1029/1999JD900971 [16] Hack J J, Pedretti J A.Assessment of solution uncertainties in single-column modeling frameworks.J Climate, 2000, 13:352-365. doi: 10.1175/1520-0442(2000)013<0352:AOSUIS>2.0.CO;2 [17] Xie S, Hume T, Jakob C, et al.Observed large-scale structures and diabatic heating and drying profiles during TWP-ICE.J Climate, 2010, 23:57-79. doi: 10.1175/2009JCLI3071.1 [18] Zhang M H, Lin J L.Constrained variational analysis of sounding data based on column integrated budgets of mass, heat, moisture, and momentum:Approach and application to ARM measurements.J Atmos Sci, 1997, 54:1503-1524. doi: 10.1175/1520-0469(1997)054<1503:CVAOSD>2.0.CO;2 [19] Hong S, Noh Y, Dudhia J.A new vertical diffusion package with an explicit treatment of entrainment processes.Mon Wea Rev, 2006, 134:2318-2341. doi: 10.1175/MWR3199.1 [20] Janjic Z I.The Step-Mountain Eta Coordinate Model: Further developments of the convection, viscous sublayer, and turbulence closure schemes.Mon Wea Rev, 1994, 122:927-945. doi: 10.1175/1520-0493(1994)122<0927:TSMECM>2.0.CO;2 [21] Xu K, Randall D.A semiempirical cloudiness parameterization for use in climate model.J Atmos Sci, 1996, 53:3084-3102. doi: 10.1175/1520-0469(1996)053<3084:ASCPFU>2.0.CO;2 [22] Gibbs J A, Fedorovich E, Eijk A M J V.Evaluating Weather Research and Forecasting (WRF) model predictions of turbulent flow parameters in a dry convective boundary layer.J Appl Meteor Clim, 2011, 50:2429-2444. doi: 10.1175/2011JAMC2661.1 [23] Varble A, Fridlind A M, Zipser E J, et al.Evaluation of cloud-resolving model intercomparison simulations using TWP-ICE observations: Precipitation and cloud structure.J Geophys Res, 2011, 116:D12206, doi: 10.1029/2010JD015180. [24] 郑晓辉, 徐国强, 魏荣庆.GRAPES新云量计算方案的引进和影响试验.气象, 2013, 39(1):57-66. doi: 10.7519/j.issn.1000-0526.2013.01.007 [25] Clothiaux E E, Ackerman T P, Mace G G, et al.Objective determination of cloud heights and radar reflectivities using a combination of active remote sensors at the ARM CART sites.J Appl Meteor, 2000, 39:645-665. doi: 10.1175/1520-0450(2000)039<0645:ODOCHA>2.0.CO;2 [26] Xie S, Cederwall R T, Zhang M.Developing long-term single-column model/cloud system-resolving model forcing data using numerical weather prediction products constrained by surface and top of the atmosphere observations.J Geophys Res, 2004, 109:D01104, doi: 10.1029/2003JD004045. -

 下载:
下载:

 点击查看大图
计量
- 摘要浏览量: 2866
- HTML全文浏览量: 1148
- PDF下载量: 977
- 被引次数: 0
