
 设为首页
设为首页 加入收藏
加入收藏

Identifying the Interference of Spaceborne Microwave Radiometer over Large Water Area
-
摘要: 卫星微波仪器接收的来自地气系统的被动热辐射与主动传感器发射的信号相混合,被称为无线电频率干扰 (RFI),在主动及被动微波遥感探测领域已成为越来越严重的问题。海洋表面反射的静止通讯、电视卫星下发信号是干扰海洋上星载被动微波辐射计观测的主要来源。该文以先进的微波扫描辐射计AMSR-E为例,采用双主成分分析方法对美国陆地上大面积水体、附近洋面和中国海岸线附近的RFI进行识别,研究表明:美国附近洋面区域星载微波辐射计18.7 GHz通道观测主要受静止电视卫星DirecTV的干扰,由于海表反射引起的RFI非常依赖于静止卫星和星载被动仪器的相对几何位置,只有当闪烁角θ(观测视场镜面反射的静止电视卫星信号方向与视场到星载仪器方向之间的夹角) 较小时卫星观测易受到污染。美国海洋区域较强RFI分布在五大湖区域,离内陆越近RFI越强,东西海岸RFI较强,而整个南海岸干扰相对较弱。中国海岸线附近AMSR-E 6.925 GHz通道观测受RFI影响,而18.7 GHz通道观测未受到干扰。
-
关键词:
- 微波;
- AMSR-E;
- 无线电频率干扰 (RFI);
- 识别
Abstract: The phenomenon of satellite-measured passive microwave thermal emission from natural surface and atmosphere being mixed with signals from active sensors is referred as radio-frequency interference (RFI). Due to increasing conflicts between scientific and commercial users of the radio spectrum, RFI is an increasing serious problem for microwave active and passive remote sensing. RFI greatly affects the quality of data and retrieval products from space-borne microwave radiometry, as the C-band and X-band of spaceborne microwave radiometer operate in unprotected frequency bands. Interference signals over land come dominantly from lower frequency active microwave transmitters, including radar, air traffic control, cell phone, garage door remote control, GPS signal on highway, defense tracking and vehicle speed detection for law enforcement. The signal emanating from geostationary communication and television satellites that reflect off the ocean surface is the major interference source over ocean of spaceborne passive microwave imagers. RFI detection and correction of low-frequency radiances over large water area is extremely important before these data being used for either geophysical retrievals or data assimilation in numerical weather prediction models.RFI over ocean and inland large water area of North America, as well as over the coastline of China are identified and analyzed based on Advanced Microwave Scanning Radiometer (AMSR-E) observations using double principal component analysis (DPCA) algorithm. The AMSR-E instrument is primarily designed to enhance cloud and surface sensing capabilities. The DPCA method takes advantage of the multi-channel correlation for natural surface radiations, as well as the de-correlation between different RFI contaminated frequencies. Results show that the DPCA method works well in detecting the location and intensity of RFI over ocean and large water area. The AMSR-E observation over the ocean of America at 18.7 GHz is mainly interfered by geostationary television satellites DirecTV. The RFI location and intensity from the ocean reflection of downlink radiation highly depends upon the relative geometry between the geostationary satellite and the measuring passive sensor. Only the field of views with smaller glint angle (defined as the angle between the geostationary specular reflection vector and the AMSR-E line-of-sight vector) is easily affected by RFI. The stronger RFI distribute near the Great Lakes of America, and the RFI magnitude of East and West Coast is stronger than south coast. AMSR-E observations of 6.925 GHz are contaminated by RFI along the coastline of China, while observations of 18.7 GHz are not affected.-
Key words:
- microwave;
- AMSR-E;
- RFI;
- identification
-
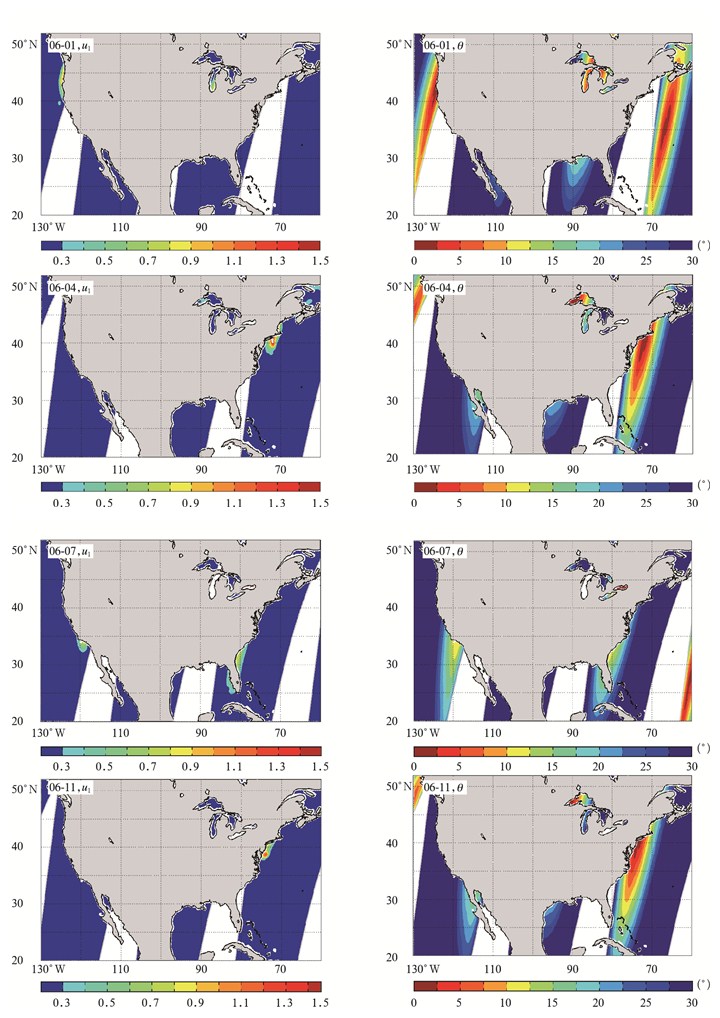
图 1 2011年6月1日、4日、7日和11日AMSR-E降轨18.7 GHz通道水平极化第1主成分系数u1和静止卫星闪烁角θ分布
Fig. 1 The first PC coefficient u1 and the geostationary satellite gilint angle θ of AMSR-E 18.7 GHz with horizontal polarization of decending node in June 2011
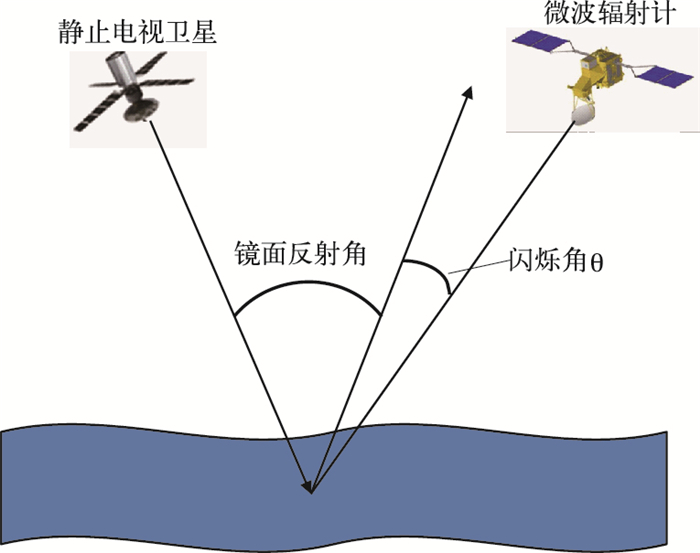
图 2 洋面反射静止卫星下行发射及闪烁角θ的示意图
Fig. 2 The sketch map of the reflected geostationary TV satellite downlink signals by ocean surface and the definition of glint angle θ

图 3 2011年6月1—16日AMSR-E降轨观测平均的闪烁角θ分布
Fig. 3 The average glint angle θ based on AMSR-E decending observations from 1 June to 16 June in 2011
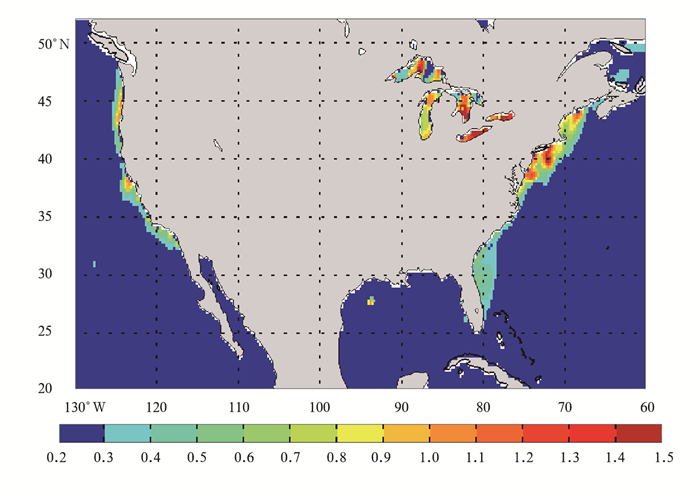
图 4 2011年6月1—16日综合AMSR-E降轨18.7 GHz通道水平极化第1主成分系数u1分布
Fig. 4 The synthesized distribution of first PC coefficient u1 based on AMSR-E 18.7 GHz decending observations with horizontal polarization from 1 June to 16 June in 2011
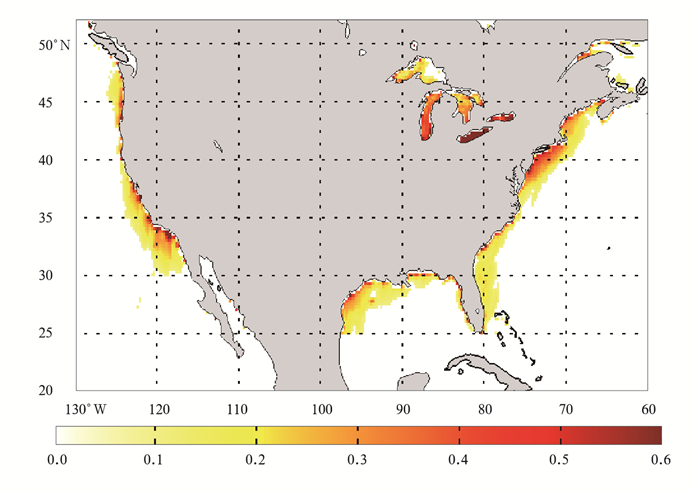
图 5 2011年6月1日—7月2日美国海洋区域18.7 GHz通道水平极化月平均RFI强度分布
Fig. 5 The monthly average RFI intensity at 18.7 GHz horizontal polarization over America ocean from 1 June to 2 July in 2011
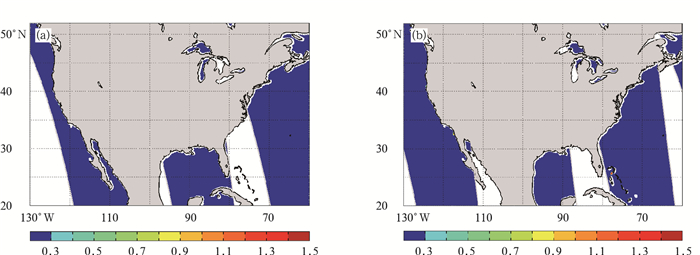
图 6 2011年6月4日 (a) 和7日 (b) AMSR-E升轨18.7 GHz水平极化第1主成分系数u1
Fig. 6 The first PC coefficient u1 of AMSR-E 18.7 GHz with horizontal polarization of acending node on 4 June (a) and 7 June (b) in 2011
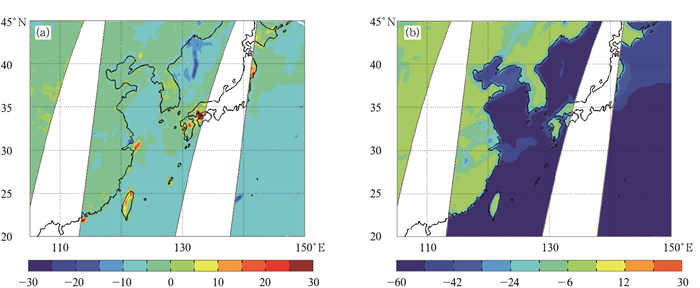
图 7 AMSR-E识别的中国东部海岸线附近2011年6月8日6.9 GHz (a) 和18.7 GHz (b) 通道水平极化RFI的分布
Fig. 7 The identified RFI along China east coast of AMSR-E 6.9 GHz (a) and 18.7 GHz (b) horizontal polarization on 8 June 2011

图 8 2011年6月8日FY-3 MWRI 18.7 GHz通道水平极化亮温 (a) 和RFI (b) 分布
Fig. 8 The brightness temperature (a) and the RFI (b) of FY-3 MWRI 18.7 GHz horiontal polarization on 8 June 2011
表 1 AMSR-E通道特性
Table 1 AMSR-E instrument description
通道 中心频率/GHz 极化方式 带宽/MHz 空间分辨率 灵敏度/K 1 6.925 水平 350 74 km×43 km 0.3 2 6.925 垂直 350 74 km×43 km 0.3 3 10.65 水平 100 51 km×30 km 0.6 4 10.65 垂直 100 51 km×30 km 0.6 5 18.7 水平 200 27 km×16 km 0.6 6 18.7 垂直 200 27 km×16 km 0.6 7 23.8 水平 400 31 km×18 km 0.6 8 23.8 垂直 400 31 km×18 km 0.6 9 36.5 水平 1000 14 km×8 km 0.6 10 36.5 垂直 1000 14 km×8 km 0.6 11 89 水平 3000 6 km×4 km 1.1 12 89 垂直 3000 6 km×4 km 1.1  下载: 导出CSV
表 2 主要的静止电视卫星
Table 2 Major geostationary TV satellite
卫星名称 经度 覆盖区域 频率/GHz DirecTV 10 103°W 美国 18.8~19.3 DirectV 11 99°W 美国 18.3~18.8 Hot Bird 13°E 欧洲 10.7~12.75 Atlantic Bird 7°W 欧洲 10.7~11.7 Astra 19.2°E 欧洲 10.7~10.95
下载: 导出CSV
表 3 RFI区闪烁角θ取值的百分比 (单位:%)
Table 3 The percentage of glint angle θ in different range at RFI area (unit:%)
日期 0°≤θ < 5° 5°≤θ < 15° θ≥15° 2011-06-01 28.59 71.41 0 2011-06-04 38.21 50.81 10.98 2011-06-07 11.42 78.53 10.05 2011-06-11 55.27 44.13 0.6
下载: 导出CSV
-
[1] Zou X, Zhao J, Weng F, et al.Detection of radio-frequency interference signal over land from FY-3B microwave radiation imager (MWRI).IEEE Trans Geosci Remote Sens, 2012, 50(12): 4994-5003. doi: 10.1109/TGRS.2012.2191792 [2] 张秀再, 郭业才, 陈金力, 等.L与X波段气象卫星信道概率统计特性.应用气象学报, 2012, 23(4):478-484. doi: 10.11898/1001-7313.20120411 [3] Wu Y, Weng F.Detection and correction of AMSR-E radio-frequency interference.Acta Meteor Sinica, 2011, 25(5):669-681. doi: 10.1007/s13351-011-0510-0 [4] 杨晓峰, 陆其峰, 杨忠东.基于AMSR-E土壤湿度产品的LIS同化试验.应用气象学报, 2013, 24(4):435-445. doi: 10.11898/1001-7313.20130406 [5] Keiji I, Norimasa I, Taikan O.AMSR Series in A-Train-Status/Products/Services for GCOM-W1.A-Train User Workshop, 2010. https://www.researchgate.net/publication/258720887_Status_of_AMSR2_on_GCOM-W1 [6] 任强, 董佩明, 薛纪善.台风数值预报中受云影响微波卫星资料的同化试验.应用气象学报, 2009, 20(2):137-146. doi: 10.11898/1001-7313.20090202 [7] 张淼, 卢乃锰, 谷送岩, 等.风云三号 (02) 批卫星微波氧气吸收通道降水特性.应用气象学报, 2012, 23(2):223-230. doi: 10.11898/1001-7313.20120211 [8] 刘健, 张里阳.气象卫星高空间分辨率数据的云量计算与检验.应用气象学报, 2011, 22(1):35-45. doi: 10.11898/1001-7313.20110104 [9] Li L, Njoku E G, Im E, et al.A preliminary survey of radio-frequency interference over the US in Aqua AMSR-E data.IEEE Trans Geosci Remote Sens, 2004, 42(2):380-390. doi: 10.1109/TGRS.2003.817195 [10] Njoku E G, Ashcroft P, Chan T K, et al.Global survey and statistics of radio-frequency interference in AMSR-E land observations.IEEE Trans Geosci Remote Sens, 2005, 43(5): 938-947. doi: 10.1109/TGRS.2004.837507 [11] Ellingson S W, Johnson J T.A polarimetric survey of radio-frequency interference in C-and X-Bands in the continental United States using WindSat radiometry.IEEE Trans Geosci Remote Sens, 2006, 44(3):540-548. doi: 10.1109/TGRS.2005.856131 [12] Li L, Gaiser P W, Bettenhausen M H, et al.WindSat radio-frequency interference signature and its identification over land and ocean.IEEE Trans Geosci Remote Sens, 2006, 44(3):530-539. doi: 10.1109/TGRS.2005.862503 [13] Zhao J, Zou X, Weng F.WindSat radio-frequency interference signature and its identification oer Greenland and Antarctic.IEEE Trans Geosci Remote Sens, 2013, 51(9):4830-4839. doi: 10.1109/TGRS.2012.2230634 [14] Adams I S, Bettenhausen M H, Gaiser P W, et al.Identification of ocean-reflected radio-frequency interference using WindSat retrieval Chi-Square probability.IEEE Geoscience and Remote Sensing Letters, 2010, 7(2):406-410. doi: 10.1109/LGRS.2009.2037446 [15] Kawanishi T, Sezai T, ITO Y, et al.The advanced microwave scanning radiometer for the earth observing system (AMSR-E), NASDA's contribution to the EOS for global energy and water cycle studies.IEEE Trans Geosci Remote Sens, 2003, 41(2):184-194. doi: 10.1109/TGRS.2002.808331 [16] AMSR-E Data Users Handbook (5th Edition).Japan Aerospace Exploration Agency, 2-1, 2009. [17] Chelle G, Marty B, Kyle H, et al.Algorithm Development GCOM-W AMSR-2 Ocean Product Suite.Joint PI Workshop of Global Environment Observation Mission, 2010. http://www.star.nesdis.noaa.gov/star/documents/meetings/2014JPSSAnnual/dayTwo/03_Session3_Boukabara_MiRS_talk_JPSS_v2.pdf [18] Zhang P, Yang J, Dong C, et al.General introduction on payloads, ground segment and data application of Fengyun 3A.Frontiers of Earth Science in China, 2009, 3:367-373. doi: 10.1007/s11707-009-0036-2 [19] 王家胜.我国数据中继卫星系统发展建议.航天器工程, 2011, 20(2):1-8. http://www.cnki.com.cn/Article/CJFDTOTAL-HTGC201102002.htm [20] [2014-04-12]. http://www.asiatvro.com/channelinfo/128.htm. -

 点击查看大图
计量
- 摘要浏览量: 3834
- HTML全文浏览量: 1245
- PDF下载量: 904
- 被引次数: 0
