
 设为首页
设为首页 加入收藏
加入收藏

Simulating Evapotranspiration of Rain-fed Soybean Field Based on P-T Model
-
摘要: 基于2005—2007年涡度相关系统实测值和小气候观测资料,利用Priestley-Taylor (简称P-T) 模型对三江平原雨养大豆田5—10月的蒸散量进行模拟和分析。结果表明:P-T模型参数α采用常规值1.26时,大豆出苗前和生长期模拟值明显大于实测值,大豆收割后模拟值明显小于实测值,模型不能用于模拟大豆田蒸散量。大豆生长期内参数α与叶面积指数呈对数正相关关系;当饱和水汽压差较小时,参数α与其呈幂函数正相关关系,当饱和水汽压差较大时,参数α与其呈幂函数负相关关系。大豆出苗前参数α与太阳辐射呈正相关关系,与饱和水汽压差呈负相关关系;大豆收割后参数α与风速呈显著正相关关系。依据回归方程修正参数α后,多个用于检验模型模拟效果的统计量均表明:P-T模型对不同时期大豆田蒸散量的模拟精度明显提高,能够较好地估算大豆田蒸散量。总而言之,P-T模型必须修正参数α方可用于估算三江平原雨养大豆田蒸散量。Abstract: Based on eddy covariance measurements and microclimate observations available from 2005 to 2007, the simulating accuracy of evapotranspiration with P-T model of rain-fed soybean field from May to October in Sanjiang Plain is analyzed. Results indicate that simulated values of evapotranspiration by P-T model with conventional parameter (1.26) are significantly higher than observations before emergence and during the growing season of soybean, and the mean bias error (MBE) are 1.65 mm·d-1 and 1.22 mm·d-1. However, simulated values are significantly lower than measurements after harvest, with the MBE of-0.74 mm·d-1. Modeling efficiency (ME) of P-T model are all negative values, which indicates that the model cannot be used in predicting evapotranspiration of soybean field during different periods. The cause may have much to do with the parameter, which is assumed as constant value of 1.26. According to measurements of evapotranspiration, the parameter is derived and shows obviously increasing trend during the whole observation periods. Average values of parameter before emergence, during the growing season, and after harvest are 0.76, 0.86 and 2.20, respectively. It is obvious that the parameter varies according to the growing phase, and it is necessary to modify the parameter based on the measured evapotranspiration of rain-fed soybean field in Sanjiang Plain.Statistical analysis shows that leaf area index (LAI) is an important factor affecting evapotranspiration of soybean field. During the growing season, the parameter is creased with increasing LAI, following a logarithmic equation and a positive correlation. Vapor pressure deficit (VPD) is the direct driving force of transporting vapor from the surface to the surrounding atmosphere. The relationship between and VPD can be described empirically by a piecewise function: When the VPD is greater than 5.05 hPa, it's a positive power function, but when the VPD is lower than 5.05, it's a negative power function. The parameter is positively related to solar radiation and negatively related to VPD before soybean emergency and is positively related to wind speed after soybean harvest.With parameter modified by using linear or non-linear regression equation, the estimation accuracy of P-T model under different periods are improved markedly. Before soybean emergency, MBE and root mean square error (RMSE) are 0.06 mm·d-1 and 0.60 mm·d-1, reduced by 96.4% and 71.4%, respectively. ME is improved from a negative to a positive value (0.57), close to the ideal value of 1. During the growing season, MBE and RMSE are 0.15 mm·d-1 and 0.92 mm·d-1, reduced by 87.7% and 38.3%, respectively, and ME from a negative to a positive value (0.28). After soybean harvest, MBE and RMSE are-0.21 mm·d-1 and 0.41 mm·d-1, reduced by 71.6% and 52.3%, respectively, ME turns from a negative into a positive value (0.42). It indicates that the modified P-T model can simulate the evapotranspiration of soybean field. In conclusion, P-T model is suitable to simulate the evapotranspiration only when the parameter is modified.
-
Key words:
- P-T model;
- parameter α;
- evapotranspiration;
- rain-fed soybean field
-
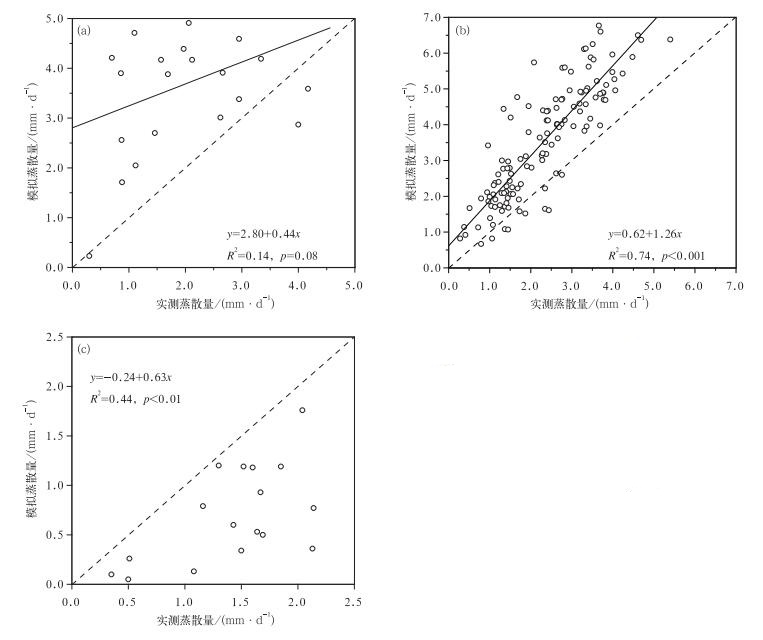
图 1 基于P-T模型参数α常规值的大豆田不同阶段蒸散量模拟值与实测值比较
(a) 出苗前,(b) 生长期,(c) 收割后
Fig. 1 Comparison of observed evapotranspirations and those simulated by P-T model based on conventional values of α during different period
(a) before emergence, (b) growing season, (c) after harvest
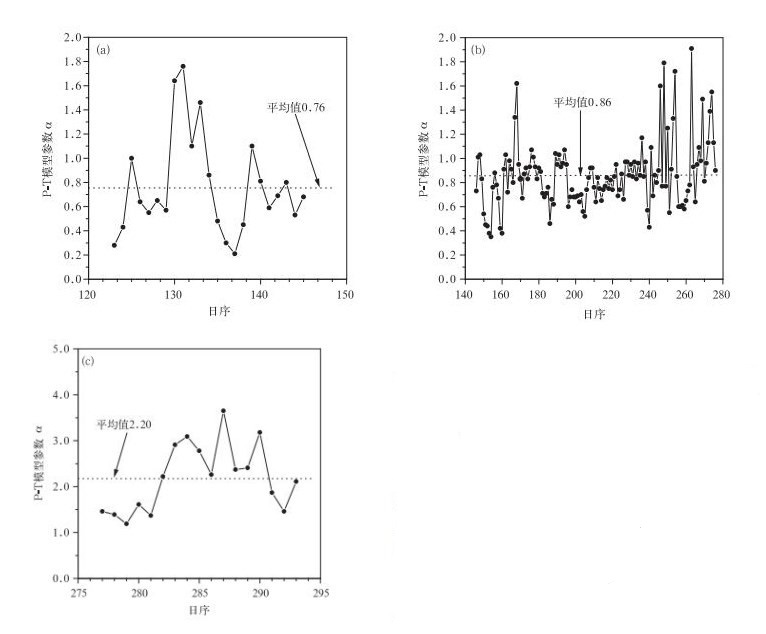
图 2 不同时期大豆田P-T模型参数α变化特征
(a) 出苗前,(b) 生长期,(c) 收割后
Fig. 2 Variation characteristics parameter α of P-T model over soybean field during different period
(a) before emergence, (b) growing season, (c) after harvest
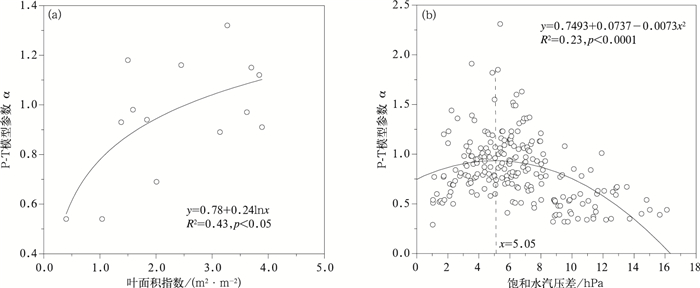
图 3 大豆生长期内叶面积指数 (a) 和饱和水汽压差 (b) 对P-T模型参数α的影响
Fig. 3 Effects of LAI (a) and D(b) on parameter α of P-T model during growing season of soybean
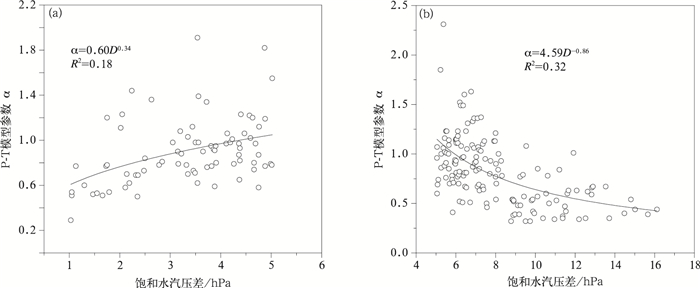
图 4 不同饱和水汽压差 (D) 对P-T模型参数α的影响
(a)D<5.05 hPa,(b)D>5.05 hPa
Fig. 4 Effects of D on parameter α of P-T model under different conditions
(a)D < 5.05 hPa, (b)D > 5.05 hPa
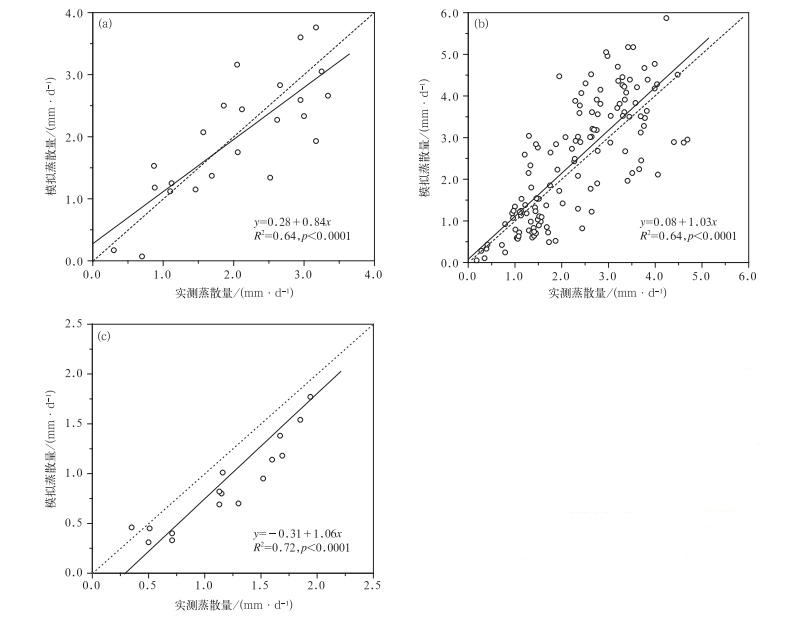
图 5 基于P-T模型参数α修正值的大豆田不同阶段蒸散量模拟值与实测值比较
(a) 出苗前,(b) 生长期,(c) 收割后
Fig. 5 Comparison of observed evapotranspirations and those simulated by P-T model based on modified α value during different periods
(a) before emergence, (b) growing season, (c) after harvest
表 1 大豆发育期状况
Table 1 Developmental stages of soybean
发育阶段 开始日期 2005年 2006年 2007年 播种前 05-08 05-01 05-04 播种期 05-25 05-17 05-20 出苗期 06-07 05-26 06-10 开花期 07-03 07-05 07-12 结荚期 07-28 08-10 07-30 鼓粒期 08-17 08-25 08-10 成熟期 09-12 09-15 09-25 收割期 09-28 10-04 10-05 收割后 10-23 10-23 10-23 注:播种前日期为涡度相关系统观测开始日期,收割后日期为涡度相关系统观测结束日期。  下载: 导出CSV
表 2 大豆生长期P-T模型参数α的非线性统计模型
Table 2 Non-linear statistical models of parameter α of P-T during soybean growing season
条件 参数a(±标准差) 参数b(±标准差) 参数c(±标准差) R2 样本量 D < 5.05 hPa 0.083(±0.087) 0.195 (±0.105) 1.294 (±0.376) 0.786 80 D > 5.05 hPa 0.108 (±0.128) 5.246 (±6.102) -0.953 (±0.596) 0.679 150
下载: 导出CSV
表 3 大豆出苗前和收割后P-T模型参数α的统计模型
Table 3 Statistical models of parameter α of P-T model before soybean emergence and after soybean harvest
发育阶段 常数项及回归因子 回归系数 (±标准差) 标准回归系数 R2 出苗前 C0 0.965*(±0.137) 0.391 Ra 0.028*(±0.008) 0.450 D -0.100*(±0.016) -0.786 收割后 C0 0.278 (±0.494) 0.392 Ws 0.550*(±0.134) 0.626 注:*表示达到0.001显著性水平。
下载: 导出CSV
-
[1] Lee T S, Najim M M, Aminul M H.Estimating evapotranspiration of irrigated rice at the west coast of the Peninsular of Malaysia.Journal of Applied Irrigation Science, 2004, 39(1):103-117. http://www.academia.edu/2685015/Estimating_evapotranspiration_of_irrigated_rice_at_the_West_Coast_of_the_Peninsular_of_Malaysia [2] 张顺谦, 马振峰, 张玉芳.四川省潜在蒸散量估算模型.应用气象学报, 2009, 20(6):729-736. doi: 10.11898/1001-7313.20090611 [3] Zhang Y Q, Liu C M, Yu Q, et al.Energy fluxes and the Priestley-Taylor parameter over winter wheat and maize in the North China Plain.Hydrological Processes, 2004, 18(12):2235-2246. doi: 10.1002/(ISSN)1099-1085 [4] 龚员石, 李子忠, 李春友.利用时域反射仪测定的土壤水分估算农田蒸散量.应用气象学报, 1998, 9(1):72-78. http://qikan.camscma.cn/jams/ch/reader/view_abstract.aspx?file_no=19980110&flag=1 [5] Burba G G, Verma S B.Seasonal and interannual variability in evapotranspiration of native tallgrass prairie and cultivated wheat ecosystems.Agricultural and Forest Meteorology, 2005, 135(1-4):190-201. doi: 10.1016/j.agrformet.2005.11.017 [6] 毛飞, 张光智, 徐祥德.参考作物蒸散量的多种计算方法及其结果的比较.应用气象学报, 2000, 11(增刊Ⅰ):128-136. http://www.cnki.com.cn/Article/CJFDTOTAL-YYQX2000S1016.htm [7] Nurit A, William P K, Martha C.Application of the Priestley-Taylor approach in a two-source surface energy balance model.Journal of Hydrometeorology, 2010, 11(1):185-198. doi: 10.1175/2009JHM1124.1 [8] 刘绍民.用Priestley-Taylor模式计算棉田实际蒸散量的研究.应用气象学报, 1998, 9(1):88-93. http://qikan.camscma.cn/jams/ch/reader/view_abstract.aspx?file_no=19980112&flag=1 [9] 吕厚荃, 钱拴, 杨霏云, 等.华北地区玉米田实际蒸散量的计算.应用气象学报, 2003, 14(6):722-728. http://qikan.camscma.cn/jams/ch/reader/view_abstract.aspx?file_no=20030691&flag=1 [10] 米娜, 陈鹏狮, 张玉书, 等.几种蒸散模型在玉米农田蒸散量计算中的应用比较.资源科学, 2009, 31(9):1599-1606. http://www.cnki.com.cn/Article/CJFDTOTAL-ZRZY200909023.htm [11] Sumner D M, Jacobs J M.Utility of Penman-Monteith, Priestley-Taylor, reference evapotranspiration and pan evaporation methods to estimate pasture evapotranspiration.J Hydrol, 2005, 308(1-4):81-104. doi: 10.1016/j.jhydrol.2004.10.023 [12] Pereira A R.The Priestley-Taylor parameter and the decoupling factor for estimating reference evapotranspiration.Agricultural and Forest Meteorology, 2004, 125(3-4):305-313. doi: 10.1016/j.agrformet.2004.04.002 [13] Stannard D I.Comparison of Penman-Monteith, Shuttleworth-Wallace and modified Priestley-Taylor evapotranspiration models for wildland vegetation in semiarid rangeland.Water Resources Research, 1993, 29(5):1379-1392. doi: 10.1029/93WR00333 [14] Priestley C H B, Taylor R J.On the assessment of surface heat flux and evaporation using large-scale parameters.Mon Wea Rev, 1972, 100:81-92. doi: 10.1175/1520-0493(1972)100<0081:OTAOSH>2.3.CO;2 [15] Debrin H A R, Keijman J Q.The Priestley-Taylor evaporation model applied to a large shallow lake in the Netherlands.J Applied Meteor, 1979, 18(7):898-903. doi: 10.1175/1520-0450(1979)018<0898:TPTEMA>2.0.CO;2 [16] Mukammal E I, Neumann H H.Application of the Priestley-Taylor evaporation model to assess the influence of soil moisture on the evaporation from a large weighing lysimeter and class A Pan.Boundary-layer Meteorology, 1977, 12:243-256. doi: 10.1007/BF00121976 [17] Flint A L, Childs S W.Use of the Priestley-Taylor evaporation equation for soil water limited conditions in a small forest clear-cut.Agricultural and Forest Meteorology, 1991, 56(3-4):247-260. doi: 10.1016/0168-1923(91)90094-7 [18] 马耀明.非均匀陆面上区域蒸发 (散) 研究概况.高原气象, 1997, 16(4):446-452. http://www.cnki.com.cn/Article/CJFDTOTAL-GYQX704.013.htm [19] Xu C Y, Singh V P.Evaluation of three complementary relationship evapotranspiration models by water balance approach to estimate actual regional evapotranspiration in different climate regions.J Hydrol, 2005, 308(1/4):105-121. http://www.sciencedirect.com/science/article/pii/S0022169404005256 [20] Shi T T, Guan D X, Wang A Z, et al.Comparison of three models to estimate evapotranspiration for a temperate mixed forest.Hydrological Processes, 2008, 22:3431-3443. doi: 10.1002/hyp.v22:17 [21] Wilson K B, Goldstein A H, Falge E, et a1.Energy balance closure at FLUXNET sites.Agricultural and Forest Meteorology, 2002, 113(1-4):223-243. doi: 10.1016/S0168-1923(02)00109-0 [22] 李正泉, 于贵瑞, 温学发, 等.中国能量观测网络 (ChinaFLUX) 能量平衡闭合状况的评价.中国科学D辑:地球科学, 2004, 34(增刊Ⅱ):46-56. http://www.cnki.com.cn/Article/CJFDTOTAL-JDXK2004S2004.htm [23] 刘渡, 李俊, 于强, 等.涡度相关观测的能量闭合状况及其对农田蒸散测定的影响.生态学报, 2012, 32(17):5309-5317. http://www.cnki.com.cn/Article/CJFDTOTAL-STXB201217004.htm [24] 田红, 伍琼, 童应祥.安徽省寿县农田能量平衡评价.应用气象学报, 2011, 22(3):356-361. doi: 10.11898/1001-7313.20110312 [25] 赵晓松. 三江平原沼泽湿地垦殖对CO2、水汽及能量通量的影响研究. 北京: 中国科学院研究生院, 2008. [26] Lafleur P M, Roulet N T, Admiral S W.Annual cycle of CO2 exchange at a bog peatland.Journal of Geophysical Research:Atmospheres, 2001, 106(D3):3071-3081. doi: 10.1029/2000JD900588 [27] Falge E, Baldocchi D D, Olson R J.Gap filling strategies for defensible annual sums of net ecosystem exchange.Agricultural and Forest Meteorology, 2001, 107(1):43-69. doi: 10.1016/S0168-1923(00)00225-2 [28] Falge E, Baldocchi D D, Olson R J.Gap filling strategies for long term energy flux data sets.Agricultural and Forest Meteorology, 2001, 107(1):71-77. doi: 10.1016/S0168-1923(00)00235-5 [29] 曾丽红, 宋开山, 张柏, 等.应用Landsat数据和SEBAL模型反演区域蒸散发及其参数估算.遥感技术与应用, 2008, 23(3):255-263. doi: 10.11873/j.issn.1004-0323.2008.3.255 [30] Perez P J, Castellvi F, MartÍnez-Cob A.A simple model for estimating the Bowen ratio from climatic factors for determining latent and sensible heat flux.Agricultural and Forest Meteorology, 2008, 148:25-37. doi: 10.1016/j.agrformet.2007.08.015 [31] Kang S Z, Gu B J, Du T S, et al.Crop coefficient and ratio of transpiration to evapotranspiration of winter wheat and maize in a semi-humid region.Agricultural Water Management, 2003, 59:239-254. doi: 10.1016/S0378-3774(02)00150-6 [32] 潘竟虎.黄土丘陵沟壑区蒸散的遥感反演:以静宁县水土保持世行贷款项目区为例.生态与农村环境学报, 2008, 24(4):6-9;41. http://www.cnki.com.cn/Article/CJFDTOTAL-NCST200804002.htm [33] Bormann H.Sensitivity analysis of 18 different potential evapotranspiration models to observed climatic change at German climate stations.Climatic Change, 2011, 104(3-4):729-753. doi: 10.1007/s10584-010-9869-7 -

 点击查看大图
计量
- 摘要浏览量: 2175
- HTML全文浏览量: 1187
- PDF下载量: 1124
- 被引次数: 0
