
 设为首页
设为首页 加入收藏
加入收藏

An Assessment of the Tropical Pacific Latent Heat Flux Simulated by BCC_CSM 1.1(m)
-
摘要: 利用1979—2005年OAFlux (Objectively Analyzed air-sea Fluxes) 观测资料以及CMIP5的15个耦合模式的模拟结果,评估了BCC_CSM1.1(m) 模式对热带太平洋年平均潜热通量气候态和变化趋势的模拟能力,并分析造成趋势偏差的可能原因。结果表明:BCC_CSM1.1(m) 模式模拟热带太平洋年平均潜热通量气候态在各纬度上差异较大, 其中在赤道的模拟能力较佳,而在10°N和8°S附近模拟偏差较大;BCC_CSM1.1(m) 模式对热带太平洋年平均潜热通量趋势的模拟能力一般,造成趋势偏差的主要原因是该模式低估了风速对潜热通量的局地贡献以及它对风速的非局地贡献的模拟存在较大偏差。此外,该模式未能较好地模拟出风速对全球变暖响应。因此,BCC_CSM1.1(m) 模式对热带太平洋年平均潜热通量趋势模拟的改进需加强其对风速模拟的改进。
-
关键词:
- BCC_CSM1.1(m);
- 潜热通量;
- 热带太平洋
Abstract: The simulated tropical Pacific annual mean latent heat flux by BCC_CSM1.1(m) as well as 14 other CMIP5 models are analyzed and compared with observations from objectively analyzed air-sea fluxes (OAFlux). Some possible causes for annual latent heat flux trend biases in BCC_CSM1.1(m) are investigated.Biases of annual average latent heat flux between observations and BCC_CSM1.1(m) in the tropical ocean and west boundary current area is larger, while in mid-high latitudes is smaller. Annual average latent heat flux is larger than observations, and annual mean latent heat flux variance is smaller than observations. The tropical Pacific annual and zonal mean latent heat flux is quite different in different latitudes. Simulation results of BCC_CSM1.1(m) near 10°N and 8°S have relatively large biases, while the biases are rather small in equator. So BCC_CSM1.1(m) needs to focus on improving the simulation of Pacific latent heat flux near 10° in each hemisphere.Among 15 CMIP5 models, NorESM1_M gives the best simulation result, and the root mean square error is the smallest, while the root mean square error of GISS_E2_R result is the largest. The root mean square error of BCC_CSM1.1(m) result is 22.9 W·m-2, ranking eighth among all models, which indicates a moderate simulating ability.The trend of the tropical Pacific annual mean latent heat flux in BCC_CSM1.1(m) has biases comparing with the observation, and the cause can be concluded in 3 aspects. First, the local contribution horizontal wind speed to latent heat flux trend is underestimated in BCC_CSM1.1(m). Second, there are large biases for simulated non-local contribution of horizontal wind speed in BCC_CSM1.1(m). Finally, the response to the global warming of horizontal wind speed in BCC_CSM1.1(m) has large biases as well. Therefore, the main cause for trend biases of tropical Pacific annual mean latent heat flux is the large simulation deviation of horizontal wind speed in BCC_CSM1.1(m), and therefore the model needs improving in horizontal wind speed simulation.-
Key words:
- BCC_CSM1.1(m);
- latent heat flux;
- tropical Pacific
-
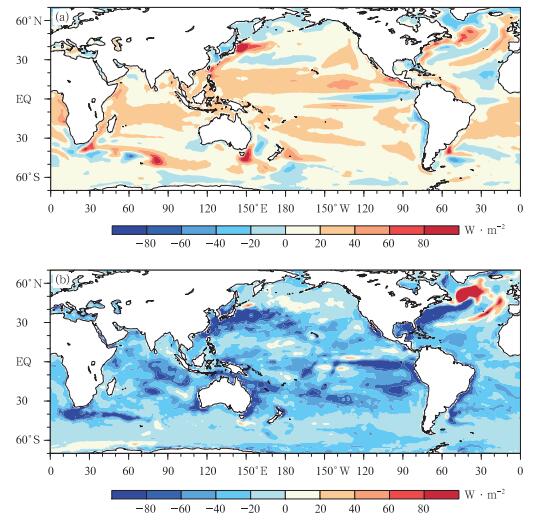
图 1 BCC_CSM1.1(m) 模式模拟的年平均潜热通量与观测偏差空间分布
(a) 潜热通量气候态的偏差,(b) 潜热通量方差的偏差
Fig. 1 Spatial patterns of annual latent heat flux biases in BCC_CSM1.1(m) relative to the observation
(a) bias of climate mean latent heat flux, (b) bias of latent heat flux variance
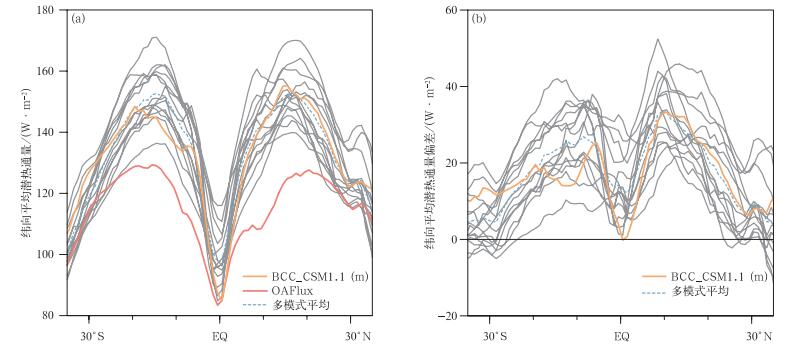
图 2 热带太平洋纬向平均的年平均潜热通量的模拟结果对比 (灰色曲线表示其他14个模式结果) (a) BCC_CSM1.1(m) 模式纬向平均潜热通量与多模式的比较,(b) CMIP5模式纬向平均潜热通量与观测偏差
Fig. 2 Zonal-mean annual latent heat flux over the tropical Pacific of 15 CMIP5 models (a), and differences between the simulated and the observation (b)
(grey lines indicate results in other 14 models except BCC_CSM1.1(m))
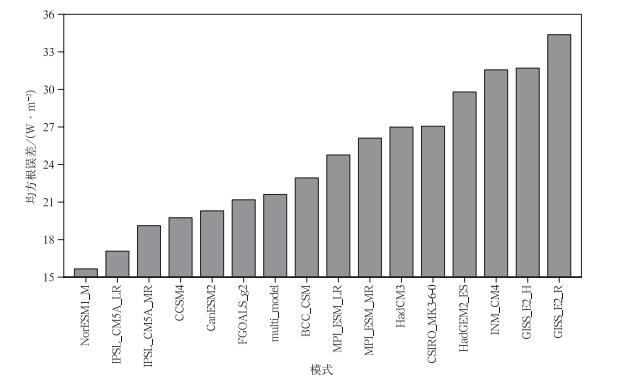
图 3 CMIP5模式的热带太平洋年平均潜热通量均方根误差
Fig. 3 The root mean square error of annual latent heat flux over the tropical Pacific in CMIP5 models
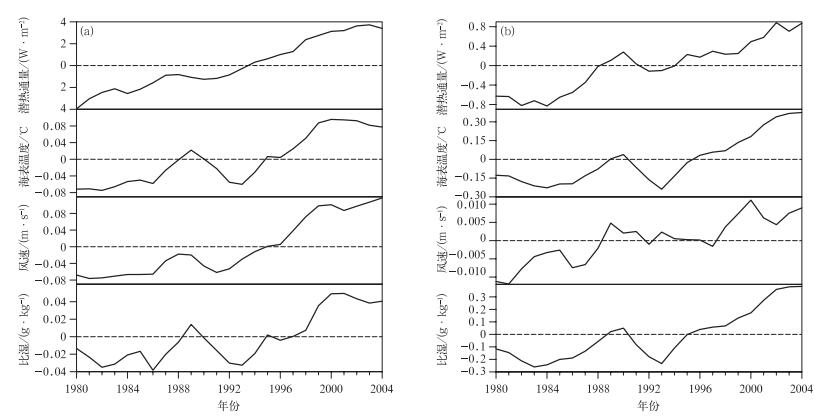
图 4 观测 (a) 和BCC_CSM1.1(m) 模式模拟 (b) 的热带太平洋年平均潜热通量、海表温度、风速和比湿的重置序列的3年滑动平均
Fig. 4 3-year moving averages of annual latent heat flux, SST, wind speed and air specific humidity reconstructed series over the tropical Pacific by the observation (a) and BCC_CSM1.1(m)(b)

图 5 1979—2005年观测 (a) 和BCC_CSM1.1(m) 模式模拟 (b) 的热带太平洋年平均潜热通量f′LHF,


Fig. 5 Slope distributions of annual mean f′LHF,
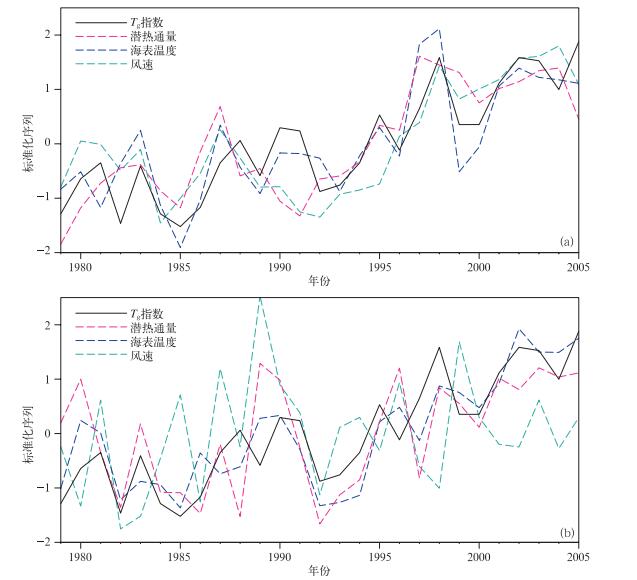
图 6 观测 (a) 和BCC_CSM1.1(m) 模式模拟 (b) 的热带太平洋年平均潜热通量、海表温度、风速和Tg指数变化
Fig. 6 Normalized time series of the annual latent heat flux, sea surface temperature and wind speed over the tropical Pacific and Tg index from the observation (a) and BCC_CSM1.1(m)(b)
表 1 15个CMIP5模式信息
Table 1 Information of 15 CMIP5 models
模式 国家 水平分辨率 BCC_CSM1.1(m) 中国 1.12°×1.12° CCSM4 美国 1.25°×1.25° CanESM2 加拿大 2.79°×2.79° CSIRO_MK3-6-0 澳大利亚 1.87°×1.87° FGOALS-g2 中国 3.00°×3.00° GISS_E2_H 美国 2.00°×2.50° GISS_E2_R 美国 2.00°×2.50° HadCM3 英国 2.50°×3.71° HadGEM2_ES 英国 1.25°×1.87° INM_CM4 俄国 1.50°×2.00° IPSL_CM5A_LR 法国 1.89°×3.71° IPSL_CM5A_MR 法国 1.27°×2.48° MPI_ESM_LR 德国 1.86°×1.87° MPI_ESM_MR 德国 1.86°×1.87° NorESM1_M 挪威 1.89°×2.48°  下载: 导出CSV
表 2 1979—2005年BCC_CSM1.1(m) 模式模拟和观测热带太平洋年平均潜热通量及各因子相关系数
Table 2 Correlation coefficients of 1979-2005 annual mean latent heat flux to its impact factors over the tropical Pacific in BCC_CSM1.1(m) and observations
因子 原始数据 重置序列 潜热通量 0.38 0.78* 近海表风速 0.03 0.60* 海表温度 0.65* 0.87* 比湿 0.52* 0.80* 注:*表示达到0.05的显著性水平。
下载: 导出CSV
表 3 1979—2005年观测和BCC_CSM1.1(m) 模式模拟热带太平洋年平均潜热通量及各因子趋势的斜率
Table 3 Trend slopes of annual latent heat flux and its impact factors over the tropical and subtropical Pacific by the observation and BCC_CSM1.1(m) from 1979 to 2005
因子 观测数据 观测重置序列 BCC_CSM数据 BCC_CSM重置序列 潜热通量/(W·m-2/(10 a)) 2.95±0.83* 3.02±0.19* 0.52±0.20* 0.66±0.08* 近海表风速/(m·s-1/(10 a)) 0.08±0.06 0.08±0.02* 0.01±0.01 0.01±0.002* 海表温度/(℃/(10 a)) 0.11±0.02* 0.07±0.02* 0.20±0.07* 0.23±0.07* 比湿/(g·kg-1/(10 a)) 0.06±0.03* 0.03±0.01* 0.22±0.07* 0.23±0.06* 注:*表示趋势达到0.05显著性水平。
下载: 导出CSV
-
[1] 刘娜, 王彰贵, 凌铁军, 等.热带太平洋潜热通量变化及其与我国夏季降水的关系.海洋预报, 2012, 29(6):50-57. doi: 10.11737/j.issn.1003-0239.2012.06.007 [2] 沈晗, 李江南, 温之平, 等.热带西太平洋潜热通量异常影响华南6月降水的模拟研究.热带气象学报, 2012, 28(5):757-763. http://www.cnki.com.cn/Article/CJFDTOTAL-RDQX201205017.htm [3] 闫俊岳, 唐志毅, 姚华栋, 等.2002年南海季风爆发前后西沙海区海-气通量交换及其变化.地球物理学报, 2000, 48(5):1000-1010. http://cpfd.cnki.com.cn/Article/CPFDTOTAL-EGVE200509001009.htm [4] 王宏娜, 陈锦年, 左涛.印度洋潜热通量对南海夏季风爆发的影响.热带气象学报, 2014, 30(1):189-193. http://www.cnki.com.cn/Article/CJFDTOTAL-RDQX201401022.htm [5] 姚华栋, 任雪娟, 马开玉.1998年南海季风试验期间海-气通量的估算.应用气象学报, 2003, 14(1):87-92. http://qikan.camscma.cn/jams/ch/reader/view_abstract.aspx?file_no=20030110&flag=1 [6] Cayan D R.Variability of latent and sensible heat fluxes esti-mated using bulk formulae.Atmos Ocean, 1992, 30:1-42. doi: 10.1080/07055900.1992.9649429 [7] Araligidad N M, Maloney E D.Wind-driven latent heatflux and the intraseasonaloscillation.Geophys Res Lett, 2008, 35, L04815, doi:1029/2007GL032746. [8] 郑建秋, 任保华, 李根.北太平洋海气界面湍流热通量的年际变化.大气科学, 2009, 33(5):1111-1121. http://www.cnki.com.cn/Article/CJFDTOTAL-DQXK200905022.htm [9] Li G, Ren B, Yang C, et al.Revisiting the trend of the tropical and subtropical Pacific surface latent heat flux during 1977-2006.J Geophys Res, 2011, 116, D10115, doi: 10.1029/2010JD015444. [10] Yu L, Weller R A.Objectively analyzed air-sea heat fluxes for the global ice-free oceans (1981-2005).Bull Amer Meteor Soc, 2007, 88:27-539. http://www.citeulike.org/user/rpallan/article/2290611 [11] Liu J, Curry J A.Variability of the tropical and subtropical ocean surface latent heat flux during 1989-2000.Geophys Res Lett, 2006, 33L05706, doi: 10.1029/2005GL024809. [12] Tomita H, Kubota M.Increase in turbulent heat flux during the 1990s over the Kuroshio/Oyashio extension region.Geophys Res Lett, 2005, 32, L09705, doi: 10.1029/2004GL022075. [13] 石彦军, 任余龙, 王式功, 等.BCC_CSM气候模式对中国区域气候变化模拟能力的检验.高原气象, 2012, 31(5):1257-1267. http://www.cnki.com.cn/Article/CJFDTOTAL-GYQX201205009.htm [14] 周鑫, 李清泉, 孙秀博, 等.BCC_CSM1.1模式对我国气温的模拟和预估.应用气象学报, 2014, 25(1):95-106. doi: 10.11898/1001-7313.20140110 [15] 张莉, 吴统文, 辛晓歌, 等.BCC_CSM模式对热带降水年循环模态的模拟.大气科学, 2013, 37(5):994-1012. doi: 10.3878/j.issn.1006-9895.2012.12126 [16] 董敏, 吴统文, 王在志, 等.BCC_CSM1.0模式对20世纪降水及其变率的模拟.应用气象学报, 2013, 24(1):1-11. doi: 10.11898/1001-7313.20130101 [17] 朱芳泽, 王召民, 刘成彦, 等.BCC_CSM对全球海表温度和混合层深度的模拟评估.大气科学学报, 2014, 37(6):684-694. http://www.cnki.com.cn/Article/CJFDTOTAL-NJQX201406002.htm [18] 高峰, 辛晓歌, 吴统文.BCC_CSM1.1对10年尺度全球及区域温度的预测研究.大气科学, 2012, 36(6):1165-1179. doi: 10.3878/j.issn.1006-9895.2012.11243 [19] Yu L, Jin Xiangze, Weller R A.Role of net surface heat flux in seasonal variations of sea surface temperature in the Tropical Atlantic Ocean.J Clim, 2007, 19:6153-6169. doi: 10.1175/JCLI3970.1 [20] Yu L, Weller R A, Sun B.Improving latent and sensible heat flux estimates for the Atlantic Ocean (1988-1999) by a synthesis approach.J Clim, 2004, 17:373-393. doi: 10.1175/1520-0442(2004)017<0373:ILASHF>2.0.CO;2 [21] Hansen J, Ruedy R, Sato M, et al.Global surface airtemperature in 1995:Return to pre-Pinatubo level.Geophys Res Lett, 1996, 23:1665-1668. doi: 10.1029/96GL01040 [22] Hansen J, Nazarenko L, Ruedy R, et al.Earth's energy imbalance:Confirmation andimplications.Science, 2005, 308:1431-1435. doi: 10.1126/science.1110252 [23] Hannachi A.Pattern hunting in climate:A new method for findingtrends in gridded climate data.Int J Climatol, 2007, 27:1-15. doi: 10.1002/(ISSN)1097-0088 [24] Barbosa S M, Andersen O B.Trend patterns in global sea surface temperature.J Clim, 2009, 29:2049-2055. doi: 10.1002/joc.v29:14 [25] Losada I J, Reguero B G, Mendez F J, et al.Long-term changes in sea-level components in Latin America and the Caribbean.Global and Planetray Change, 2013, 104:34-50. doi: 10.1016/j.gloplacha.2013.02.006 [26] Liu W T, Katsaros K B, Businger J A.Bulk parameterization of air-sea exchanges of heat and water vapor includring the molecular constraints at the interface.J Atmos Sci, 1979, 36:1722-1735. doi: 10.1175/1520-0469(1979)036<1722:BPOASE>2.0.CO;2 [27] Alexander M A, Scott J D.Surface flux variability over the North Pacific and North Atlantic Oceans.J Clim, 1997, 10:2963-2978. doi: 10.1175/1520-0442(1997)010<2963:SFVOTN>2.0.CO;2 [28] 吴统文, 宋连春, 李伟平, 等.北京气候中心气候系统模式研发进展——在气候变化研究中的应用.气象学报, 2014, 72(1):12-29. doi: 10.11676/qxxb2013.084 [29] 吴统文, 宋连春, 刘向文, 等.国家气候中心短期气候预测模式系统业务化进展.应用气象学报, 2013, 24(5):533-543. doi: 10.11898/1001-7313.20130503 [30] Santer B D, Wigley T M L, Boyle J S, et al.Statistical significance of trends and trend differences in layer-average atmospheric temperature timeseries.J Geophys Res, 2000, 105:7337-7356. doi: 10.1029/1999JD901105 [31] Tanimoto Y, Nakamura H, Kagimoto T, et al.An active role of extratropical sea surface temperature anomalies in determining anomalous turbulent heat flux.J Geophys Res, 2003, 108(C10):3304. doi: 10.1029/2002JC001750 [32] Yu L.Global variations in oceanic evaporation (1958-2005):The role of the changing wind speed.J Clim, 2007, 20:5376-5390. doi: 10.1175/2007JCLI1714.1 [33] Fang C F, Wu L X.The role of ocean dynamics in tropical Pacific SST response to warm climate in a fully coupled GCM.Geophys Res Lett, 2008, 5, L08703, doi: 10.1029/2007GL-033097. -

 点击查看大图
计量
- 摘要浏览量: 2502
- HTML全文浏览量: 1171
- PDF下载量: 351
- 被引次数: 0
