
 设为首页
设为首页 加入收藏
加入收藏

Research and Application of Operational MJO Monitoring and Prediction Products in Beijing Climate Center
-
摘要: 热带大气低频振荡 (MJO) 和北半球夏季季节内振荡 (BSISO) 对全球范围天气气候事件有重要影响,是次季节-季节 (S2S) 预报最主要的可预报性来源之一。国家气候中心 (BCC) 基于我国完全自主的T639全球分析场数据、风云三号气象卫星射出长波辐射 (OLR) 资料以及BCC第2代大气环流模式系统的实时预报,发展了MJO实时监测预测一体化业务技术,建立了ISV/MJO监测预测业务系统 (IMPRESS1.0),已投入实时业务运行,在全国气象业务系统得到应用。该文着重介绍该系统提供的MJO和BSISO指数监测预测数据和图形产品,并描述了这些业务产品在2015年对MJO典型个例的实时监测预测应用情况。监测分析和预报检验表明,基于我国自主资料的监测结果能够较为准确地表征MJO和BSISO指数的振荡和演变过程,该系统对MJO和BSISO事件分别至少具备16 d和10 d左右的预报技巧。因此,基于IMPRESS1.0的MJO/BSISO监测预测一体化业务产品可为制作延伸期预报提供重要的参考依据。Abstract: Both Madden-Julian oscillation (MJO) and the boreal summer intra-seasonal oscillation (BSISO) have great impacts on the global weather and climate events, which are the most important predictability source of sub-seasonal to seasonal (S2S) prediction. However, the monitoring of MJO/BSISO in China National Climate Center/Beijing Climate Center (NCC/BCC) entirely depends on external data, and the prediction skill of the introduced statistical forecast model is also much lower than dynamic mode, and the practical real-time operation ability has not been established. Therefore, based on CMA (China Meteorological Administration) global analysis data of T639 model, OLR (outgoing long-wave radiation) data of FY-3B satellite and the real-time forecast data of BCC atmospheric general circulation model system (BCC_AGCM2.2), applying the real-time multivariate MJO (RMM) index and BSISO index, BCC develops the MJO real-time monitoring and forecast technology, and establishes the trial ISV (intra-seasonal variability)/MJO prediction system (IMPRESS1.0).In comparison, monitoring results based on T639 wind analysis and FY-3B OLR data is generally consistent with the operational products from other centers, suggesting the capability of characterizing the oscillation and evolution of MJO/BSISO index accurately. Case study for the typical strong MJO event in March 2015 indicates that the amplitude peak of RMM index based on T639 and FY-3B OLR data is weaker than monitoring results based on NCEP and NOAA OLR data. Further analysis for three variables U850 (zonal wind at 850 hPa), U200 (zonal wind at 200 hPa) and OLR show that the convection monitored by FY-3B satellite is more consistent with NOAA's result, while the projection amplitude of the U850 based on T639 analysis against MJO mode is slightly weaker than NCEP/NCAR reanalysis data, which leads to weaker RMM index amplitude. The forecast skill verification shows the IMPRESS1.0 is able to provide correct evolution and intensity information of MJO at least 16 days in advance, and the skill of operational forecast in 2015 reach 18 days. The rolling prediction skill could be improved continually as the evolution of MJO event, and the predicted RMM index phase space track is closer to reality. Meanwhile, the verification of hindcasts by using correlation skill (COR), root mean square error (RMSE) and mean square skill score (MSSS) shows that the IMPRESS1.0 has useful prediction skill for about 12 days for MJO index and 8 days for BSISO1 and BSISO2 index, respectively. The case study for BSISO event in July 2015 also shows prediction skill, the reconstructed anomaly circulation and convection against BSISO index clearly demonstrate the dominant mode and northward propagation of BSISO. Therefore, the unified monitoring and forecast productions based on IMPRESS1.0 can provide important references for extended-range prediction, and offer certain help for operation and research.
-
Key words:
- MJO;
- BSISO;
- monitoring and forecast;
- operation system
-
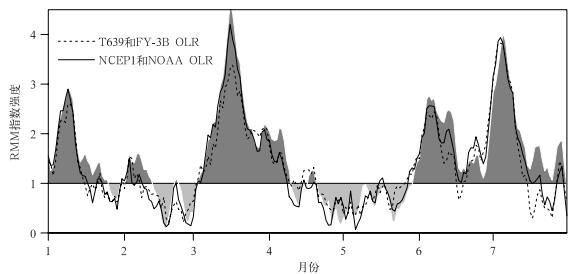
图 1 2015年1—7月RMM指数强度时间序列图
(阴影为澳大利亚气象局监测值)
Fig. 1 Time series of the amplitude of RMM index from Jan to Jul in 2015
(the shaded is based on Australian Bureau of Meteorology monitoring)
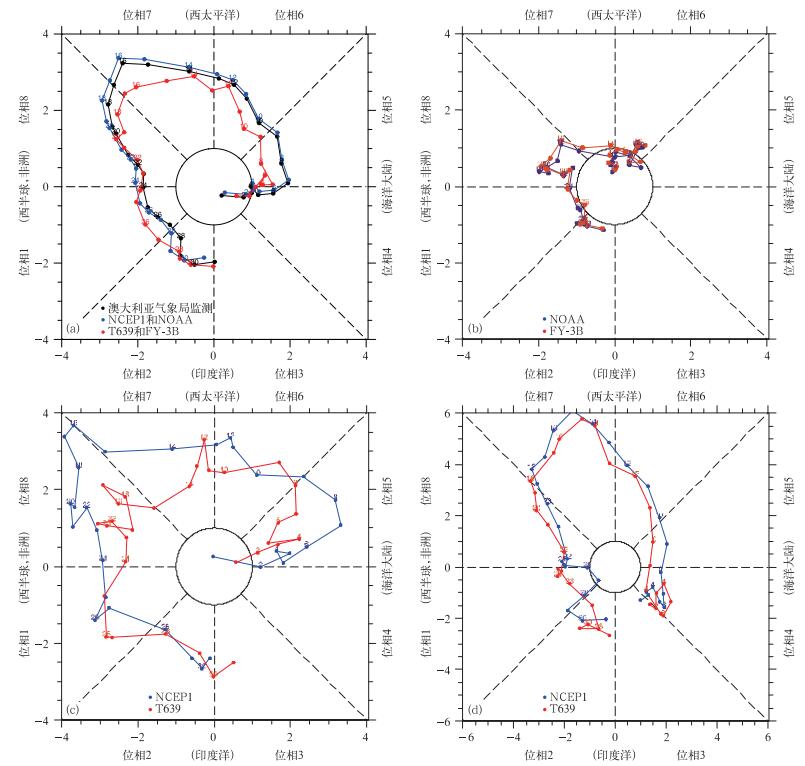
图 2 基于不同资料监测的2015年3月RMM指数空间位相图
(a) 使用所有变量,(b) 仅使用OLR资料,(c) 仅使用850 hPa纬向风场,(d) 仅使用200 hPa纬向风场
Fig. 2 The RMM index phase space diagram plots for Mar 2015,where the RMM indices calculated by all three variables (a), OLR only (b), U850 only (c) and U200 only (d)
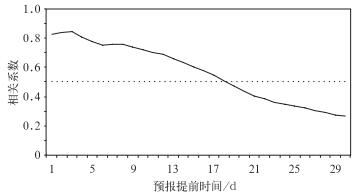
图 3 BCC_AGCM2.2在2015年对RMM指数实时业务预报的相关技巧检验
Fig. 3 The prediction correlation skill verification of RMM indices based on the real-time operational forecast of BCC_AGCM2.2 in 2015

图 4 2015年3次主要MJO事件的实时监测和预报的RMM指数演变的空间位相图 (红色实线为基于T639和FY-3B OLR的监测结果,彩色虚线为BCC_AGCM2.2不同起报时间的20 d RMM指数预报结果,起报时间以不同颜色区分)
(a) 2015年3月1日—4月15日,(b) 2015年6月1日—7月15日,(c) 2015年12月1日—2016年1月13日
Fig. 4 The phase space diagram of RMM indices evolution for the monitoring and the forecast of three major MJO events in 2015 (the red solid line is based on T639 analysis and FY-3B OLR monitoring, the dash lines of different colors are forecasts based on BCC_AGCM2.2 for 5 start days and show the first 20 days of each forecast)
(a) from 1 Mar to 15 Apr in 2015,(b) from 1 Jun to 15 Jul in 2015,(c) form 1 Dec 2015 to 13 Jan 2016

图 5 2015年5—10月两个BSISO指数强度时间序列图
(阴影为APCC监测值)
Fig. 5 Time series of the amplitude of BSISO indices from May to Oct in 2015
(the shaded is based on APCC monitoring)
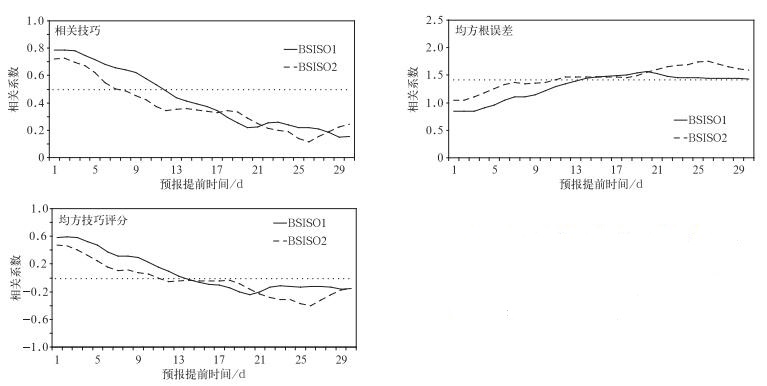
图 6 BCC_AGCM2.2对BSISO指数1991—2010年历史回报技巧检验
Fig. 6 The prediction skill of BSISO indices based on BCC_AGCM2.2 for 1991-2010
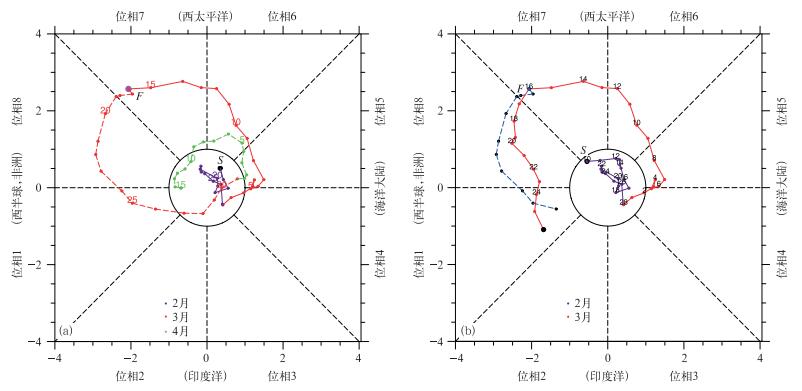
图 7 RMM指数空间位相图 (a) RMM指数最近30 d演变和未来30 d预报 (以2015年3月16日为例,紫色圆点为起报点,监测部分为实线,预测部分为虚线),(b) RMM指数最近45 d演变和10 d前预报结果检验
(以2015年3月26日为例,监测均基于T639和FY-3B OLR资料,预测基于BCC_AGCM2.2资料)
Fig. 7 The RMM index phase space diagram (a) for the latest 30-day monitoring and 30 d forecast (taking 16 Mar 2015 as example, the purple point represent forecast time, the solid line is monitoring and the dash line is forecast), (b) for the latest 45-day monitoring (the solid line) and 10-day forecast verification (the dash line)
(taking 26 Mar 2015 as example, the monitoring is based on T639 analysis and FY-3B OLR data and the forecast is based on BCC_AGCM2.2 data)
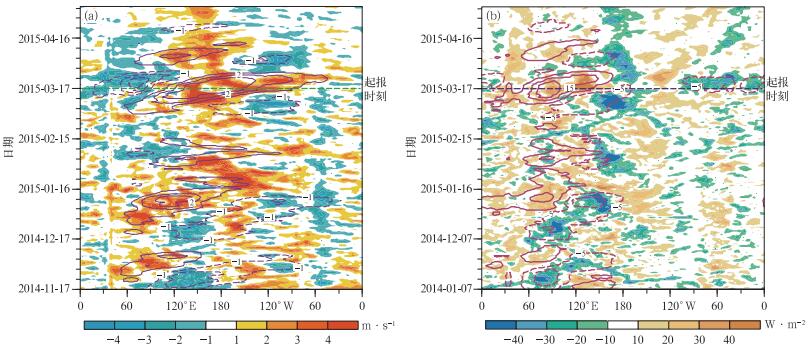
图 8 赤道地区经向平均 (15°S~15°N) 的最近120 d监测和未来50 d预报的异常850 hPa纬向风场 (a) 和OLR (b) 的纬向-时间剖面图
(以2015年3月16日为例, 阴影和等值线分别代表原始的异常场和RMM指数重构场)
Fig. 8 The time-longitude plot of anomaly U850 (a) and OLR (b) for the latest 120-day monitoring and 50-day forecast (taking 16 Mar 2015 as example), averaged from 15°S to 15°N
(the shaded and contour represent original anomaly and the reconstruction from RMM indices)

图 9 2015年BSISO指数监测和未来50 d预测时间序列图
(以2015年7月16日为例, 实线为监测, 虚线为预测,其中监测基于T639和FY-3B OLR资料,预测基于BCC_AGCM2.2资料,紫色竖线为起报时间)
Fig. 9 Time series of the BSISO indices for monitoring and 50-day forecast
(taking 16 Jul 2015 as example) (the solid line represent monitoring and the dash line represent forecast, the monitoring is based on T639 analysis and FY-3B OLR data and the forecast is based on BCC_AGCM2.2 data, the purple vertical line shows forecast start time, the horizontal coordinate is calendar month and the vertical coordinate is the value of BSISO indices)

图 10 RMM指数最近30 d演变和未来30 d预报的空间位相图
(紫色圆点为起报点,监测部分为实线,预测部分为虚线, 监测基于T639和FY-3B OLR资料,预测基于BCC_AGCM2.2资料,指数经过3 d滑动平均) (a) BSISO1指数,(b) BSISO2指数
Fig. 10 The phase space diagram of latest 30-day monitoring and 30-day forecasts
(taking 16 Jul 2015 as example) for 3-day running mean BSISO1 (a) and BSISO2 (b) index (the purple point represents forecast time, the solid line represents monitoring which is based on T639 analysis and FY-3B OLR data and the dash line represents forecast which is based on BCC_AGCM2.2 data)
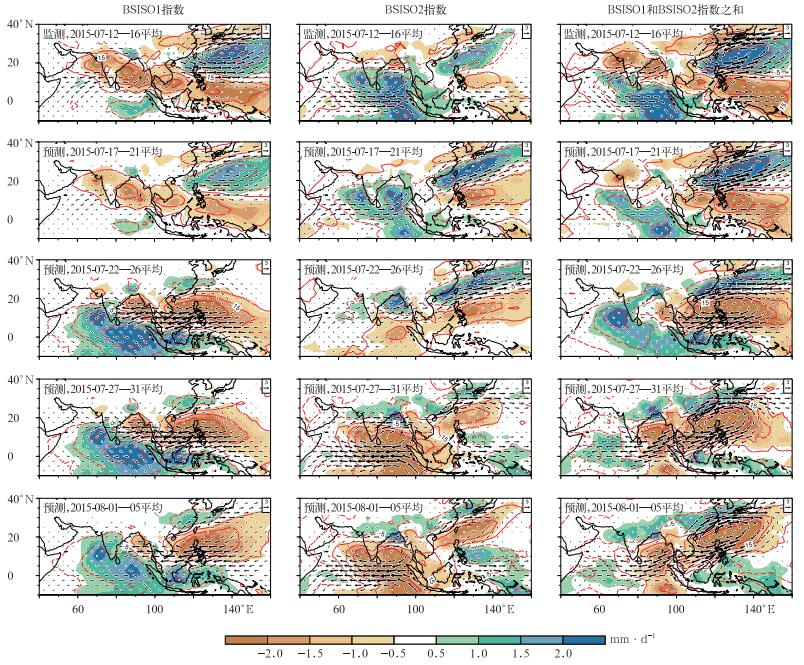
图 11 基于BSISO指数重建的最近1候和预报的未来4候的异常850 hPa风场
(矢量,单位:m·s-1)、OLR (等值线, 单位:W·m-2) 和降水场 (填色)
Fig. 11 The reconstruction patterns of anomalous wind at 850 hPa
(the vector, unit:m·s-1), OLR (the contour, unit:W·m-2) and precipitation (the shaded) for the first pentad of monitoring and the following four pentads of forecasts
-
[1] 国家气候中心.2008年初我国南方低温雨雪冰冻灾害及气候分析.北京:气象出版社, 2008. [2] Madden R A, Julian P R.Detection of a 40-50 day oscillation in the zonal wind in the tropical Pacific.J Atmos Sci, 1971, 28 (5):702-708. doi: 10.1175/1520-0469(1971)028<0702:DOADOI>2.0.CO;2 [3] Madden R A, Julian P R.Description of global-scale circulation cells in the tropics with a 40-50 day period.J Atmos Sci, 1972, 29 (6):1109-1123. doi: 10.1175/1520-0469(1972)029<1109:DOGSCC>2.0.CO;2 [4] Jeong J H, Kim B M, Ho C H, et al.Systematic variation in wintertime precipitation in East Asia by MJO-induced extratropical vertical motion.J Clim, 2008, 21:788-801. doi: 10.1175/2007JCLI1801.1 [5] Kessler W S, Kleeman R.Rectification of the Madden-Julian oscillation into the ENSO cycle.J Clim, 2000, 13:3560-3575. doi: 10.1175/1520-0442(2000)013<3560:ROTMJO>2.0.CO;2 [6] Fu X, Hsu P C.Extended-range ensemble forecasting of tropical cyclogenesis in the northern Indian Ocean:Modulation of Madden-Julian oscillation.Geophys Res Lett, 2011, 38:L15803.doi: 10.1029/2011GL048249. [7] Cassou C.Intraseasonal interaction between the Madden-Julian Oscillation and the North Atlantic Oscillation.Nature, 2008, 455 (25):523-527. https://www.nature.com/nature/journal/v455/n7212/full/nature07286.html [8] 丁一汇, 梁萍.基于MJO的延伸预报.气象, 2010, 36 (7):111-122. doi: 10.7519/j.issn.1000-0526.2010.07.018 [9] Waliser D E.Predictability and Forecasting//Intraseasonal Variability of the Atmosphere-Ocean Climate System (2nd edn).Springer:Heidelberg, Germany, 2011. [10] Zhang C D.Madden-Julian Oscillation-bridging weather and climate.Bull Amer Meteor Soc, 2013, 94:1849-1870. doi: 10.1175/BAMS-D-12-00026.1 [11] 王遵娅, 丁一汇.夏季长江中下游旱涝年季节内振荡气候特征.应用气象学报, 2008, 19 (6):710-715. doi: 10.11898/1001-7313.20080610 [12] 吴俊杰, 袁卓建, 钱钰坤, 等.热带季节内振荡对2008年初南方持续性冰冻雨雪天气的影响.热带气象学报, 2009, 25 (增刊Ⅰ):103-112. http://www.cnki.com.cn/Article/CJFDTOTAL-RDQX2009S1012.htm [13] Jia X L, Chen L J, Ren F M, et al.Impacts of the MJO on winter rainfall and circulation in China.Adv Atmos Sci, 2011, 28 (3):521-533. doi: 10.1007/s00376-010-9118-z [14] 贾小龙, 梁潇云.热带MJO对2009年11月我国东部大范围雨雪天气的可能影响.热带气象学报, 2011, 27 (5):639-648. http://www.cnki.com.cn/Article/CJFDTOTAL-RDQX201105005.htm [15] 林爱兰, 李春晖, 郑彬, 等.6月MJO对广东降水调制与直接影响系统的联系.应用气象学报, 2013, 24 (4):397-405. doi: 10.11898/1001-7313.20130402 [16] Wang B, Xie X S.A model for the boreal summer intraseasonal ossciation.J Atmos Sci, 1997, 54:72-86. doi: 10.1175/1520-0469(1997)054<0072:AMFTBS>2.0.CO;2 [17] Moon J Y, Wang B, Ha K J, et al.Teleconnections associated with Northern Hemisphere summer intraseasonal oscillation.Clim Dyn, 2013, 40 (11):2761-2774. doi: 10.1007%2Fs00382-012-1394-0 [18] Wang B, Lee J Y, Shukla J, et al.Advance and prospectus of seasonal prediction:Assessment of APCC/CliPAS 14-model ensemble retrospective seasonal prediction (1980-2004).Clim Dyn, 2009, 33:93-117. doi: 10.1007/s00382-008-0460-0 [19] 齐艳军, 张人禾.与中国东部天气气候相关的大气季节内振荡研究及业务应用.热带气象学报, 2015, 31 (4):566-576. http://www.cnki.com.cn/Article/CJFDTOTAL-RDQX201504014.htm [20] Wheeler M C, Hendon H H.An all-season real-time multivariate MJO index:Development of an index for monitoring and prediction.Mon Wea Rev, 2004, 132:1917-1932. doi: 10.1175/1520-0493(2004)132<1917:AARMMI>2.0.CO;2 [21] Seo K H, Wang W, Gottschalck J, et al.Evaluation of MJO forecast skill from several statistical and dynamical forecast models.J Clim, 2009, 22:2372-2388. doi: 10.1175/2008JCLI2421.1 [22] Zhu Z W, Li T, Hsu P C, et al.A spatial-temporal projection for extended-range forecast in the tropics.Clim Dyn, 2015, 45 (3):1085-1098. [23] Vitart F.Evolution of ECMWF sub-seasonal forecast skill scores.Q J R Meteorol Soc, 2014, 140:1889-1899. doi: 10.1002/qj.2014.140.issue-683 [24] Hudson D, Marshall A G, Yin Y H, et al.Improving Intraseasonal prediction with a new ensemble generation strategy.Mon Wea Rev, 2013, 141:4429-4449. doi: 10.1175/MWR-D-13-00059.1 [25] Wang W, Hung M P, Weaver S J, et al.MJO prediction in the NCEP Climate Forecast System version 2.Clim Dyn, 2014, 42:2509-2520. doi: 10.1007/s00382-013-1806-9 [26] Lee J Y, Wang B, Wheeler M C, et al.Real-time multivariate indices for the boreal summer intraseasonal oscillation over the Asian summer monsoon region.Clim Dyn, 2013, 40 (1):493-509. doi: 10.1007/s00382-012-1544-4?view=classic [27] 宋连春, 肖风劲, 李威.我国现代化气候业务现状及未来发展趋势.应用气象学报, 2013, 24 (5):513-520. doi: 10.11898/1001-7313.20130501 [28] 贾小龙, 陈丽娟, 高辉, 等.我国短期气候预测技术进展.应用气象学报, 2013, 24 (6):641-655. doi: 10.11898/1001-7313.20130601 [29] 封国林, 赵俊虎, 支蓉, 等.动力统计客观定量化汛期降水预测研究新进展.应用气象学报, 2013, 24 (6):656-665. doi: 10.11898/1001-7313.20130602 [30] 李清泉, 孙丞虎, 袁媛, 等.近20年我国气候监测预测业务技术的主要进展.应用气象学报, 2013, 24 (6):666-676. doi: 10.11898/1001-7313.20130603 [31] 刘长征, 杜良敏, 柯宗建, 等.国家气候中心多模式解释应用集成预测.应用气象学报, 2013, 24 (6):677-685. doi: 10.11898/1001-7313.20130604 [32] 贾小龙, 袁媛, 任福民, 等.热带大气季节内振荡 (MJO) 实时监测预测业务.气象, 2012, 38 (4):425-431. doi: 10.7519/j.issn.1000-0526.2012.04.006 [33] 任宏利, 吴捷, 赵崇博, 等.MJO预报研究进展.应用气象学报, 2015, 26 (6):658-668. doi: 10.11898/1001-7313.20150602 [34] Fu X H, Lee J Y, Hsu P C, et al.Multi-model MJO forecasting during DYNAMO/CINDY period.Clim Dyn, 2013, 41:1067-1081. doi: 10.1007/s00382-013-1859-9 [35] Lin H, Brunet G.The influence of the Madden-Julian oscillation on Canadian wintertime surface air temperature.Mon Wea Rev, 2008, 137:2250-2262. doi: 10.1175/2009MWR2831.1 [36] Gill A E.Some simple solutions for heat-induced tropical circulation.Quart J Roy Meteor Soc, 1980, 106:447-462. doi: 10.1002/(ISSN)1477-870X [37] Straub K H.MJO initiation in the real-time multivariate MJO index.J Clim, 2013, 26:1130-1151. doi: 10.1175/JCLI-D-12-00074.1 [38] Ren H L, Wu J, Zhao C B, et al.MJO ensemble prediction in BCC-CSM1.1 (m) using different initialization schemes.Atmospheric and Oceanic Science Letters, 2016, 9 (1):60-65. doi: 10.1080/16742834.2015.1116217 -

 下载:
下载:
 点击查看大图
计量
- 摘要浏览量: 3565
- HTML全文浏览量: 1091
- PDF下载量: 572
- 被引次数: 0
