
 设为首页
设为首页 加入收藏
加入收藏

An Hourly Standard Ice Thickness Model Using Conventional Meteorological Data with Its Validation
-
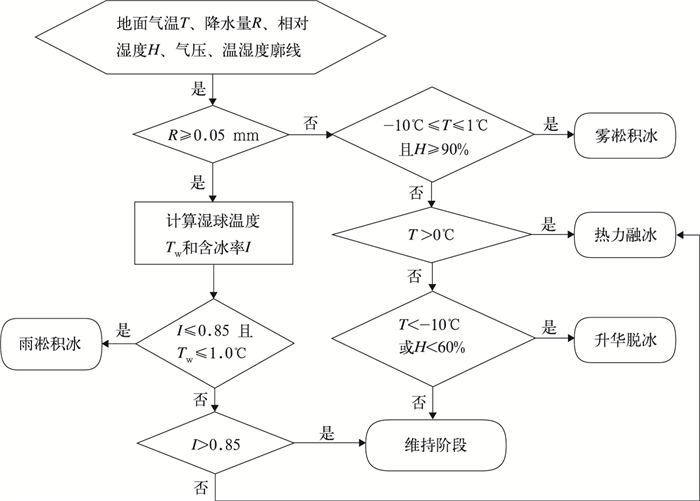
摘要: 在综合考虑雨凇和雾凇积冰增长以及热力融冰和升华脱冰的基础上,建立了一个基于常规气象资料的小时标准冰厚模型。模拟2008年和2013年浙江省两次严重电网覆冰灾害期间的标准冰厚,并用事故线路调查资料、电线积冰观测站和模拟导线拉力监测点的观测资料进行验证分析。结果显示:事故线路的最大标准冰厚观测值与模拟值相关关系达到0.01显著性水平,电线积冰观测站的日标准冰厚观测值与模拟值的平均绝对偏差小于0.6 mm,模拟导线拉力监测点的小时标准冰厚模拟值与观测值的决定系数为0.8093,均方根误差为0.8 mm。说明模型比较准确地描述了天气过程对电线积冰的影响,能够较好地反映标准冰厚的空间分布规律和时间变化特征。Abstract: The effective monitoring and early warning of ice on transmission lines are required to guarantee the reliable operation of power grid. However, due to the sparse coverage of wire icing observation stations, the regional ice loads can hardly be characterized by in-situ measurements. To solve this problem, an hourly standard ice thickness model using conventional meteorological data has been developed. In this model, the evolution of icing event is divided into different phases, namely accretion phase, persistence phase and shedding phase. During accretion phase, the ice weight increases by glaze and rime-ice accreting on power lines. During persistence phase, there is no change of ice weight. And in the phase of shedding, the ice weight decreases due to melting or sublimation. Each icing event includes at least an accretion phase and a shedding phase, and may also include other accretion, persistence and shedding phases.The simulation consists of three steps. The phase of icing event and the type of ice accretion (or shedding) is determined by hourly meteorological data. According to identified results, the variation of ice weight in the current hour is estimated using different methods:The variation is zero in the phase of persistence; the glaze and rime ice accretion is respectively simulated by adjusting Jones' simple model and Mackinnon model; the melting and sublimation ice is estimated using experimental equations presented by Farzaneh et al. The varied weight of current hour is summed with the ice weight of the previous hour to get the ice thickness of current hour.Using hourly meteorological data from more than 2000 stations located in Zhejiang and neighboring provinces, along with NCEP FNL analysis data, the model is employed to estimate the hourly standard ice thickness with 0.01°×0.01° spatial resolution in Zhejiang Province during periods from 11 Jan to 20 Feb in 2008, and from 11 Jan to 10 Jan in 2013. Furthermore, it is evaluated and validated by the power system fault data, survey data of damaged transmission lines, wire icing observation, and the in-situ wire tension measurements. Results indicate that the model can well capture the influence of weather on icing events, and also well characterize the spatial distribution and the temporal variation of wire icing events. At the wire tension monitoring sites, the simulated hourly standard ice thickness is generally in agreement with measured values, with determination coefficient of 0.5209-0.9287(with a mean value of 0.8093), and root mean square error of 0.1-2.4 mm (with a mean value of 0.8 mm).
-
Key words:
- wire icing;
- standard ice thickness;
- glaze;
- rime;
- ice accretion;
- ice shedding
-
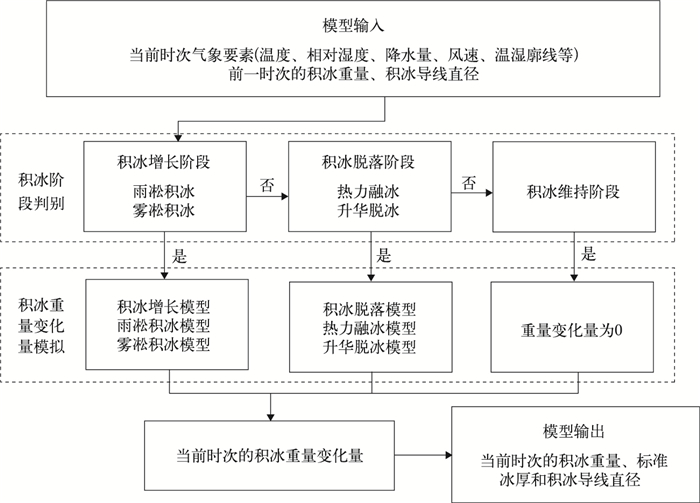
图 1 小时标准冰厚模型的结构流程
Fig. 1 The structure flowchart of the Hourly Standard Ice Thickness Model

图 3 浙江省2008年1月中旬—2月上旬的小时标准冰厚
(a)01-12T23:00,(b)01-17T23:00,(c)01-23T11:00,(d)01-26T11:00,(e)01-30T11:00,(f)02-0211:00,(g)02-03T11:00,(h)02-05T23:00
Fig. 3 Hourly standard ice thickness over Zhejiang Province from mid-Jan to early-Feb in 2008
(a)2300 BT 12 Jan 2008, (b)2300 BT 17 Jan 2008, (c)1100 BT 23 Jan 2008, (d)1100 BT 26 Jan 2008, (e)1100 BT 30 Jan 2008, (f)1100 BT 02 Feb 2008, (g)1100 BT 03 Feb 2008, (h)2300 BT 05 Feb 2008

图 4 浙江省2013年1月上旬的小时标准冰厚
(a)01-02T23:00,(b)01-05T11:00,(c)01-06T11:00,(d)01-07T11:00,(e)01-08T11:00,(f)01-10T17:00
Fig. 4 Hourly standard ice thickness over Zhejiang Province in the first ten-day period of Jan in 2013
(a)2300 BT 02 Jan 2013, (b)1100 BT 05 Jan 2013, (c)1100 BT 06 Jan 2013, (d)1100 BT 07 Jan 2013, (e)1100 BT 08 Jan 2013, (f)1700 BT 10 Jan 2013

图 5 浙江省2008年 (a) 和2013年 (b) 冰灾的最大标准冰厚模拟值及事故线路标准冰厚的测量位置
Fig. 5 The maximum standard ice thickness from model and sites of collapsed lines with measured standard ice thickness during ice accidents of Zhejiang Province in 2008(a) and 2013(b)
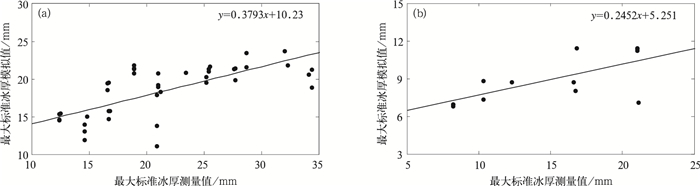
图 6 2008年 (a) 和2013年 (b) 冰灾事故调查点的最大标准冰厚测量值与模拟值散点图
Fig. 6 A scatter gram of the measured maximum standard ice thickness against simulated values at the icing accident sites in 2008(a) and 2013(b)
图 7 2013年1月1—10日模拟导线拉力监测点的小时标准冰厚观测值与实测值
(a)11M00000000714220,(b)11M00000000715632,(c)11M00000001241605,(d)11M00000001297168,(e)11M00000003114326,(f)11M00000003261116,(g)11M00001617765804,(h)11M00001621741047
Fig. 7 The measured and simulated hourly standard ice thickness at wire tension monitoring sites from 1 Jan to 10 Jan in 2013
(a)11M00000000714220, (b)11M00000000715632, (c)11M00000001241605, (d)11M00000001297168, (e)11M00000003114326, (f)11M00000003261116, (g)11M00001617765804, (h)11M00001621741047
表 1 电线积冰观测站点位置
Table 1 Location of wire icing observation stations
序号 站名 纬度 经度 海拔/m 1 湖州 30.87°N 120.05°E 4.1 2 杭州 30.23°N 120.17°E 43.2 3 定海 30.04°N 122.11°E 35.7 4 金华 29.12°N 119.65°E 64.7 5 鄞州 29.78°N 121.55°E 6.0 6 仙居 28.85°N 120.72°E 52.0 7 临海 28.87°N 121.20°E 6.6 8 洪家 28.62°N 121.42°E 2.2  下载: 导出CSV
表 2 模拟导线拉力监测点位置
Table 2 Location of wire tension monitoring sites
序号 观测点编号 纬度 经度 海拔/m 1 11M00000000711808 29.364°N 120.556°E 279.1 2 11M00000000712678 28.990°N 119.719°E 194.6 3 11M00000000712687 28.957°N 119.738°E 305.9 4 11M00000000714220 28.723°N 119.851°E 776.8 5 11M00000000715333 29.236°N 120.103°E 283.4 6 11M00000000715390 29.236°N 120.104°E 272.4 7 11M00000000715551 29.108°N 120.088°E 635.1 8 11M00000000715558 29.084°N 120.078°E 501.1 9 11M00000000715618 29.124°N 120.055°E 476.5 10 11M00000000715629 29.086°N 120.054°E 415.3 11 11M00000000715632 29.071°N 120.068°E 597.7 12 11M00000001241605 27.866°N 119.439°E 517.1 13 11M00000001243837 28.767°N 120.347°E 1021.5 14 11M00000001243985 28.437°N 119.172°E 857.4 15 11M00000001245255 28.387°N 120.070°E 665.5 16 11M00000001294705 28.780°N 118.817°E 274.5 17 11M00000001297168 28.794°N 118.830°E 334.9 18 11M00000001298444 29.000°N 118.397°E 331.7 19 11M00000001299096 28.746°N 118.567°E 249.2 20 11M00000001300907 28.945°N 119.156°E 327.7 21 11M00000003114326 28.946°N 121.343°E 564.7 22 11M00000003261116 29.395°N 120.429°E 604.5 23 11M00001602707996 28.058°N 120.375°E 599.3 24 11M00001602721894 28.057°N 120.392°E 669.6 25 11M00001617765804 28.218°N 120.235°E 400.5 26 11M00001617765912 28.311°N 120.220°E 213.1 27 11M00001621741047 29.069°N 121.419°E 337.7
下载: 导出CSV
表 3 电线积冰观测站点日标准冰厚模拟值和观测值的比较
Table 3 Comparisons between simulation and observation of daily standard ice thickness at wire icing observation stations
年份 站名 最大观测
值/mm最大模拟
值/mm观测均方
差/mm模拟均方
差/mm平均绝对偏
差/mm积冰天气 2008年 湖州 0.00 2.39 0.00 0.61 0.54 雨凇,雨夹雪 杭州 0.45 0.45 0.08 0.10 0.07 雨凇,雨夹雪 定海 0.00 0.16 0.00 0.04 0.01 雨夹雪 金华 4.63 3.99 1.02 0.97 0.47 雨凇,雨夹雪 鄞州 0.00 0.82 0.00 0.25 0.15 雨夹雪 仙居 微量 0.37 0.00 0.13 0.04 雨凇,雨夹雪 临海 0.96 0.95 0.17 0.24 0.06 雨凇,雨夹雪 洪家 微量 0.08 0.00 0.02 0.01 雨凇,雨夹雪 2013年 湖州 0.00 0.92 0.00 0.30 0.32 雨夹雪 杭州 0.00 1.21 0.00 0.40 0.30 雨夹雪 定海 0.00 0.01 0.00 0.02 0.00 金华 0.00 1.57 0.00 0.58 0.51 雨夹雪 鄞州 0.00 0.98 0.00 0.33 0.23 雨夹雪 仙居 0.00 0.83 0.00 0.29 0.16 雨夹雪 临海 0.00 0.28 0.00 0.11 0.06 洪家 0.00 0.09 0.00 0.04 0.02 注:2008年各站样本量为31,2013年各站样本量为10。
下载: 导出CSV
表 4 小时标准冰厚观测值与模拟值的统计分析
Table 4 Statistical analysis of measured and simulated hourly standard ice thickness
观测点编号 最大观测
值/mm最大模拟
值/mm观测均
方差/mm模拟均
方差/mm决定
系数均方根
误差/mm11M00000000711808 3.70 4.00 1.21 1.54 0.7356 0.63 11M00000000712678 4.10 4.60 1.13 1.26 0.9287 0.30 11M00000000712687 5.60 4.90 1.87 1.44 0.9042 0.58 11M00000000714220 7.20 8.90 2.66 3.29 0.8945 0.86 11M00000000715333 5.40 4.10 1.78 1.21 0.8118 0.78 11M00000000715390 5.50 4.10 1.87 1.21 0.7650 0.91 11M00000000715551 10.40 8.00 3.53 2.83 0.5422 2.40 11M00000000715558 8.40 7.60 3.12 2.30 0.8524 1.20 11M00000000715618 7.60 7.00 2.79 2.13 0.8595 1.05 11M00000000715629 7.60 7.10 2.99 2.20 0.8634 1.11 11M00000000715632 10.70 8.40 4.27 2.96 0.8340 1.69 11M00000001241605 2.30 2.30 0.57 0.47 0.8815 0.20 11M00000001243837 9.50 10.20 3.26 3.83 0.8704 1.18 11M00000001243985 8.60 6.70 3.19 2.56 0.8765 1.12 11M00000001245255 7.30 5.20 2.52 1.57 0.5209 1.75 11M00000001294705 5.10 5.20 1.51 1.61 0.8939 0.49 11M00000001297168 4.50 5.70 1.49 1.95 0.5384 1.01 11M00000001298444 4.40 3.80 1.23 1.02 0.6974 0.68 11M00000001299096 5.60 5.00 1.82 1.57 0.9010 0.57 11M00000001300907 5.70 5.20 1.83 1.49 0.5823 1.19 11M00000003114326 7.20 5.80 2.12 1.77 0.9003 0.67 11M00000003261116 7.10 6.60 2.43 2.37 0.8850 0.83 11M00001602707996 3.70 2.50 0.72 0.59 0.7207 0.38 11M00001602721894 3.10 2.50 0.70 0.55 0.9001 0.22 11M00001617765804 2.90 2.40 0.87 0.69 0.9103 0.26 11M00001617765912 0.90 1.10 0.19 0.23 0.88857 0.10 11M00001621741047 6.20 5.60 1.33 1.63 0.8935 0.43 注:各站样本量均为240。
下载: 导出CSV
-
[1] 电力规划设计总院, 电力工程气象勘测技术规程 (DL/T 5158-2012).北京:中国电力出版社, 2012:23-24. [2] 殷水清, 赵珊珊, 王遵娅, 等.全国电线结冰厚度分布及等级预报模型.应用气象学报, 2009, 20(6):722-728. http://qikan.camscma.cn/jams/ch/reader/view_abstract.aspx?file_no=20090610&flag=1 [3] 廖玉芳, 段丽洁.湖南电线覆冰厚度估算模型研究.大气科学学报, 2010, 33(4):395-400. http://www.cnki.com.cn/Article/CJFDTOTAL-NJQX201004001.htm [4] 温华洋, 田红, 唐为安, 等.安徽省电线积冰标准冰厚的气象估算模型.应用气象学报, 2011, 22(6):747-752. http://qikan.camscma.cn/jams/ch/reader/view_abstract.aspx?file_no=20110613&flag=1 [5] Zarnani A, Musilek P, Shi X, et al.Learning to predict ice accretion on electric power lines. Eng Appl Artif Intel, 2012, 25(3):609-617. doi: 10.1016/j.engappai.2011.11.004 [6] Jones K F.A simple model for freezing rain ice loads. Atmos Res, 1998, 46(1):87-97. http://www.sciencedirect.com/science/article/pii/S0169809597000537 [7] Makkonen L.Modeling of Ice Accretion on Wires. J Climate Appl Meteor, 1984, 23(6):929-939. doi: 10.1175/1520-0450(1984)023<0929:MOIAOW>2.0.CO;2 [8] Makkonen L, Lozowski E P.Numerical Modelling of Icing on Power Network Equipment, Atmospheric Icing of Power Networks.Springer Netherlands, 2008:83-117. [9] 吴息, 孙朋杰, 刘渝, 等.基于雾条件下能见度估算的导线覆冰气象模型.应用气象学报, 2012, 23(6):755-762. http://qikan.camscma.cn/jams/ch/reader/view_abstract.aspx?file_no=20120613&flag=1 [10] Degaetano A T, Belcher B N, Spier P L.Short-term ice accretion forecasts for electric utilities using the weather research and forecasting model and a modified precipitation-type algorithm. Wea Forecasting, 2008, 23(5):838-853. doi: 10.1175/2008WAF2006106.1 [11] Musilek P, Arnold D, Lozowski E P.An ice accretion forecasting system (IAFS) for power transmission lines using numerical weather prediction. SOLA, 2009, 5(1):25-28. https://www.researchgate.net/publication/230751569_An_Ice_Accretion_Forecasting_System_IAFS_for_Power_Transmission_Lines_Using_Numerical_Weather_Prediction [12] Pytlak P, Musilek P, Lozowski E, et al.Evolutionary optimization of an ice accretion forecasting system. Mon Wea Rev, 2010, 138(7):2913-2929. doi: 10.1175/2010MWR3130.1 [13] Drage M A, Hauge G.Atmospheric icing in a coastal mountainous terrain.Measurements and numerical simulations, a case study. Cold Reg Sci Technol, 2008, 53(2):150-161. doi: 10.1016/j.coldregions.2007.12.003 [14] Nygaard B E K, Kristjánsson J E, Makkonen L.Prediction of in-cloud icing conditions at ground level using the WRF model. J Appl Meteor Climatol, 2011, 50(12):2445-2459. doi: 10.1175/JAMC-D-11-054.1 [15] Farzaneh M, Savadjiev K.Statistical analysis of field data for precipitation icing accretion on overhead power lines. IEEE T Power Delivery, 2005, 20(2):1080-1087. doi: 10.1109/TPWRD.2004.838518 [16] Nygaard B E K, Ágústsson H, Somfalvi-Tóth K.Modeling wet snow accretion on power lines:Improvements to previous methods using 50 years of observations. J Appl Meteor Climatol, 2013, 52(10):2189-2203. doi: 10.1175/JAMC-D-12-0332.1 [17] 廖祥林.导线覆冰性质分类和密度浅析.电力建设, 1994, 15(9):17-25. http://www.cnki.com.cn/Article/CJFDTOTAL-DLJS409.004.htm [18] 郭恒, 马俊.中国电网大规模冰灾事故调查及分析.重庆电力高等专科学校学报, 2010, 15(4):28-31. http://www.cnki.com.cn/Article/CJFDTOTAL-CQDL201004008.htm [19] Ramer J.An Empirical Technique for Diagnosing Precipitation Type from Model Output.5th International Conference on Aviation Weather Systems, 1993:227-230. [20] Fikke S, Ronsten G, Heimo A, et al.COST 727:Atmospheric Icing on Structures Measurements and Data Collection on Icing:State of the Art.2006:22-28. [21] Savadjiev K, Farazaneh M.Modeling of Icing and Ice Shedding on Overhead Power Lines Based on Statistical Analysis of Meteorological Data. IEEE T Power Delivery, 2004, 19(2):715-721. doi: 10.1109/TPWRD.2003.822527 [22] Finstad K J, Lozowski E P, Gates E M.A computational investigation of water droplet trajectories. J Atmos Oceanic Tech, 1988, 5(1):160-170. doi: 10.1175/1520-0426(1988)005<0160:ACIOWD>2.0.CO;2 [23] 浙江省电力公司, 浙江省电力设计院, 浙江省气象科学研究所. 浙江电网冰区分布图绘制技术报告. 2013: 10-16. [24] 王伯民.基本气象资料质量控制综合判别法的研究.应用气象学报, 2004, 15(增刊Ⅰ):50-59. http://www.cnki.com.cn/Article/CJFDTOTAL-YYQX2004S1008.htm [25] 刘小宁, 鞠晓慧, 范邵华.空间回归检验方法在气象资料质量检验中的应用.应用气象学报, 2006, 17(1):37-43. http://qikan.camscma.cn/jams/ch/reader/view_abstract.aspx?file_no=20060106&flag=1 [26] 杨萍, 刘伟东, 仲跻芹, 等.北京地区自动气象站气温观测资料的质量评估.应用气象学报, 2011, 22(6):706-715. http://qikan.camscma.cn/jams/ch/reader/view_abstract.aspx?file_no=20110608&flag=1 [27] 龚坚刚, 徐青松, 胡旭光.输电线路覆冰的模拟导线实时监测.电力建设, 2011, 31(12):20-22. http://www.cnki.com.cn/Article/CJFDTOTAL-DLJS201012006.htm [28] Gultepe I, Isaac G A.Liquid water content and temperature relationship from aircraft observations and its applicability to GCMs. J Climate, 1997, 10(3):446-452. doi: 10.1175/1520-0442(1997)010<0446:LWCATR>2.0.CO;2 [29] Personne P, Gayet J F.Ice accretion on wires and anti-icing induced by Joule effect. J Appl Meteor, 1988, 27(2):101-114. doi: 10.1175/1520-0450(1988)027<0101:IAOWAA>2.0.CO;2 [30] Sakamoto Y.Snow accretion on overhead wires. Philos T R Soc A, 2000, 358(1776):2941-2970. doi: 10.1098/rsta.2000.0691 [31] Bonelli P, Lacavalla M, Marcacci P, et al.Wet snow hazard for power lines:A forecast and alert system applied in Italy. Nat Hazard Earth Sys, 2011, 11(9):2419-2431. doi: 10.5194/nhess-11-2419-2011 [32] 陈百炼, 吴战平, 张艳梅, 等.贵州冬季电线积冰及其天气成因分析.气象, 2014, 40(3):355-363. http://www.cnki.com.cn/Article/CJFDTOTAL-QXXX201403011.htm -

 点击查看大图
计量
- 摘要浏览量: 2686
- HTML全文浏览量: 1093
- PDF下载量: 386
- 被引次数: 0
