
 设为首页
设为首页 加入收藏
加入收藏

A New Index for Surface Sensible Heat Flux over the Tibetan Plateau and Its Possible Impacts on the Rainfall in South China
-
摘要: 利用1982-2012年青藏高原中东部70个气象站的月平均地面感热资料、华南地区92个气象站的月平均降水资料、NCEP/NCAR月平均再分析资料和SEOF(season reliant EOF)方法选取了4个高原代表站,建立了青藏高原地面感热强度距平指数(ISH),并讨论了春季ISH与华南盛夏(7月和8月)降水的关系。结果表明:ISH可以较好地表征青藏高原中东部地面感热的年际变化特征,且具有更好的持续性。春季ISH与华南盛夏降水具有显著的负相关关系,当春季ISH偏大时,后期对流层中上层高度场异常偏高,且高度场异常偏高的响应随时间从低层向高层传递,使夏季副热带高压偏强、偏西,南亚高压异常偏强,华南地区盛夏降水偏少;反之亦然。此外,去除Niño3.4区海温对华南盛夏降水影响后,两者的负相关关系变得更为显著。Abstract: The intensity of surface sensible heat flux (SH) over the Tibetan Plateau is one of the most significant prior signals for precipitation anomalies in China. However, it's always a challenge to establish an index to describe the strength of SH due to the lack of corresponding observations and the complex topography. Based on the monthly surface sensible heat flux over the Tibetan Plateau which is calculated from observations including air temperature, land surface temperature, near surface wind speed and pressure in 70 meteorological stations provided by China Meteorological Administration (CMA) and normalized difference vegetation index (NDVI) observed by National Oceanic and Atmospheric Administration (NOAA) remote sensing satellites and the season reliant EOF method (SEOF), 4 representative stations are chosen, a new sensible heat index (ISH) is defined, and then the monthly ISH from 1982 to 2012 is calculated. By comparing with the average sensible heat in 70 stations which represents the regional averaged sensible heat condition in the mid-eastern Tibetan Plateau, surface heating strength index (B-H) and two indices of Xizang Plateau from National Climate Center, it's concluded that the inter-annual variabilities of ISH can represent the surface sensible heat in the middle and eastern region of the Tibetan Plateau, and this index has better relationship with two indices of Xizang Plateau than B-H, especially in winter, which mean ISH reflects geopotential height anomalies respond to surface heat better. Then the relationship between ISH in spring and the summer rainfall (total precipitation in June and July) in South China from 1982 to 2012 is discussed based on the monthly rainfall data in 92 meteorological stations provided by CMA and the monthly NCEP/NCAR reanalysis data. Results show that ISH in spring bears significant negative correlations with summer rainfall in South China. The larger index in spring indicates higher geopotential height in mid-low latitudes and lower in high latitudes during next several months, and the positive anomalies in mid-low latitudes transfer from middle troposphere to upper and maintain in 200 hPa, which may lead to the westward extension of subtropical high in 500 hPa, the South Asian high in 200 hPa and westerly wind around 40°N enhancing, whereafter, it may result in the downdraft and southerly wind enhancing, but water vapor convergence subside in South China, moisture can be transported to northern region through South China. And finally, it will cause the reduction of precipitation in South China during the summertime. In addition, negative correlations will become even more significant after removing the influence of sea surface temperature (SST) in regions of Niño3.4, which indicates there may be more complex coupled influence derived from the Tibetan Plateau heating and SST anomalies in Niño regions.
-
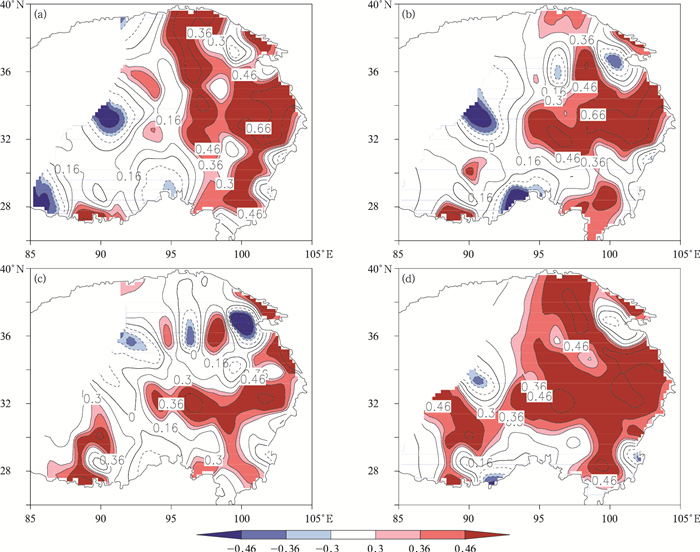
图 1 1982—2012年高原地面感热SEOF第1模态空间分布
(a) 冬季,(b) 春季,(c) 夏季,(d) 秋季
Fig. 1 SEOF first modal directional distribution of surface sensible heat flux over the Tibetan Plateau from 1982 to 2012
(a) winter, (b) spring, (c) summer, (d) autumn

图 3 1982-2012年春季ISH和华南地区92个气象站7—8月降水量的简单相关系数 (a) 和剔除Niño3.4指数的偏相关系数 (b) 分布
(阴影表示达到0.05显著性水平)
Fig. 3 Distribution of simple correlation coefficient (a) and partial correlation coefficient (b) between ISH in spring and Jul-Aug total precipitation of 92 meteorological stations in South China from 1982 to 2012
(the shaded denotes passing the test of 0.05 level)
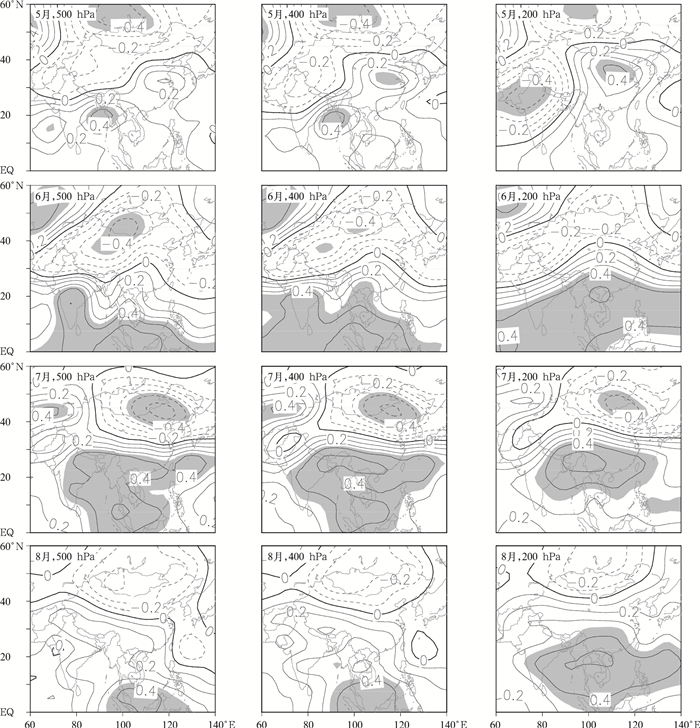
图 4 5月ISH与5—8月逐月各等压面高度场的相关分布
(阴影表示达到0.05显著性水平)
Fig. 4 Distribution of monthly correlation coefficient between ISH in May and geopotential height from May to Aug
(the shaded denotes passing the test of 0.05 level)
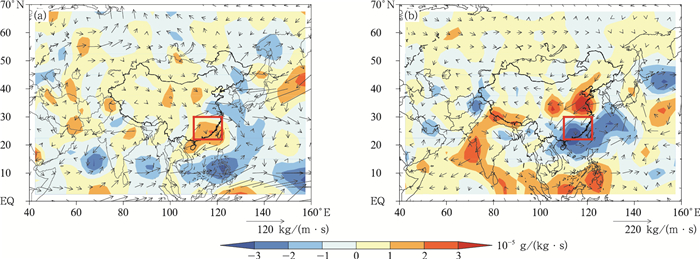
图 5 高原春季感热偏强 (弱) 年合成的7—8月地面到300 hPa水汽通量 (矢量) 及其水汽通量散度 (填色)
(红框内为本文研究的华南区域)(a) 感热偏强年,(b) 感热偏弱年
Fig. 5 Moisture tranfer (the vector) and its divergence (the shaded) in Jul and Aug (integral going from ground to 300 hPa)
(red box denotes the researched precipitation area)(a) stronger ISH in spring, (b) weaker ISH in spring
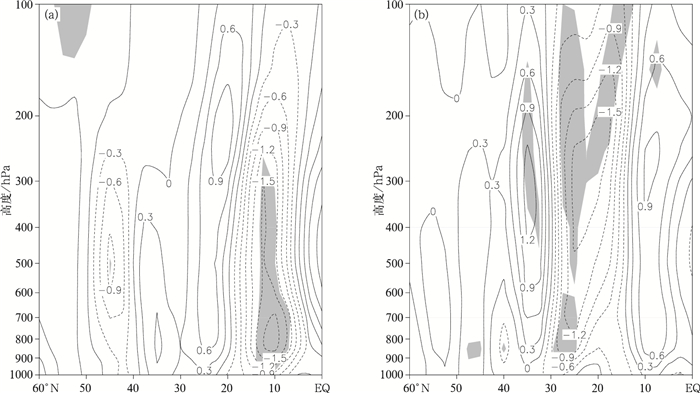
图 6 高原春季感热偏强 (弱) 年合成的110°~120°E平均的垂直速度的高度-经度剖面图
(单位:0.01 Pa/s,阴影表示达到0.05显著性水平)(a) 感热偏强年,(b) 感热偏弱年
Fig. 6 Zonal mean (110°-120°E) vertical velocity field
(unit:0.01 Pa/s, the shaded denotes passing the test of 0.05 level)(a) stronger ISH in spring, (b) weaker ISH in spring
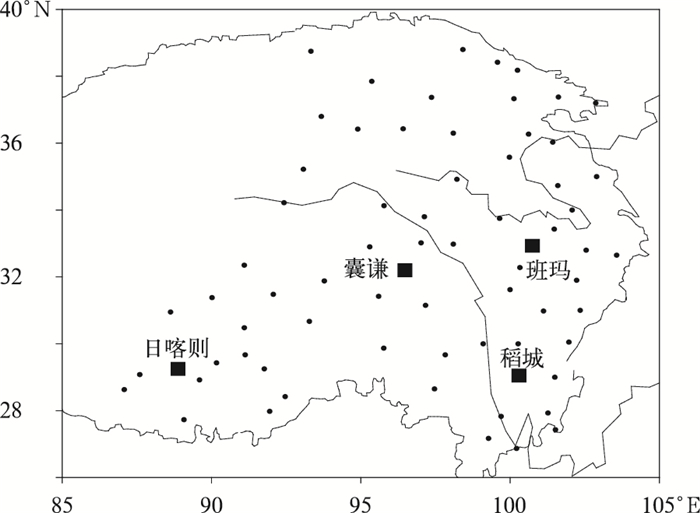
表 1 各代表站常数A和气候平均值M
Table 1 Constant A and the climatological mean values M of four representative stations
月份 A M 日喀则 班玛 稻城 囊谦 1 1.2 1.2 1.5 1.2 6.2 2 1.2 1.2 1.45 1.2 14.0 3 1.2 1.2 1.45 1.2 24.5 4 1.2 1.2 1.45 1.2 33.9 5 1.3 1.45 1.5 1.4 38.9 6 1.3 1.6 1.55 1.6 30.3 7 1.4 1.7 1.55 1.7 22.9 8 1.4 1.7 1.55 1.7 20.2 9 1.4 1.65 1.6 1.6 17.3 10 1.2 1.4 1.6 1.4 14.1 11 1.2 1.3 1.5 1.2 9.2 12 1.2 1.3 1.5 1.2 5.0  下载: 导出CSV
表 2 1982—2012年高原地面感热强度距平指数ISH与其他高原指数的逐月相关
Table 2 Monthly correlation coefficients between ISH and other Plateau indices from 1982 to 2012
月份 70个站平均感热距平 B-H指数 IXZ1 IXZ2 1 0.66 0.59 -0.42 -0.34 2 0.67 0.53 -0.49 -0.48 3 0.73 0.34 -0.27 -0.21 4 0.77 -0.12 -0.52 -0.47 5 0.78 -0.05 -0.36 -0.39 6 0.85 0.43 -0.29 -0.37 7 0.65 0.17 0.08 0.01 8 0.91 0.53 0.01 0.17 9 0.83 0.26 -0.22 -0.30 10 0.80 0.09 -0.51 -0.40 11 0.82 0.46 -0.41 -0.34 12 0.56 0.32 -0.16 -0.16 注:0.01显著性水平的临界值为0.456,0.05显著性水平的临界值为0.355。
下载: 导出CSV
-
[1] Yeh T C.The circulation of the high troposphere over China in the winter of 1945-1946. Tellus, 1950, 2(3):173-183. doi: 10.3402/tellusa.v2i3.8548 [2] 叶笃正, 罗四维, 朱抱真.西藏高原及其附近的流场结构和对流层大气的热量平衡.气象学报, 1957, 28(2):108-121. http://www.cnki.com.cn/Article/CJFDTOTAL-QXXB195702002.htm [3] Flohn H.Contributions to a meteorology of the Tibetan High-lands. Atmospheric Science Paper, 1968, 130:1-120. http://ci.nii.ac.jp/ncid/BB07816232 [4] 吴国雄, 李伟平, 郭华, 等. 青藏高原感热气泵和亚洲夏季风//叶笃正. 赵九章纪念文集. 北京: 科学出版社, 1997. [5] 田珊儒, 段安民, 王子谦, 等.地面加热与高原低涡和对流系统相互作用的一次个例研究.大气科学, 2015, 39(1):125-136. http://www.cnki.com.cn/Article/CJFDTOTAL-DQXK201501010.htm [6] Zuo Z, Zhang R, Zhao P.The relation of vegetation over the Tibetan Plateau to rainfall in China during the boreal summer. Climate Dyn, 2011, 36(5-6):1207-1219. doi: 10.1007/s00382-010-0863-6 [7] 王跃男, 陈隆勋, 何金海, 等.夏季青藏高原热源低频振荡对我国东部降水的影响.应用气象学报, 2009, 20(4):419-427. http://qikan.camscma.cn/jams/ch/reader/view_abstract.aspx?file_no=20090405&flag=1 [8] 吴国雄, 刘屹岷, 刘新, 等.青藏高原加热如何影响亚洲夏季的气候格局.大气科学, 2005, 29(1):47-56;167-168. http://www.cnki.com.cn/Article/CJFDTOTAL-DQXK200501005.htm [9] Ueda H, Kamahori H, Yamazaki N.Seasonal contrasting features of heat and moisture budgets between the eastern and western Tibetan Plateau during the GAME IOP. J Climate, 2003, 16(14):2309-2324. doi: 10.1175/2757.1 [10] 董敏, 朱文妹, 徐祥德.青藏高原地表热通量变化及其对初夏东亚大气环流的影响.应用气象学报, 2001, 12(4):458-468. http://qikan.camscma.cn/jams/ch/reader/view_abstract.aspx?file_no=20010460&flag=1 [11] 王同美, 吴国雄, 宇婧婧.春季青藏高原加热异常对亚洲热带环流和季风爆发的影响.热带气象学报, 2009, 25(增刊Ⅰ):92-102. http://www.cnki.com.cn/Article/CJFDTOTAL-RDQX2009S1011.htm [12] 孙国武, 刘晓东, 陈葆德.夏季青藏高原地面热源对黄河上游流量及径流的影响.应用气象学报, 1993, 4(1):22-29. http://qikan.camscma.cn/jams/ch/reader/view_abstract.aspx?file_no=19930108&flag=1 [13] 柏晶瑜, 徐祥德, 周玉淑, 等.春季青藏高原感热异常对长江中下游夏季降水影响的初步研究.应用气象学报, 2003, 14(3):363-368. http://qikan.camscma.cn/jams/ch/reader/view_abstract.aspx?file_no=20030344&flag=1 [14] 徐国昌, 李栋梁, 陈丽萍.青藏高原地面加热场强度的气候特征.高原气象, 1990, 9(1):32-43. http://www.cnki.com.cn/Article/CJFDTOTAL-GYQX199001003.htm [15] 李栋梁, 陈丽萍.河西走廊黑河流量的气候特征及其预报.应用气象学报, 1991, 2(3):319-324. http://qikan.camscma.cn/jams/ch/reader/view_abstract.aspx?file_no=19910343&flag=1 [16] 李栋梁, 陈丽萍.青藏高原地面加热场强度与东亚环流及西北初夏旱的关系.应用气象学报, 1990, 1(4):383-391. http://qikan.camscma.cn/jams/ch/reader/view_abstract.aspx?file_no=19900457&flag=1 [17] 李栋梁, 何金海, 汤绪, 等.青藏高原地面加热场强度与ENSO循环的关系.高原气象, 2007, 26(1):39-46. http://www.cnki.com.cn/Article/CJFDTOTAL-GYQX200701003.htm [18] 李栋梁.青藏高原地面加热场强度变化及其与太阳活动的关系.高原气象, 2006, 25(6):975-982. http://www.cnki.com.cn/Article/CJFDTOTAL-GYQX200606000.htm [19] 戴逸飞, 王慧, 李栋梁.卫星遥感结合气象资料计算的青藏高原地面感热特征分析.大气科学, 2016, 40(5):1009-1021. http://www.cnki.com.cn/Article/CJFDTOTAL-DQXK201605010.htm [20] Wang B, Soon A N.A method for detecting season-dependent modes of climate variability:S-EOF analysis. Geophys Res Lett, 2005, 32:15710. doi: 10.1029/2005GL022709 [21] 魏凤英.现代气候统计诊断与预测技术 (第2版).北京:气象出版社. [22] 齐文文, 张百平, 庞宇, 等.基于TRMM数据的青藏高原降水的空间和季节分布特征.地理科学, 2013, 33(8):999-1005. http://www.cnki.com.cn/Article/CJFDTOTAL-DLKX201308016.htm [23] 宗海锋, 陈烈庭, 张庆云.ENSO与中国夏季降水年际变化关系的不稳定性特征.大气科学, 2010, 34(1):184-192. http://www.cnki.com.cn/Article/CJFDTOTAL-DQXK201001017.htm [24] 朱益民, 杨修群, 陈晓颖, 等.ENSO与中国夏季年际气候异常关系的年代际变化.热带气象学报, 2007, 23(2):105-116. http://www.cnki.com.cn/Article/CJFDTOTAL-RDQX200702000.htm [25] 陶亦为, 孙照渤, 李维京, 等.ENSO与青藏高原积雪的关系及其对我国夏季降水异常的影响.气象, 2011, 37(8):919-928. http://www.cnki.com.cn/Article/CJFDTOTAL-QXXX201108004.htm [26] 刘宣飞, 袁慧珍.ENSO对印度洋偶极子与中国秋季降水关系的影响.大气科学学报, 2006, 29(6):762-768. http://www.cnki.com.cn/Article/CJFDTOTAL-NJQX200606005.htm [27] Huang R H, Wu Y F.The influence of ENSO on the summer climate change in China and its mechanism. Adv Atmos Sci, 1989, 6(1):21-32. doi: 10.1007/BF02656915 [28] Zhang R H, Akimasa S, Masahide K.A diagnostic study of the impact of El Niño on the precipitation in China. Adv Atmos Sci, 1999, 16(2):229-241. doi: 10.1007/BF02973084 [29] Kumar K, Rajagopalan B, Cane M A.On the weakening relationship between the Indian Monsoon and ENSO. Science, 1999, 284(5423):2156-2159. doi: 10.1126/science.284.5423.2156 [30] Chang C P, Patrick H, Ju J H.Possible roles of Atlantic circulations on the weakening Indian monsoon rainfall-ENSO relationship. J Climate, 2001, 14(11):2376-2380. doi: 10.1175/1520-0442(2001)014<2376:PROACO>2.0.CO;2 [31] Si D, Hu Z Z, Kumar A, et al.Is the interdecadal variation of the summer rainfall over eastern China associated with SST?. Climate Dyn, 2015, 46(1-2):135-146. https://www.researchgate.net/publication/291329132_Is_the_interdecadal_variation_of_the_summer_rainfall_over_eastern_China_associated_with_SST [32] 高辉, 王永光.ENSO对中国夏季降水可预测性变化的研究.气象学报, 2007, 65(1):131-137. http://www.cnki.com.cn/Article/CJFDTOTAL-QXXB200701012.htm [33] 于琳琳, 陈海山.青藏高原4月陆面状况和地表加热异常与中国夏季降水的联系.高原气象, 2012, 31(5):1173-1182. http://www.cnki.com.cn/Article/CJFDTOTAL-GYQX201205001.htm [34] 杜银, 张耀存, 谢志清.东亚副热带西风急流位置变化及其对中国东部夏季降水异常分布的影响.大气科学, 2009, 33(3):581-592. http://www.cnki.com.cn/Article/CJFDTOTAL-DQXK200903014.htm -

 点击查看大图
计量
- 摘要浏览量: 2986
- HTML全文浏览量: 1195
- PDF下载量: 471
- 被引次数: 0
