
 设为首页
设为首页 加入收藏
加入收藏

The Bias Analysis of FY-2G Cloud Fraction in Summer and Winter
-
摘要: 开展卫星反演云量的精度评估是业务应用的基础,也是充分发挥卫星观测效益的前提。利用同类卫星产品EOS Aqua/MODIS云产品,选取2015年6月和12月共80个个例,包括43个白天个例,37个夜间个例。采用交叉比对方法对FY-2G云量产品进行相对偏差分析。结果表明:FY-2G与Aqua/MODIS计算云量总体趋势相当,无论从时间分布(白天和夜间)还是季节分布(6月和12月)上看,FY-2G与Aqua云量相对偏差较为稳定,FY-2G反演云量小于Aqua/MODIS反演云量。匹配个例中FY-2G平均云量为72.81%,Aqua/MODIS平均云量是76.19%,两者相关系数为0.74。两者绝对偏差小于5%的像元比例为72.34%;云量偏差绝对值小于15%的像元比例为79.51%。FY-2G与Aqua/MODIS云量偏差主要来自各自卫星的观测能力与所采用的云检测算法。与具有36个探测通道、星下点最低空间分辨率为0.01°×0.01°的Aqua/MODIS观测数据相比,FY-2G所具有的5通道、星下点最高空间分辨率为0.05°×0.05°的观测数据会出现对云,尤其是破碎云和薄卷云的漏检。两种具有不同时空属性的数据在匹配处理时采用的不同算法也会在比对分析中引入偏差。Abstract: Evaluation of satellite retrieval cloud fraction is fundamental for good use in operational weather analyses application. Cloud fraction relative biases between FY-2G and Aqua/MODIS data are investigated in order to validate FY-2G cloud fraction. In order to understand the accuracy of FY-2G cloud fraction better, cases contain both clear and cloud pixels in the target area are selected, and 80 matched cases are analyzed. Results show that the cloud fraction of FY-2G has the same distribution pattern with Aqua/MODIS. The mean cloud fraction of FY-2G is 72.81%, and according to MODIS data it is 76.19%. Among 80 selected cases, 45 cases are in June and 35 cases are in December of 2015. In June, the mean cloud fraction of FY-2G and Aqua is 68.12% and 70.78%, respectively. In December, the mean cloud fraction of FY-2G and Aqua is 78.84% and 83.14%. FY-2G's cloud fraction is smaller than that of Aqua. For all cases, there are 79.15% pixels that their absolute relative bias between FY-2G and Aqua is smaller than 15%. In June, there are 77.78% pixels that the absolute relative bias between FY-2G and Aqua is smaller than 15%, while it is 81.24% in December. The cloud fraction correlation coefficient between FY-2G and Aqua is 0.74 through the year, 0.76 in June and 0.72 in December.During daytime, the mean cloud fraction of FY-2G and Aqua is 70.42% and 72.21%, respectively. There are 67.74% pixels that the absolute deviation between FY-2G and Aqua is smaller than 5%. The cloud fraction correlation coefficient between FY-2G and Aqua is 0.754. For night time cases, FY-2G mean cloud fraction is 75.59% and Aqua is 80.81%. The cloud fraction correlation coefficient between FY-2G and Aqua is 0.73. There are 72.34% pixels that their cloud fraction absolute deviation between FY-2G and Aqua is smaller than 5% during nighttime.Results show that the cloud fraction bias between FY-2G and Aqua is mainly caused by cloud detection accuracy. The cloud detection bias between FY-2G and Aqua mainly comes from different satellite observation ability and cloud detection algorithm. Compared with Aqua/MODIS data that has 36 channels with the lowest 0.01°×0.01° nadir spatial resolution, FY-2G has 5 channels with the highest 0.05°×0.05° spatial resolution. FY-2G's cloud detection easily makes mistakes when it has broken cloud, thinner cirrus or not all covered by cloud in the view. At the same time, different data processing methods within data match processing also cause bias between different kinds of satellite data.
-
Key words:
- FY-2G;
- Aqua;
- cloud fraction;
- bias
-

图 1 FY-2G与Aqua匹配的80个样本空间覆盖范围
Fig. 1 The space distribution of matched sample between FY-2G and Aqua

图 2 FY-2G与Aqua研究匹配个例平均云量
Fig. 2 The mean cloud fraction of matched cases of FY-2G and Aqua
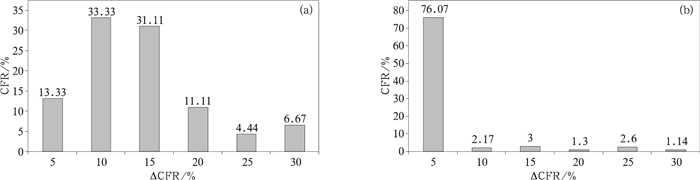
图 3 2015年6月 (a) 和12月 (b) FY-2G与Aqua匹配个例平均云量绝对偏差
Fig. 3 Histogram of absolute CFR bias between FY-2G and Aqua in Jun 2015(a) and Dec 2015(b)
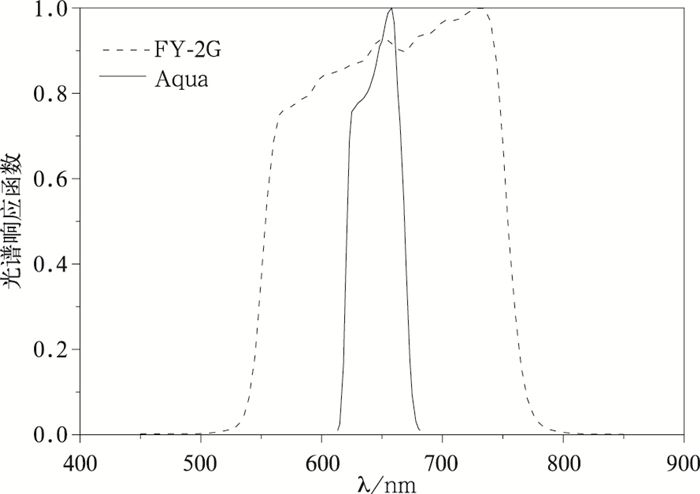
图 4 FY-2G可见光通道1与Aqua/MODIS可见光通道1光谱响应函数分布曲线
Fig. 4 Spectral response function for FY-2G and Aqua/MODIS visible channel 1

图 5 2015年6月26日16:00 FY-2G红外通道1亮温 (a) 和云量 (b) 与16:10 Aqua亮温 (c) 和云量 (d)
Fig. 5 The image of IR1 brightness temperature (a) with CFR (b) of FY-2G at 1600 UTC 26 Jun 2015 and brightness temperature (c) with CFR (d) of Aqua at 1610 UTC 26 Jun 2015
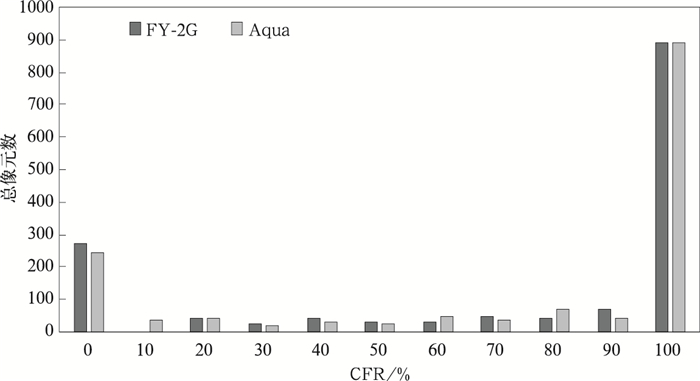
图 6 2015年12月31日18:00 FY-2G与Aqua/MODIS像元云量分布直方图
Fig. 6 The cloud fraction of FY-2G and Aqua/MODIS at 1800 UTC 31 Dec 2015

图 7 临近像元 (NN) 插值和面积平均 (MEAN) 插值两种方法处理的2015年12日31日18:00 Aqua/MODIS云量散点图
Fig. 7 The scatter diagram of Aqua/MODIS cloud fraction calculated by the nearest distance (NN) and average area (MEAN) methods at 1800 UTC 31 Dec 2015
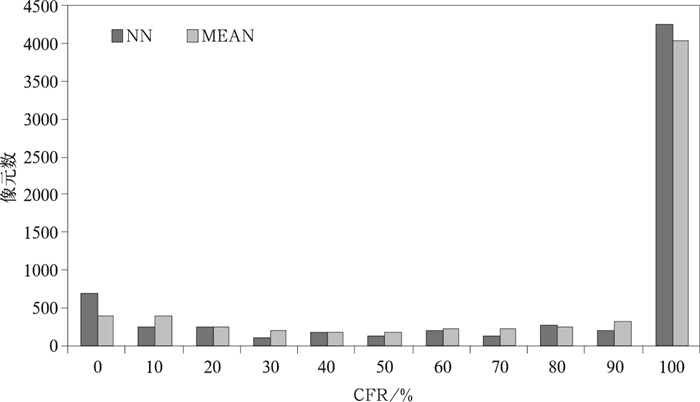
图 8 临近像元 (NN) 插值和面积平均 (MEAN) 插值两种方法处理的2015年12日31日18:00 Aqua/MODIS云量分布直方图
Fig. 8 The histogram of Aqua/MODIS cloud fraction calculated by the nearest distance (NN) and average area (MEAN) methods at 1800 UTC 31 Dec 2015
表 1 EOS/MODIS通道及在云检测算法中的应用[20]
Table 1 EOS/MODIS bands used in MODIS cloud mask algorithm (from reference [20])
通道序号 中心波长/μm 是否用于云检测 云检测中的作用 1 0.659 是 云检测 2 0.865 是 云检测 3 0.470 是 烟尘检测 4 0.555 是 积雪/冰检测 5 1.240 是 烟尘检测 6 1.640 是 Terra积雪/冰检测 7 2.130 是 Aqua积雪/冰检测 8 0.415 是 沙漠上云检测 9 0.443 是 太阳耀斑区晴空检测 10 0.490 否 11 0.531 否 12 0.565 否 13 0.653 否 14 0.681 否 15 0.750 否 16 0.865 否 17 0.905 是 太阳耀斑区晴空检测 18 0.936 是 太阳耀斑区晴空检测 19 0.940 否 26 1.375 是 薄卷云、高云检测 20 3.750 是 陆地、太阳耀斑区晴空检测,积雪/冰、沙尘检测 21 3.959 否 烟尘检测 22 3.959 是 云检测 23 4.050 否 24 4.465 否 25 4.515 否 27 6.715 是 高云检测 28 7.325 是 云检测 29 8.550 是 云、沙尘、积雪检测 30 9.730 否 31 11.030 是 云、沙尘、积雪检测,陆地、太阳耀斑区晴空检测 32 12.020 是 薄卷云检测,云、沙尘检测 33 13.335 是 云检测 34 13.635 否 35 13.935 是 高云检测 36 14.235 否  下载: 导出CSV
表 2 FY-2G与Aqua云量匹配样本参数统计一览表
Table 2 Statistic properties of matched cloud fraction (CFR) cases between FY-2G and Aqua in Jun 2015
个例序号 FY-2G观测时间* 样本量 CFR平均值/% 相关系数 标准差 绝对差小于5%样本百分比/% FY-2G Aqua FY-2G Aqua 1 03T04:00 4080 53.42 47.99 0.76 45.25 40.40 46.25 2 03T16:00 14624 48.80 69.11 0.54 46.36 37.67 78.97 3 04T08:00 2736 82.96 86.54 0.83 33.89 25.23 67.50 4 04T20:00 3186 59.72 58.76 0.81 43.91 43.91 59.76 5 05T07:00 3465 75.54 87.69 0.63 36.44 22.47 53.16 6 05T19:00 4233 74.97 71.45 0.79 37.84 35.98 52.49 7 06T06:00 4524 77.54 83.45 0.86 36.24 21.96 54.24 8 06T18:00 3608 77.41 83.76 0.92 39.48 33.27 80.85 9 09T05:00 7564 90.82 88.09 0.82 26.31 26.52 78.22 10 09T17:00 6600 87.62 94.50 0.58 27.14 13.21 71.58 11 10T04:00 5039 37.66 52.75 0.77 45.59 41.55 27.81 12 10T16:00 3456 68.06 75.55 0.86 18.90 32.78 56.17 13 11T08:00 3589 88.24 89.94 0.78 28.35 22.46 72.89 14 11T20:00 4346 88.68 80.02 0.77 27.00 32.43 67.19 15 12T07:00 4554 67.62 74.14 0.89 44.28 34.45 59.71 16 12T19:00 5106 82.18 78.91 0.82 32.95 30.74 45.48 17 13T08:00 6104 79.36 60.54 0.62 12.57 22.07 60.15 18 13T20:00 4806 80.01 81.08 0.93 36.83 31.22 68.46 19 14T07:00 7027 84.42 72.11 0.80 35.12 34.77 23.68 20 14T19:00 3240 88.12 89.51 0.88 28.38 25.58 82.50 21 15T06:00 8176 83.85 78.42 0.66 33.00 34.59 59.16 22 15T18:00 7252 68.34 72.36 0.85 43.69 35.45 57.62 23 16T05:00 5848 73.81 85.41 0.83 41.59 23.86 62.98 24 18T05:00 4958 47.66 34.99 0.79 44.24 44.31 74.46 25 18T17:00 3471 63.67 68.02 0.90 44.72 35.41 45.10 26 19T04:00 4560 44.80 46.24 0.79 44.63 38.96 49.18 27 19T21:00 4144 93.30 90.12 0.79 21.58 23.28 79.80 28 20T08:00 4601 61.36 50.77 0.81 44.03 39.62 43.90 29 20T20:00 3000 75.06 82.78 0.85 39.79 31.03 66.36 30 21T07:00 9748 57.05 65.33 0.79 44.94 37.97 76.71 31 21T19:00 6965 27.21 35.11 0.82 39.94 41.24 41.52 32 22T06:00 6231 96.88 98.45 0.65 14.28 6.14 90.98 33 22T18:00 5886 35.52 65.87 0.65 45.03 38.76 77.54 34 24T06:00 3400 70.43 45.58 0.72 42.44 39.57 43.82 35 24T18:00 4080 87.36 91.87 0.72 28.73 16.73 69.00 36 25T05:00 14700 73.57 73.30 0.66 39.69 35.45 85.32 37 25T17:00 13431 48.24 57.96 0.74 46.02 38.74 90.85 38 26T04:00 4970 58.53 52.68 0.87 46.20 40.82 52.26 39 26T16:00 3744 93.92 96.89 0.57 21.32 11.17 88.07 40 27T08:00 6137 80.98 97.76 0.63 35.03 6.07 69.94 41 27T20:00 5080 89.23 97.52 0.62 28.18 11.67 84.55 42 29T08:00 8256 2.34 1.02 0.73 12.08 7.15 94.63 43 29T20:00 7885 89.78 95.92 0.67 26.99 13.10 80.28 44 30T07:00 4788 11.44 8.25 0.67 24.45 16.58 70.24 45 30T19:00 13527 38.11 66.72 0.61 45.38 42.39 92.86 注:*观测时间为世界时,下同。
下载: 导出CSV
表 3 2015年12月FY-2G与Aqua云量匹配样本参数统计一览表
Table 3 Statistic properties of matched CFR cases between FY-2G and Aqua in Dec 2015
个例序号 FY-2G观测时间* 样本量 CFR平均值/% 相关系数 标准差 绝对差小于5%样本百分比/% FY-2G Aqua FY-2G Aqua 1 01T06:00 1620 89.02 92.31 0.59 20.36 22.61 76.96 2 04T20:00 1230 55.05 72.91 0.74 45.58 39.07 54.88 3 05T07:00 4857 45.03 65.66 0.56 47.07 40.40 47.79 4 06T03:00 3612 74.09 83.79 0.67 38.77 31.42 61.70 5 06T20:00 2646 95.24 95.18 0.72 18.92 16.84 88.51 6 07T07:00 2193 95.78 94.71 0.65 17.45 17.68 86.82 7 08T18:00 3149 81.97 95.34 0.52 36.05 19.25 79.10 8 09T05:00 3010 75.85 78.14 0.81 40.40 38.00 78.27 9 09T17:00 2844 92.40 93.68 0.84 25.21 22.31 92.26 10 12T04:00 2310 43.58 62.31 0.76 47.37 43.4 60.39 11 12T16:00 1769 69.36 82.8 0.71 42.36 30.67 62.63 12 14T07:00 2329 74.93 86.81 0.57 39.56 26.79 61.75 13 15T06:00 2021 92.46 96.03 0.65 22.88 13.67 84.17 14 16T05:00 2610 94.69 94.75 0.81 19.47 18.77 89.51 15 16T19:00 1247 92.16 92.17 0.62 23.9 20.77 78.43 16 17T06:00 1410 41.82 45.72 0.75 46.01 42.92 55.53 17 18T05:00 1690 67.94 63.44 0.88 41.71 46.19 67.16 18 18T17:00 1290 88.06 92.76 0.86 30.06 22.5 85.35 19 19T04:00 2065 91.37 92.94 0.71 24.68 18.87 80.48 20 20T08:00 1073 79.10 80.58 0.87 38.38 37.24 82.47 21 20T20:00 3889 84.90 83.59 0.81 33.54 31.24 74.67 22 21T07:00 2067 84.19 90.92 0.80 34.87 23.71 81.28 23 24T06:00 1891 72.69 75。00 0.94 43.28 41.15 88.42 24 24T18:00 2881 97.95 92.03 0.56 10。00 24.77 87.82 25 25T05:00 2009 92.79 96.13 0.72 24.14 16.88 90.54 26 25T17:00 1480 97.29 94.24 0.52 11.37 18.7 85.88 27 26T04:00 1768 76.65 79.19 0.94 41.22 38.57 87.56 28 27T05:00 2090 72.03 69.08 0.87 41.39 39.51 63.06 29 27T17:00 1692 73.85 80.22 0.75 38.48 29.03 53.25 30 28T16:00 1802 98.52 97.62 0.60 9.71 10.52 92.17 31 29T20:00 2257 82.87 87.87 0.78 34.21 30.13 81.44 32 30T07:00 2472 75.27 85.67 0.74 39.63 29.84 69.98 33 30T19:00 2520 50.26 55.16 0.64 43.90 44.25 50.63 34 31T06:00 2448 88.67 90.56 0.77 28.83 24.89 81.94 35 31T18:00 1519 71.46 70.72 0.56 40.47 40.08 55.23
下载: 导出CSV
表 4 2015年12月8日和12月25日FY-2G与Aqua/MODIS云量等级像元分布
Table 4 Pixels of cases on different cloud fraction level between FY-2G and Aqua/MODIS on 8 Dec and 25 Dec in 2015
云量/% 12-08 12-25 FY-2G像元数 Aqua像元数 FY-2G像元数 Aqua像元数 [0, 10) 423 96 17 4 [10, 20) 39 8 17 2 [20, 30) 26 18 8 8 [30, 40) 35 11 22 6 [40, 50) 34 12 11 11 [50, 60) 45 4 16 2 [60, 70) 41 20 31 15 [70, 80) 33 80 23 10 [80, 100] 2473 2972 1335 1422
下载: 导出CSV
-
[1] 杨俊, 吕伟涛, 马颖.基于自适应阈值的地基云自动检测方法.应用气象学报, 2009, 20(6):713-721. http://qikan.camscma.cn/jams/ch/reader/view_abstract.aspx?file_no=20090609&flag=1 [2] 高太长, 刘磊, 赵世军.全天空测云技术现状及进展.应用气象学报, 2010, 21(1):101-109. http://qikan.camscma.cn/jams/ch/reader/view_abstract.aspx?file_no=20100114&flag=1 [3] 胡树贞, 马舒庆, 陶法, 等.基于红外实时闭值的全天空云量观测.应用气象学报, 2013, 24(2):179-188. http://qikan.camscma.cn/jams/ch/reader/view_abstract.aspx?file_no=20130206&flag=1 [4] Ackerman S A, Cox S K.Comparison of satellite and all-sky camera estimates of cloud cover during GATE. J Applied Meteor, 1981, 20:581-587. doi: 10.1175/1520-0450(1981)020<0581:COSAAS>2.0.CO;2 [5] Rossow W B, Walker A W, Gander L C.Comparison of ISCCP and other cloud amounts. J Climate, 1993, 6:2394-2418. doi: 10.1175/1520-0442(1993)006<2394:COIAOC>2.0.CO;2 [6] Schreiner A J, Unger D A, Menzel W P, et al.A comparison of ground and satellite observations of cloud cover. Bull Amer Meteor Soc, 1993, 47:1851-1861. https://www.researchgate.net/publication/234300864_A_Comparison_of_Ground_and_Satellite_Observations_of_Cloud_Cover [7] Chepfer H, Goloub P, Sauvage L, et al.Validation of POLDER/ADEROS data using a ground-based lidar network:Preliminary results for cirrus clouds. Physics and Chemistry of the Earth, 1999, 24:203-206. doi: 10.1016/S1464-1909(98)00038-0 [8] Doelling D R, Phan D N, Spangenberg D A, et al.Validation of Satellite Retrieved Cloud Amounts over the Continental United States with Automatic Sciences Research Center Ceilometer Data.Proc 15th ARM Science Team Meeting, 2005. [9] Kotarba A Z.A comparison of MODIS-derived cloud amount with visual surface observations. Atmos Res, 2009, 92:522-530. doi: 10.1016/j.atmosres.2009.02.001 [10] 王帅辉, 韩志刚, 姚志刚.基于CloudSat和ISCCP资料的中国及周边地区云量分布的对比分析.大气科学, 2010, 34(4):767-779. http://www.cnki.com.cn/Article/CJFDTOTAL-DQXK201004010.htm [11] 魏丽, 钟强, 侯萍.中国大陆卫星反演云参数的评估.高原气象, 1996, 15(2):147-156. http://www.cnki.com.cn/Article/CJFDTOTAL-GYQX602.002.htm [12] 王旻燕, 王伯民.ISCCP产品和我国地面观测总云量差异.应用气象学报, 2009, 20(4):411-418. http://qikan.camscma.cn/jams/ch/reader/view_abstract.aspx?file_no=20090404&flag=1 [13] 刘瑞霞, 陈洪滨, 郑照军, 等.总云量产品在中国区域的分析检验.应用气象学报, 2009, 20(5):571-578. http://qikan.camscma.cn/jams/ch/reader/view_abstract.aspx?file_no=20090508&flag=1 [14] Kriebel K T, Gesell G, Kästern M, et al.The cloud analysis tool APOLLO:Improvements and validations. International Journal of Remote Sensing, 2003, 24:2389-2408. doi: 10.1080/01431160210163065 [15] 王可丽, 江灏, 陈世强.青藏高原地区的总云量——地面观测、卫星反演和同化资料的对比分析.高原气象, 2001, 20(3):252-257. http://www.cnki.com.cn/Article/CJFDTOTAL-GYQX200103004.htm [16] 曹芸, 何永健, 邱新法, 等.基于地面观测资料的MODIS云量产品订正.遥感学报, 2012, 16(2):325-342. http://www.cnki.com.cn/Article/CJFDTOTAL-YGXB201202010.htm [17] Karlsson K G.A ten-year cloud climatology over Scandinavia from NOAA AVHRR imagery. Int J Climatol, 2003, 23:1023-1044. doi: 10.1002/(ISSN)1097-0088 [18] 翁笃鸣, 韩爱梅.我国卫星总云量与地面总云量分布的对比分析.应用气象学报, 1998, 9(1):32-37. http://qikan.camscma.cn/jams/ch/reader/view_abstract.aspx?file_no=19980105&flag=1 [19] 刘健, 张里阳.气象卫星高空间分辨率数据的云量计算与检验.应用气象学报, 2011, 22(1):35-45. http://qikan.camscma.cn/jams/ch/reader/view_abstract.aspx?file_no=20110104&flag=1 [20] Ackerman S, Strabala K, Menzel P, et al.Discriminating Clear-Sky from Cloud with MODIS-Algorithm Theoretical Basis Document Products:MOD35.ATBD Reference Number:ATBD-MOD-06, 2010. [21] Ackerman S A, Strabala K I, Menzel W P, et al.Discriminating clear sky from clouds with MODIS. J Geophys Res, 1998, 103:32141-32157. doi: 10.1029/1998JD200032 [22] Frey R A, Ackerman S A, Liu Y, et al.Cloud detection with MODIS.Part I:Recent improvements in the MODIS cloud mask. J Atmos Ocean Technol, 2008, 25(7):1057-1072. doi: 10.1175/2008JTECHA1052.1 [23] Holz R E, Ackerman S A, Nagle F W, et al.Global moderate resolution imaging spectroradiometer (MODIS) cloud detection and height evaluation using CALIOP. J Geophys Res, 2008, 113, D00A19, DOI: 10.1029/2008JD009837. [24] Ackerman S A, Holz R E, Frey R, et al.Cloud detection with MODIS.PartⅡ:Validation. J Atmos Ocean Technol, 2008, 25(7):1073-1086. doi: 10.1175/2007JTECHA1053.1 [25] Platnick S, King M D, Ackerman S A, et al.The MODIS cloud products:Algorithms and examples from Terra. IEEE Trans Geosci Remote Sens, 2003, 41(2):459-473. doi: 10.1109/TGRS.2002.808301 [26] 刘健.中国区域云特性分析及在FY-2云检测中的应用.应用气象学报, 2009, 20(6):673-681. http://qikan.camscma.cn/jams/ch/reader/view_abstract.aspx?file_no=20090604&flag=1 [27] 刘健.FY-2云检测中动态阈值提取技术改进方法研究.红外与毫米波学报, 2010, 29(4):288-292. http://www.cnki.com.cn/Article/CJFDTOTAL-HWYH201004012.htm -

 点击查看大图
计量
- 摘要浏览量: 4435
- HTML全文浏览量: 1237
- PDF下载量: 841
- 被引次数: 0
