
 设为首页
设为首页 加入收藏
加入收藏

The Inconsistency of Forecasting in Operational Numerical Prediction Products
-
摘要: 为探讨模式产品预报不一致性问题,利用2015年11月—2016年10月业务中常用的GQEC,GQJP及T639模式的12 h降水、2 m温度网格产品,采用跳跃指数定量计算方法,研究了产品在不同区域内跳跃指数变化与预报不一致性问题。结果表明:产品多日平均跳跃指数随预报时效延长而增大;长时效预报比短时效预报跳跃频率大、预报不一致性也大;对比两种要素可知,降水的跳跃指数比温度大,跳跃频率高,预报不一致性大;对比不同模式发现,GQEC不仅跳跃指数值小,且跳跃频率低,预报不一致性小,GQJP虽然跳跃指数值小于T639,但其跳跃频率更高,预报一致性较T639低;产品跳跃频率存在季节差异,夏季降水和温度预报跳跃频率最高而冬季最低,夏季预报不一致性最大。研究还发现:基于跳跃指数的预报不一致性特征与选取的区域大小密切相关,区域越大,跳跃指数和预报不一致性越小;区域内跳跃指数分布特征与地理位置和地形等有关。Abstract: The inconsistency of the forecast reflects evolution characteristics with time of the prediction error of continuous multiple prediction at a fixed time in the future. In order to explore the inconsistency of forecasting products in operational numerical forecasting applications, 12 h precipitation and 2 m ground temperature, which are predicted by three numerical models GQEC, T639 and GQJP from November 2015 to October 2016 are analyzed. Quantitative calculation method of Jumpiness index is adopted by considering the sensitivity of the index to the target region.The inconsistency of the numerical model in three different regions is studied by means of statistical analysis and typical case study. Results show that for statistical average, the inconsistency of the numerical models increases with the extension of the forecast time. Long time prediction inconsistency is greater. Jumpiness index of precipitation and temperature is related to the magnitude of the change, and Jumpiness index of precipitation is larger than that of temperature. It also shows that results of two consecutive temperature forecast are more consistent. The temperature prediction ability of the model is better than that of precipitation forecast. The comparison of different numerical models shows that GQEC has obvious advantages in many aspects. Although Jumpiness index of GQJP is less than T639, its jumping frequency is greater, indicating its prediction consistency is inferior to T639. There are seasonal differences in jumping frequency of model products. Both the jump frequency of precipitation and temperature is the highest in summer and the lowest in winter. The inconsistency test of two typical cases of rainstorm and cold air cooling process further corroborates statistical analysis results. Results also show that the forecast inconsistency of the numerical model is not only related to the geographical position, but also to the selected area size. The larger the region is, the smaller Jumpiness index becomes, and vice versa. In addition, the spatial distribution of Jumpiness index in the region is related to geographical location and topography. In general, where elements change bigger, Jumpiness index becomes greater there. The regional distribution of Jumpiness index of different meteorological elements is different. The index value of Jumpiness index of 12 h precipitation forecast increases gradually from north to south in region Ⅰ. While 2 m ground temperature prediction, Jumpiness index from north to south in region Ⅰ gradually decreases.
-
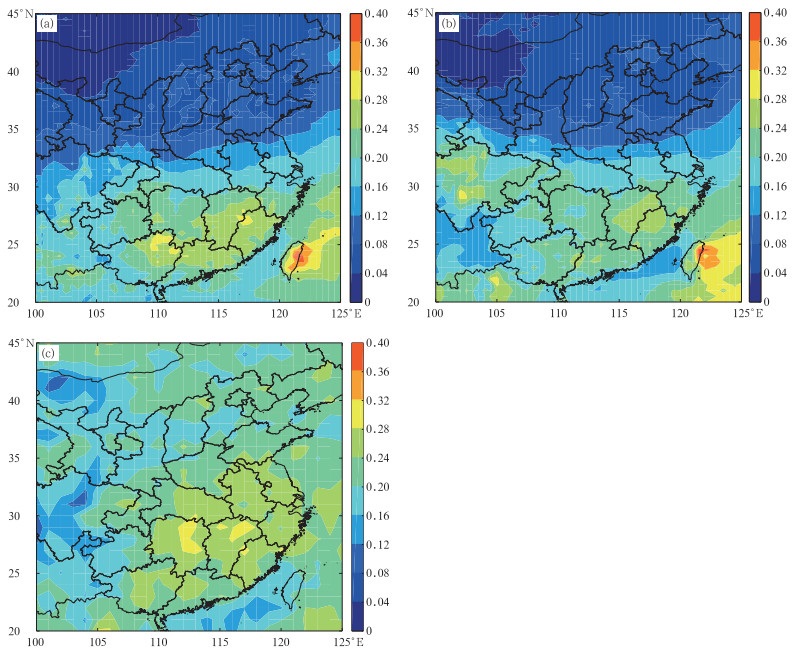
图 2 GQEC(a)、GQJP(b)、T639(c)12 h降水跳跃指数平均区域分布
Fig. 2 Averaged regional distribution of Jumpiness index of 12 h precipitation prediction (a)GQEC, (b)GQJP, (c)T639

图 3 区域Ⅰ(a)、区域Ⅱ(b)、区域Ⅲ(c) 12 h降水预报不同时效的跳跃指数
(08:00, 20:00代表起报时间,下同)
Fig. 3 Jumpiness index of 12 h precipitation prediction with different leading times (a)region Ⅰ, (b)region Ⅱ, (c)region Ⅲ
(08:00, 20:00 represent initial time, similarly hereinafter)
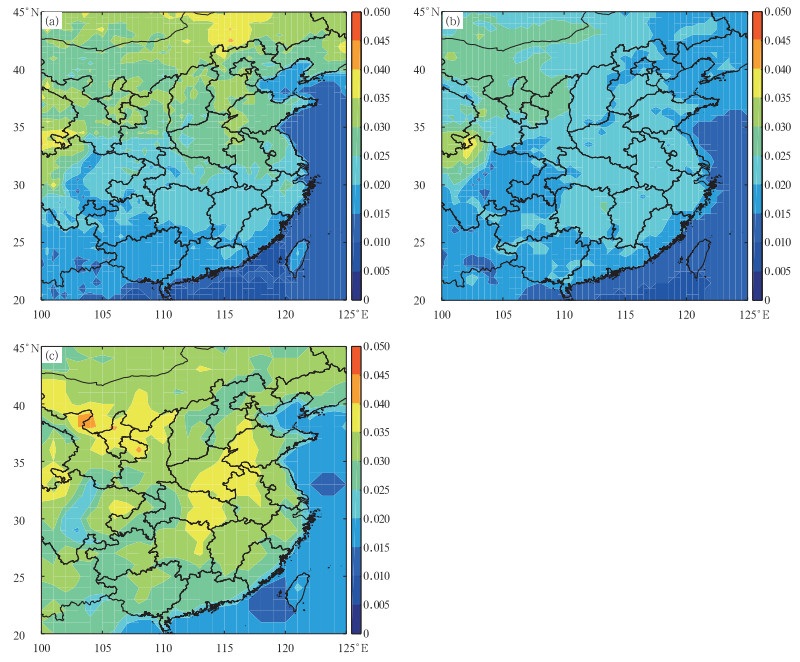
图 4 GQEC(a)、GQJP(b)、T639(c) 2 m温度预报跳跃指数分布
Fig. 4 Averaged regional distribution of Jumpiness index of 2 m temperature prediction (a)GQEC, (b)GQJP, (c)T639
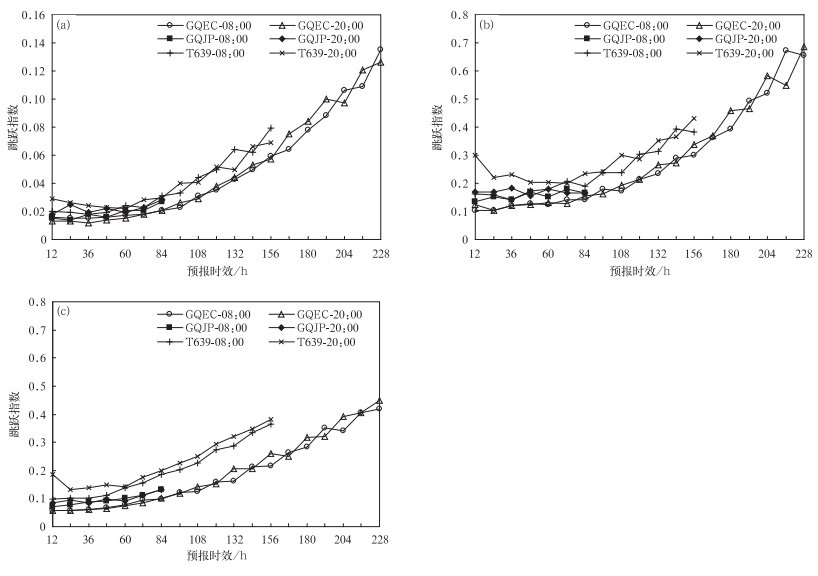
图 5 区域Ⅰ(a)、区域Ⅱ(b)、区域Ⅲ(c) 2 m温度不同时效预报跳跃指数
Fig. 5 Jumpiness index of 2 m temperature prediction with different leading times (a)region Ⅰ, (b)region Ⅱ, (c)region Ⅲ

图 6 区域Ⅰ(a)、区域Ⅱ(b)、区域Ⅲ(c)12 h降水预报不同时效跳跃频率
Fig. 6 Jumping frequency of 12 h precipitation prediction with different leading times (a)region Ⅰ, (b)region Ⅱ, (c)region Ⅲ
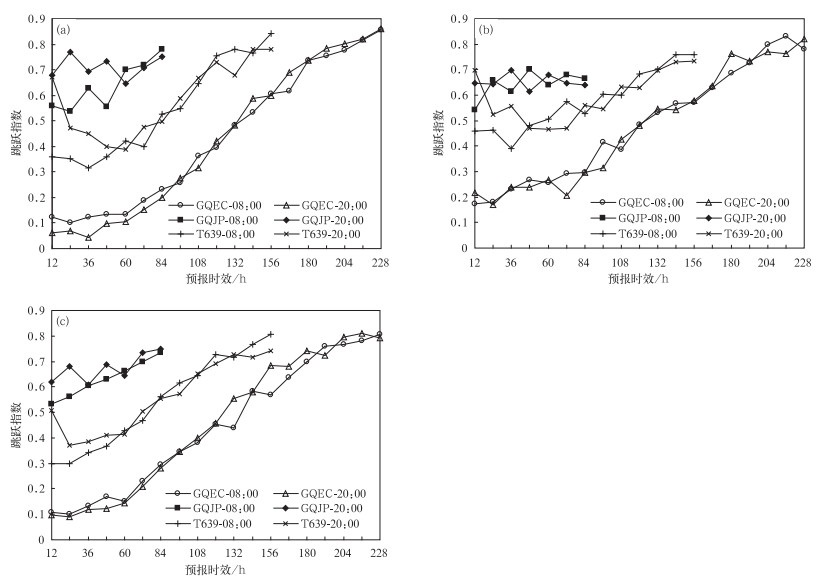
图 7 区域Ⅰ(a)、区域Ⅱ(b)、区域Ⅲ(c)2 m温度预报不同时效跳跃频率
Fig. 7 Jumping frequency of 2 m temperature prediction with different leading times (a)region Ⅰ, (b)region Ⅱ, (c)region Ⅲ
表 1 12 h降水预报跳跃频率
Table 1 Jumping frequency of 12 h precipitation prediction
模式 起报时间 区域Ⅰ 区域Ⅱ 区域Ⅲ GQEC 08:00 0.478 0.481 0.435 20:00 0.481 0.480 0.450 GQJP 08:00 0.627 0.621 0.600 20:00 0.656 0.622 0.605 T639 08:00 0.574 0.547 0.494 20:00 0.563 0.567 0.511  下载: 导出CSV
表 2 2 m温度预报跳跃频率
Table 2 Jumping frequency of 2 m temperature prediction
模式 起报时间 区域Ⅰ 区域Ⅱ 区域Ⅲ GQEC 08:00 0.421 0.466 0.431 20:00 0.415 0.462 0.442 GQJP 08:00 0.635 0.639 0.628 20:00 0.700 0.651 0.657 T639 08:00 0.511 0.542 0.509 20:00 0.549 0.558 0.524
下载: 导出CSV
表 3 区域Ⅰ不同季节多日平均跳跃频率
Table 3 Averaged jumping frequency of different seasons in region Ⅰ
季节 起报时间 GQEC GQJP T639 12 h降水 2 m温度 12 h降水 2 m温度 12 h降水 2 m温度 春季 08:00 0.502 0.405 0.601 0.590 0.574 0.530 20:00 0.501 0.410 0.659 0.670 0.604 0.561 夏季 08:00 0.523 0.484 0.634 0.661 0.613 0.569 20:00 0.541 0.456 0.656 0.721 0.605 0.572 秋季 08:00 0.491 0.413 0.616 0.586 0.616 0.530 20:00 0.487 0.421 0.663 0.693 0.571 0.659 冬季 08:00 0.478 0.410 0.634 0.631 0.601 0.505 20:00 0.470 0.392 0.626 0.652 0.569 0.522
下载: 导出CSV
表 4 2016年6月15—16日暴雨过程逐日平均跳跃指数和跳跃频率
Table 4 Daily Jumpiness index and jumping frequency of rainstorm process from 15 June to 16 Jun in 2016
时段 跳跃指数 跳跃频率 GQEC GQJP T639 GQEC GQJP T639 14日20:00—15日08:00 0.211 0.099 0.267 0.526 0.714 0.615 15日08:00—15日20:00 0.179 0.108 0.295 0.526 0.571 0.538 15日20:00—16日08:00 0.191 0.085 0.293 0.579 0.615 0.714
下载: 导出CSV
表 5 2016年2月13—15日强冷空气个例逐日时间平均跳跃指数和跳跃频率
Table 5 Daily Jumpiness index and jumping frequency of strong cold air process from 13 Feb to 15 Feb in 2016
起报时间 预报时间 跳跃指数 跳跃频率 GQEC GQJP T639 GQEC GQJP T639 20:00 预报14日08:00 0.206 0.082 0.110 0.421 0.714 0.692 08:00 预报14日20:00 0.202 0.165 0.209 0.421 0.714 0.462 20:00 预报15日08:00 0.250 0.097 0.108 0.368 0.571 0.692 08:00 预报15日20:00 0.256 0.126 0.211 0.473 0.429 0.386
下载: 导出CSV
-
[1] 刘梦娟, 陈敏.BJ-RUC系统对北京夏季边界层的预报性能评估.应用气象学报, 2104, 25(2):212-221. http://qikan.camscma.cn/jams/ch/reader/view_abstract.aspx?file_no=20140211&flag=1 [2] 邓国, 龚建东, 邓莲堂, 等.国家级区域集合预报系统研发和性能检验.应用气象学报, 2010, 21(5):513-523. doi: 10.11898/1001-7313.20100501 [3] 谭桂容, 段浩, 任宏利.中高纬度地区500 hPa高度场动力预测统计订正.应用气象学报, 2012, 23(3):304-311. http://qikan.camscma.cn/jams/ch/reader/view_abstract.aspx?file_no=20120306&flag=1 [4] 李博, 赵思雄, 陆汉城, 等.综合多级相似预报技术在暴雨短期预报中的检验.应用气象学报, 2008, 19(3):307-314. doi: 10.11898/1001-7313.20080306 [5] 刘建国, 谢正辉, 赵琳娜, 等.基于多模式集合的小时气温概率预报.大气科学, 2013, 37(1):43-53. doi: 10.3878/j.issn.1006-9895.2012.11232 [6] 张宏芳, 潘留杰.ECMWF、日本高分辨率模式降水预报能力的对比分析.气象, 2014, 40(4):424-432. doi: 10.7519/j.issn.1000-0526.2014.04.004 [7] 陈静, 陈德辉, 颜宏.集合数值预报的发展与研究进展.应用气象学报, 2002, 13(4):497-507. http://qikan.camscma.cn/jams/ch/reader/view_abstract.aspx?file_no=20020465&flag=1 [8] 林春泽, 智协飞, 韩艳, 等.基于TIGGE资料的地面气温多模式超级集合预报.应用气象学报, 2009, 20(6):706-712. doi: 10.11898/1001-7313.20090608 [9] 况雪源, 刘健, 王红丽, 等.近千年来中国区域降水模拟与重建资料的对比分析.地球科学进展, 2009, 24(2):159-171. http://www.adearth.ac.cn/CN/abstract/abstract913.shtml [10] Wang Bin, Xie Xin, Li Lijuan.A review on aspects of climatesimulation assessment.Adv Atmos Sci, 2009, 26(4):736-747. doi: 10.1007/s00376-009-9038-y [11] 刘彦华, 张述文, 毛璐, 等.评估两类模式对陆面状态的模拟和估算.地球科学进展, 2013, 28(8):913-922. http://www.cqvip.com/QK/94287X/201308/46811307.html [12] 李佴平, 智协飞.ECMWF模式地面气温预报的四种误差订正方法的比较研究.气象, 2012, 38(8):897-902. doi: 10.7519/j.issn.1000-0526.2012.08.001 [13] 陈海山, 孙照渤.陆面模式CLSM的设计及性能检验Ⅱ.模式检验.大气科学, 2005, 29(2):272-282. https://www.wenkuxiazai.com/doc/d0579e48e45c3b3567ec8b3f-2.html [14] 潘留杰, 张宏芳, 朱伟军, 等.ECMWF模式对东北半球气象要素场预报能力的检验.气候与环境研究, 2013, 18(1):112-123. http://www.cnki.com.cn/Article/CJFDTotal-QHYH201301013.htm [15] 陈官军, 魏凤英, 巩远发.NCEP_CFS模式对东亚夏季延伸预报的检验评估.应用气象学报, 2010, 21(6):659-669. doi: 10.11898/1001-7313.20100603 [16] Persson A, Riddaway B.Increasing trust in medium-range weather forecasts.ECMWF Newsletter, 2011, 129:8-12. [17] Hoffman R, Kalnay E.Lagged average forecasting, an alternative to Monte Carlo forecasting.Tellus, 1983, 35:100-118. doi: 10.3402/tellusa.v35i2.11425 [18] Palmer T N, Tibaldi S.On the prediction of forecast skill.Mon Wea Rev, 1988, 116(12):2453-2480. doi: 10.1175/1520-0493(1988)116<2453:OTPOFS>2.0.CO;2 [19] Roebber P J.Variability in successive operational model forecasts of maritime cyclogenesis.Wea Forecasting, 1990, 5(4):586-595. doi: 10.1175/1520-0434(1990)005<0586:VISOMF>2.0.CO;2 [20] Hamill T M.Evaluating forecasters' rules of thumb:A study of d(prog)/dt.Wea Forecasting, 2003, 18(5):933-937. doi: 10.1175/1520-0434(2003)018<0933:EFROTA>2.0.CO;2 [21] Persson A, Grazzini F.User Guide to ECMWF Forecast Products.Reading, United Kingdom:ECMWF, 2007. [22] Pappenberger F, Bogner K, Wetterhall F, et al.Forecast convergence score:A forecaster's approach to analyzing hydro-meteorological forecast systems.Adv Geosci, 2011, 29:27-32. doi: 10.5194/adgeo-29-27-2011 [23] Persson A.User Guide to ECMWF Forecast Products.Reading, United Kingdom:ECMWF, 2011:1-127. [24] Pappenberger F, Cloke H L, Persson A, et al.HESS opinions "on forecast (in) consistency in a hydro-meteorological chain:curse or blessing?".Hydrol Earth Syst Sci, 2011, 15:2391-2400. doi: 10.5194/hess-15-2391-2011 [25] Zsoter E, Buizza R, Richardson D."Jumpiness" of the ECMWF and Met Office EPS control and ensemble-mean forecasts.Mon Wea Rev, 2009, 137(11):3823-3836. doi: 10.1175/2009MWR2960.1 [26] Ehret U.Convergence index:A new performance measure for the temporal stability of operational rainfall forecasts.Meteorologische Zeitschrift, 2010, 19(5):441-451. doi: 10.1127/0941-2948/2010/0480 [27] Lashley S L, Fisher L, Simpson B J, et al.Observing Verification Trends and Applying a Methodology to Probabilistic Precipitation Forecasts at a National Weather Service Forecast Office.Preprints, 19th Conf on Probability and Statistics, New Orleans, LA, Am Meteorol Soc, 2008. http://citeseerx.ist.psu.edu/viewdoc/bookmark?doi=10.1.1.548.3980&site=connotea [28] 郭换换, 智协飞, 段明铿, 等.数值天气预报中的不一致性问题综述.气象科学, 2016, 36(1):134-140. http://www.cqvip.com/QK/96342X/201601/668556328.html [29] 郭换换, 段明铿, 智协飞, 等.基于TIGGE资料的预报跳跃性特征.应用气象学报, 2016, 27(2):220-229. http://qikan.camscma.cn/jams/ch/reader/view_abstract.aspx?file_no=20160210&flag=1 -

 点击查看大图

计量
- 摘要浏览量: 2817
- HTML全文浏览量: 1292
- PDF下载量: 223
- 被引次数: 0
