
 设为首页
设为首页 加入收藏
加入收藏

Simulations of Aerosol Influences on the East Asian Winter Monsoon
-
摘要: 利用NCAR/UCAR CAM5.1模式研究气溶胶对东亚冬季风的影响。模式从1991—2010年运行20年,取2001—2010年冬季的结果。模式结果可以较好地再现东亚冬季风的主要特征。试验结果表明:气溶胶增加使我国东南部地区和东北亚地区(35°~55°N,115°~150°E)冬季风减弱,同时,造成我国东南部地区降水减少。其中,热源热汇的变化和无辐散风减弱为主要原因。气溶胶增加改变了大气热源的分布,造成在我国东南部地区热源减弱,热汇加强;我国东北地区热汇减弱,日本列岛热源加强;气溶胶增加使这些区域全位能的产生减弱,消耗加强。同时,凝结潜热的变化主要影响热源和热汇,其中大尺度过程产生的凝结潜热变化起主要作用。在我国东南部和东北亚地区辐散风动能向全位能的转换增加,造成辐散风减弱。故该区域辐散风向无辐散风的转换减弱,导致无辐散风减弱,最终造成东亚冬季风减弱。Abstract: As the most active circulation system in the northern hemisphere in winter, the east Asian winter monsoon has an important influence on weather and climate in east Asia. In recent years, the concentration of aerosol keeps increasing, and the east Asian winter monsoon is influenced by its change. Numerical simulation experiments are carried out to study the influence using NCAR/UCAR CAM5.1 model, adopting the aerosol emission source of years of 2000 and 1850 each, and models are run from 1991 to 2010 for 20 years. Results from 2001 to 2010 in winter are analyzed.It is found that the increase of aerosols reduces the winter monsoon in the southeastern China and northeastern Asia (35°-55°N, 115°-150°E). At the same time, causing precipitation to reduce and temperature to drop in the southeastern region of China. The increase of aerosols changes the distribution of atmospheric heat sources, resulting in the heat source on the southeastern region of China weakened, and heat sinks strengthened; heat sinks in the northeastern China are weakened and heat sources on Japan Islands are strengthened. The production of potential energy is weakened, and the consumption is enhanced. Another result is that the change of heat source and heat sink is mainly caused by the change of latent heat of condensation, and the change of latent heat generated by large scale process plays a key role. Besides, in the southeastern and northeastern regions of China, the conversion from the divergent wind kinetic energy into the full potential energy increases, resulting in the divergent wind weakening. At the same time, the conversion from the divergent wind into the non-divergent wind in this area is weakened, causing the weakening of the non-divergent wind, and finally resulting in the weakening of east Asian winter monsoon. Through direct and indirect climate effects, aerosol affects heat balance and precipitation, changes the distribution of atmospheric heat sources and thermal structures, leading to changes in the full potential energy and kinetic energy as well as the transformation between them, and ultimately causing the weakening of the east Asian winter monsoon. The impact of aerosol increase on east Asian winter monsoon cannot be ignored.
-
Key words:
- aerosol;
- CAM5;
- east Asian winter monsoon
-

图 1 2001—2010年冬季平均地表黑碳、硫酸盐浓度
(a)试验A黑碳(单位:10-10 kg·kg-1), (b)试验B黑碳(单位:10-10 kg·kg-1), (c)试验A硫酸盐(单位:10-9 kg·kg-1), (d)试验B硫酸盐(单位:10-9 kg·kg-1)
Fig. 1 The surface concentration of black carbon and sulfate in winter average from 2001 to 2010
(a)black carbon from experiment A(unit:10-10 kg·kg-1), (b)black carbon from experiment B(unit:10-10 kg·kg-1), (c)sulfate from experiment A(unit:10-9 kg·kg-1), (d)sulfate from experiment B(unit:10-9 kg·kg-1)

图 2 2001—2010年冬季不同要素分布
(a)再分析资料的大气热源(填色),(b)试验A的大气热源(填色),(c)再分析资料的降水率(填色)和925 hPa风场(矢量),(d)试验A的降水率(填色)和925 hPa风场(矢量),(e)再分析资料的925 hPa温度(填色), (f)试验A的925 hPa温度(填色)
Fig. 2 Distributions of different elements in winter from 2001 to 2010
(a)atmospheric heat source by reanalysis data(the shaded), (b)atmospheric heat source by experiment A(the shaded), (c)precipitation(the shaded) and 925 hPa wind field(the vector) by reanalysis data, (d)precipitation(the shaded) and 925 hPa wind field(the vector) by experiment A, (e)925 hPa temperature by reanalysis data(the shaded), (f)925 hPa temperature by experiment A(the shaded)

图 3 2001—2010年冬季试验A与试验B基本要素差值
(打点部分表示达到0.005显著性水平)(a)925 hPa风场(矢量),(b)降水率(填色),(c)925 hPa无辐散风(矢量),(d)地表温度(填色)
Fig. 3 Results of experiment A minus experiment B in winter from 2001 to 2010
(dots denote passing the test of 0.005 level)(a)925 hPa wind field(the vector), (b)precipitation(the shaded), (c)925 hPa rotational wind(the vector), (d)surface temperature(the shaded)
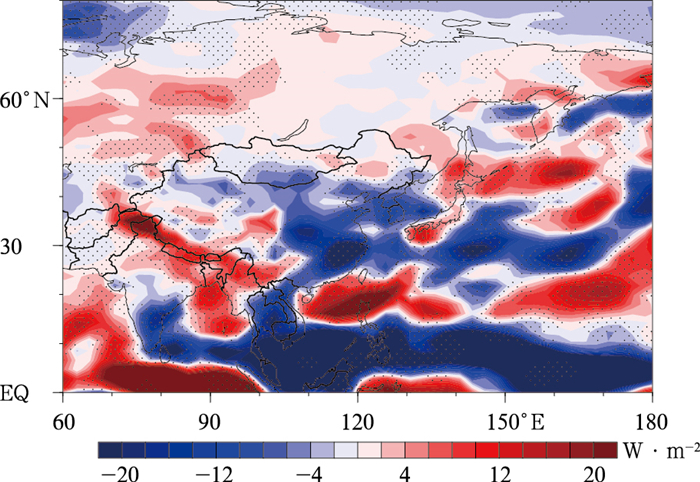
图 4 2001—2010年冬季试验A与试验B大气热源差值
(打点部分表示达到0.005显著性水平)
Fig. 4 The atmospheric heat source difference(the shaded) between experiment A and experiment B in winter from 2001 to 2010
(dots denote passing the test of 0.005 level)

图 5 2001—2010年冬季试验A与试验B大气热源计算分量差值(打点部分表示达到0.005显著性水平)
(a)长波辐射加热率, (b)短波辐射加热率, (c)凝结潜热加热率, (d)地表感热通量输送
Fig. 5 Component differences of atmospheric heat source between experiment A and experiment B in winter from 2001 to 2010(dots denote passing the test of 0.005 level)
(a)long wave heating rate, (b)short wave heating rate, (c)condensation latent heating rate, (d)surface sensible heating rate
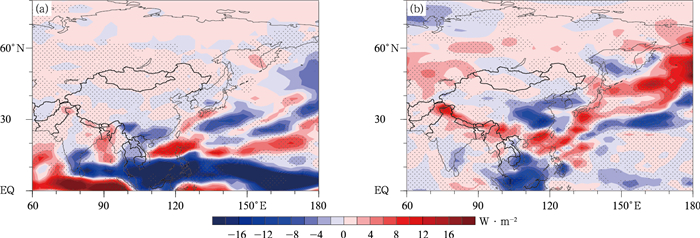
图 6 2001—2010年冬季试验A与试验B凝结潜热加热率差值(打点部分表示达到0.005显著性水平)
(a)对流过程, (b)大尺度过程
Fig. 6 Differences of condensation latent heating rate between experiment A and experiment B in winter from 2001 to 2010(dots denote passing the test of 0.005 level)
(a)convective process, (b)large-scale process

图 7 2001—2010年冬季925 hPa全位能向辐散风转换项(打点部分表示达到0.005显著性水平)
(a)试验A, (b)试验A与试验B差值
Fig. 7 The total potential energy conversion to divergent wind at 925 hPa in winter from 2001 to 2010 (dots denote passing the test of 0.005 level)
(a)experiment A, (b)experiment A minus experiment B

图 8 2001—2010年冬季925 hPa辐散风向无辐散风的转换项(打点部分表示达到0.005显著性水平)
(a)试验A(单位: 10-5 m2·s-3), (b)试验A与试验B差值(单位:10-5 m2·s-3)
Fig. 8 The interaction between divergent wind and rotational wind at 925 hPa in winter from 2001 to 2010(dots denote passing the test of 0.005 level)
(a)experiment A(unit:10-5 m2·s-3), (b)experiment A minus experiment B(unit:10-5 m2·s-3)
-
[1] 施晓晖, 徐祥德.东亚冬季风年代际变化可能成因的模拟研究.应用气象学报, 2007, 18(6):776-782. doi: 10.11898/1001-7313.200706119 [2] 朱乾根, 林锦瑞, 寿绍文.天气学原理与方法.北京:气象出版社, 2000:565-577. http://www.doc88.com/p-0734738081643.html [3] 陈隆勋, 张博.东亚季风研究的进展.应用气象学报, 2006, 17(6):711-724. doi: 10.11898/1001-7313.20060609 [4] 徐建军, 朱乾根.近百年东亚冬季风的突变性和周期性.应用气象学报, 1999, 10(1):1-8. http://qikan.camscma.cn/jams/ch/reader/view_abstract.aspx?file_no=19990140&flag=1 [5] 张小曳, 孙俊英, 王亚强, 等.我国雾-霾成因及其治理的思考.科学通报, 2013, 58(13):1178-1187. http://www.doc88.com/p-7714792571420.html [6] 宋刘明, 刘煜, 朱彬, 等.对流层气溶胶的直接气候效应对平流层的影响.应用气象学报, 2014, 25(1):83-94. doi: 10.11898/1001-7313.20140109 [7] 杨东贞, 房秀梅, 李兴生.我国北方沙尘暴变化趋势的分析.应用气象学报, 1998, 9(3):352-358. http://qikan.camscma.cn/jams/ch/reader/view_abstract.aspx?file_no=19980350&flag=1 [8] 徐祥德, 丁国安, 卞林根.北京城市大气环境污染机理与调控原理.应用气象学报, 2006, 17(6):815-828. doi: 10.11898/1001-7313.20060618 [9] Liu Y, Sun J, Yang B.The effects of black carbon and sulfate aerosols in China regions on East Asia monsoons.Tellus B, 2009, 61(4):642-656. doi: 10.1111/j.1600-0889.2009.00427.x [10] 邓洁淳, 徐海明, 马红云, 等.中国东部地区人为气溶胶对东亚冬、夏季风的影响——一个高分辨率大气环流模式的模拟研究.热带气象学报, 2014, 30(3):567-576. http://mall.cnki.net/magazine/Article/RDQX201403018.htm [11] 蒋益荃.人为气溶胶排放增加对东亚气候影响的数值模拟研究.南京:南京大学, 2013, [12] 吴国雄, 李占清, 符淙斌, 等.气溶胶与东亚季风相互影响的研究进展.中国科学(地球科学), 2015, 45(11):1609-1627. http://earth.scichina.com:8080/sciD/CN/Y2015/V45/I11/1609 [13] Li Z, Lau W K, Ramanathan V, et al.Aerosol and monsoon climate interactions over Asia.Rev Geophys, 2016, 54:866-929. doi: 10.1002/2015RG000500 [14] 黄伟, 沈新勇, 黄文彦, 等.亚洲地区人为气溶胶对东亚冬季风影响的研究.气象科学, 2013, 33(5):500-509. doi: 10.3969/2013jms.0047 [15] 王为德, 缪锦海.东亚寒潮中物理过程的初步分析//全国寒潮中期预报文集.北京:北京大学出版社, 1984:53-63. [16] 仇永炎, 朱亚芬.关于寒潮中期过程的正压能量学的统计研究//全国寒潮中期预报文集.北京:北京大学出版社, 1984:41-52. [17] Ding Y H, Krishnamurti T N.Heat budget of the Siberian high and the winter monsoon.Mon Wea Rev, 1987, 115:2428-2449. doi: 10.1175/1520-0493(1987)115<2428:HBOTSH>2.0.CO;2 [18] 郭增元, 刘煜, 李维亮.气溶胶影响亚洲夏季风机理的数值研究.气象学报, 2017, 75(5):797-810. doi: 10.11676/qxxb2017.057 [19] 马岚, 吴晓京, 江吉喜, 等.2001年夏季风活动与我国南方暴雨某些特征的分析.应用气象学报, 2003, 14(4):445-451. http://qikan.camscma.cn/jams/ch/reader/view_abstract.aspx?file_no=20030455&flag=1 [20] 李鑫, 刘煜.CAM5模式中两气溶胶模块的评估.应用气象学报, 2013, 24(1):75-86. doi: 10.11898/1001-7313.20130108 [21] Yanai M, Esbensen S, Chu J H.Determination of bulk properties of tropical cloud clusters from large-scale heat and moisture budgets.J Atmos Sci, 1973, 30(4):611-627. doi: 10.1175/1520-0469(1973)030<0611:DOBPOT>2.0.CO;2 [22] Krishnamurti T N, Suhrahmanyam D.The 30 to 50 day mode at 850 mb during MONEX.J A S, 1982, 39:2088-2095. doi: 10.1175/1520-0469%281982%29039<2088%3ATDMAMD>2.0.CO%3B2 [23] 陈隆勋, 朱乾根, 罗会邦, 等.东亚季风.北京:气象出版社, 1995:244-247. [24] 陈玉英, 巩远发, 魏娜.亚洲季风区大气热源汇的气候特征.气象科学, 2008, 28(3):251-257. http://cpfd.cnki.com.cn/Article/CPFDTOTAL-ZGQX200610011063.htm -

 下载:
下载:
 点击查看大图
计量
- 摘要浏览量: 4173
- HTML全文浏览量: 1273
- PDF下载量: 210
- 被引次数: 0
