
 设为首页
设为首页 加入收藏
加入收藏

Comparison of Brightness Temperature of Multi-type Ground-based Microwave Radiometers
-
摘要: 目前,国内外对于地基微波辐射计的探测能力多从温湿廓线等二级产品级进行考察,其误差包含反演算法和硬件系统两部分的贡献,不易区分。为直接考察硬件系统的观测性能,试验将评估对象前移,直接对一级亮温数据进行比对分析。利用2016年1月-2018年3月中国气象局大气探测试验基地4台地基微波辐射计和业务探空的同址观测数据,以探空数据输入MonoRTM辐射传输模型得到的正演亮温为参考,考察不同天气、不同季节微波辐射计的探测准确性。结果表明:国产与进口设备观测亮温的准确性相当。4台地基微波辐射计实测亮温与模拟亮温相关性较好,相关系数基本超过0.9,均达到0.001显著性水平。晴空条件下,实测亮温较模拟亮温均方根误差平均为2.08~3.75 K;德国辐射计亮温偏差最小,各通道平均偏差为1.08 K,均方根误差平均为2.08 K。亮温偏差在冬季最小,夏季达到最大。建议提高定标准确度并进行质量控制以确保亮温准确性,谨慎使用降水期间辐射计的观测数据。Abstract: Ground-based microwave radiometer (MWR) can detect temperature and humidity profiles continuously and steadily, which compensate the shortcoming of the conventional sounding because of the long observation time interval. As a result, it is very helpful to explore the thermal process evolution of meso-scale synoptic system. At present, many types of ground-based MWR are developed at home and abroad. They are of different technical systems and their suitability for wide operational use is much concerned in scientific research institutions and management departments.The error of MWR product includes the contribution of both algorithm and hardware system, which is hard to distinguish. Therefore, to evaluate the observation performance of hardware system of the MWR, the brightness temperature of MWR is directly compared in this experiment. Using observations of 4-type radiometers and operational sounding data at the testbed of China Meteorological Adminatration from January 2016 to March 2018, and the simulated brightness temperature based on forward calculation from sounding data of MonoRTM as the reference, the accuracy of radiometers in different weather and seasons is compared and analyzed.Results show that the accuracy of brightness temperature of the domestic radiometer is similar to that of the imported radiometer. The observed brightness temperature of 4 radiometers are well related with simulated brightness temperature, and correlation coefficients basically are above 0.9, reaching a significant level of 0.001. Under clear sky conditions, the average of mean square root between the observed and simulated brightness temperature of four radiometers is 2.08-3.75 K. And the MWR-G shows the smallest error of brightness temperature, whose average deviation of each channel is 1.08 K, and the root mean square error is 2.08 K. The brightness temperature errors are minimum in winter and maximum in summer. Under precipitation conditions, the effectiveness of the brightness temperature observation of MWR is obviously reduced.Certainly, there are also some errors in sounding data itself. And it is difficult to completely avoid the drifting problem of sounding balloon, although a variety of ground-based remote sensing methods are used to assist the identification. It suggests to develop and apply calibration system with high accuracy and high stability, to ensure the accurate measurement of the radiometer. In addition, best observation mode of MWR during precipitation, and the material selection, replacement and maintenance of the radome need to be tested and verified, to expand the effective detection range of MWR.
-
Key words:
- microwave radiometer;
- error analysis;
- sounding;
- brightness temperature;
- MonoRTM
-
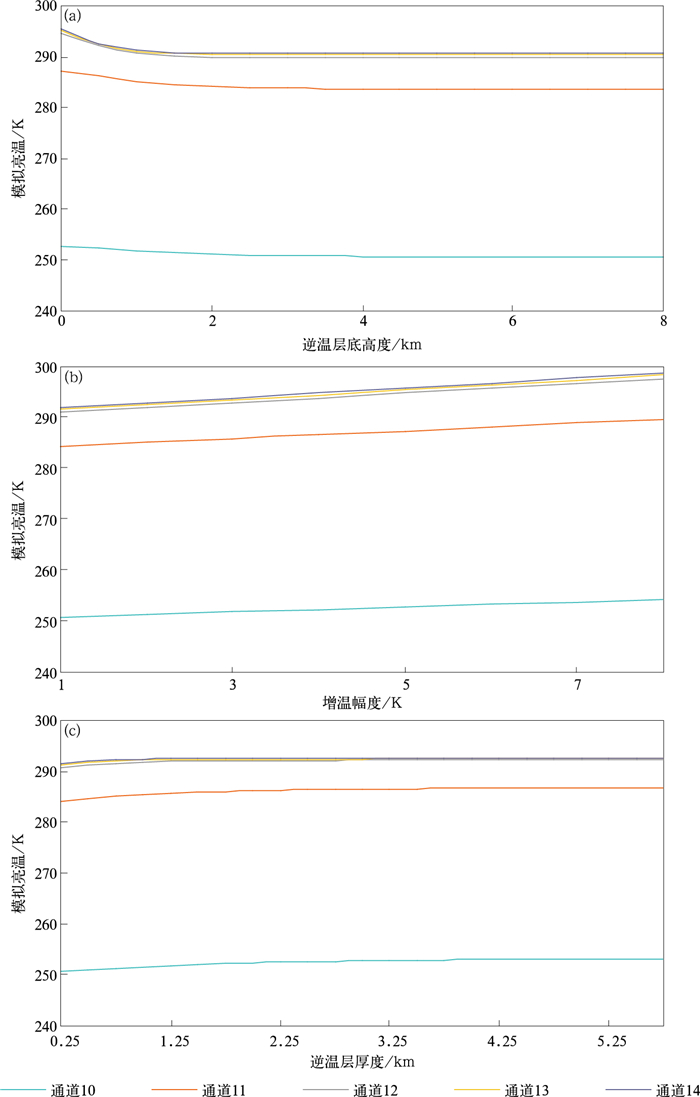
图 2 逆温层高度、厚度及增温幅度变化对模拟亮温的影响
(a)增温幅度5 K,逆温层厚度2 km,(b)逆温层底高度0,逆温层厚度2 km,(c)增温幅度5 K,逆温层底高度0.5 km
Fig. 2 Effects of height and thickness of inversion layer with temperature increasing range on simulated brightness temperature
(a)increasing range is 5 K, inversion layer thickness is 2 km, (b)inversion layer bottom height is 0, inversion layer thickness is 2 km, (c)temperature increasing range is 5 K, inversion layer bottom height is 0.5 km
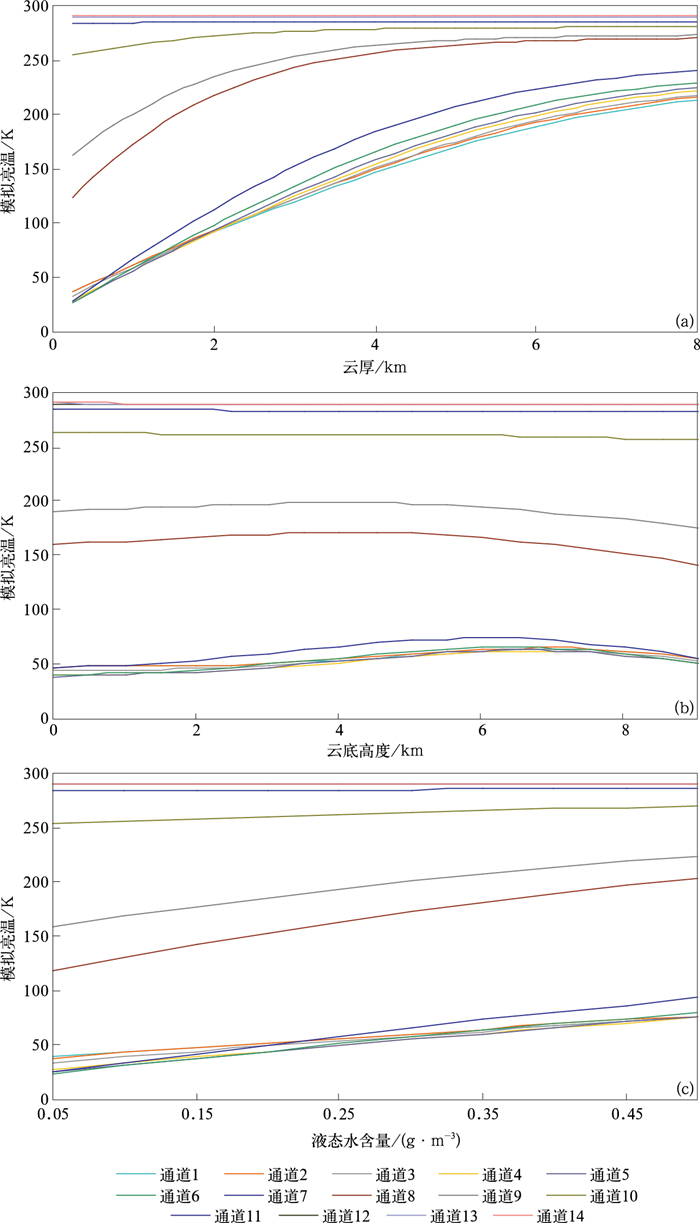
图 3 云厚、云高、液态水含量变化对模拟亮温结果的影响
(a)云高2 km,液态水含量0.3 g·m-3,(b)云厚1 km,液态水含量0.3 g·m-3,(c)云厚1 km,云底高度2 km
Fig. 3 Effects of cloud thickness, cloud height and liquid water content on simulated brightness temperature
(a)cloud height is 2 km, liquid water content is 0.3 g·m-3, (b)cloud thickness is 1 km, liquid water content is 0.3 g·m-3, (c)cloud thickness is 1 km, cloud bottom height is 2 km
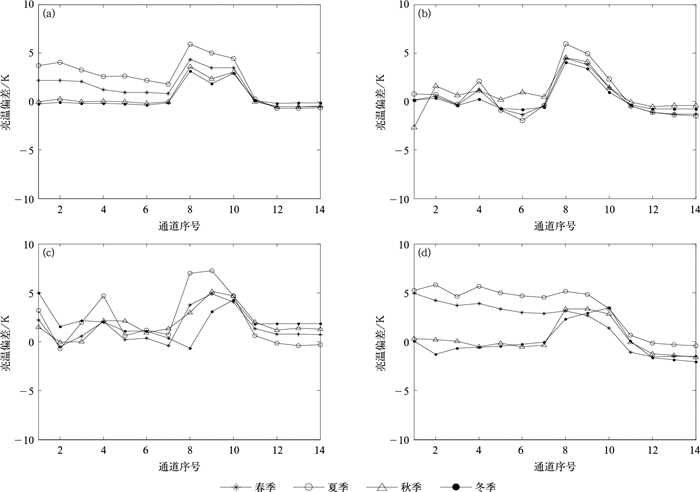
图 4 不同季节辐射计亮温偏差
(a)MWR-G,(b)MWR-A,(c)MWR-C1,(d)MWR-C2
Fig. 4 Brightness temperature error of radiometers in different seasons
(a)MWR-G, (b)MWR-A, (c)MWR-C1, (d)MWR-C2
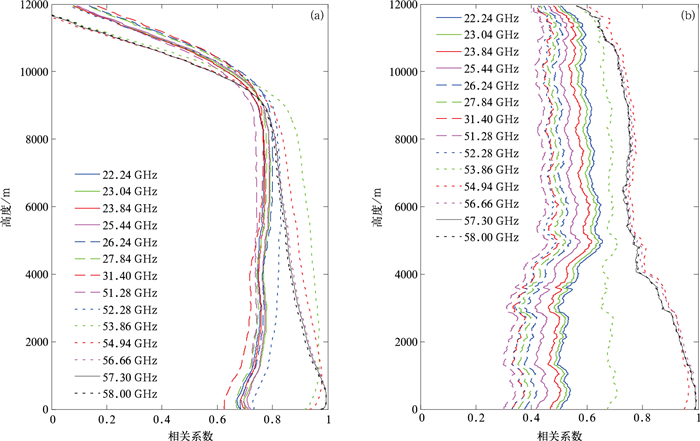
图 5 MWR-C1辐射计亮温与探空温度廓线相关系数
(a)非降水条件,(b)降水条件
Fig. 5 Correlation between brightness temperature of MWR-C1 and sounding temperature profile
(a)non-precipitation, (b)precipitation
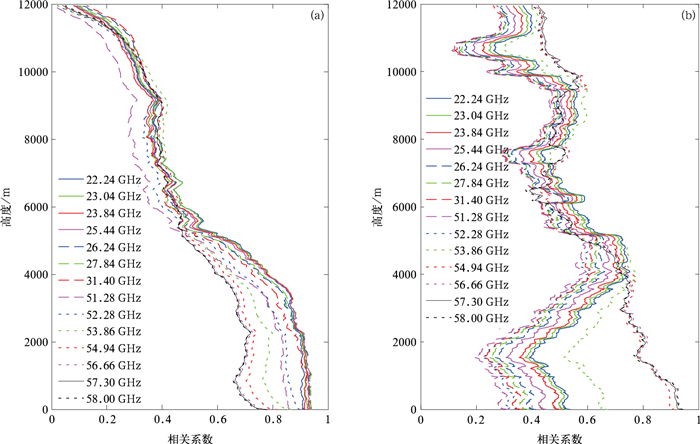
图 6 MWR-C1辐射计亮温与探空水汽密度廓线相关系数
(a)非降水条件,(b)降水条件
Fig. 6 Correlation between brightness temperature of MWR-C1 and sounding water vapor density profile
(a)non-precipitation, (b)precipitation
表 1 参试辐射计的主要性能
Table 1 The main performance of microwave radiometers involved in the test
设备编号 产地 通道数 测量高度/km 接收机技术体制 测量周期 MWR-G 德国 14 0~10 多路直接检波 秒级 MWR-A 美国 22 0~10 超外差本振跳频 分钟级 MWR-C1 中国 22 0~10 超外差本振跳频 分钟级 MWR-C2 中国 16 0~10 多路直接检波 秒级  下载: 导出CSV
表 2 模拟亮温通道中心频率
Table 2 The central frequency of the simulated bright channel
水汽通道序号 中心频率/GHz 氧气通道序号 中心频率/GHz 1 22.24 8 51.26 2 23.04 9 52.28 3 23.84 10 53.86 4 25.44 11 54.94 5 26.24 12 56.66 6 27.84 13 57.30 7 31.40 14 58.00
下载: 导出CSV
表 3 亮温数据异常值剔除情况
Table 3 Abnormity elimination of brightness temperature data
通道序号 MWR-G MWR-A MWR-C1 MWR-C2 剔除样本量 剔除率/% 剔除样本量 剔除率/% 剔除样本量 剔除率/% 剔除样本量 剔除率/% 1 6922 7.24 17637 29.70 11812 15.86 4620 10.48 2 6805 7.12 5072 8.54 9745 13.09 5608 12.73 3 7591 7.94 5009 8.43 10577 14.21 4375 9.93 4 8139 8.51 5679 9.56 8872 11.92 5440 12.35 5 8702 9.10 8287 13.95 5185 6.96 4098 9.30 6 8579 8.97 3993 6.72 6085 8.17 3609 8.19 7 11159 11.67 9417 15.86 5847 7.85 5126 11.63 8 7227 7.56 3760 6.33 7610 10.22 79 0.18 9 6634 6.94 3204 5.40 5334 7.16 113 0.26 10 3680 3.85 1584 2.67 2808 3.77 124 0.28 11 508 0.53 396 0.67 7447 10.00 302 0.69 12 251 0.26 150 0.25 665 0.89 185 0.42 13 275 0.29 635 1.07 511 0.69 70 0.16 14 251 0.26 1037 1.75 450 0.60 41 0.09
下载: 导出CSV
表 4 晴空样本实测亮温与模拟亮温偏差情况(单位:K)
Table 4 Deviation of observed and simulated brightness temperature in clear sky(unit:K)
中心频率/GHz MWR-G MWR-A MWR-C1 MWR-C2 平均偏差 均方根误差 平均偏差 均方根误差 平均偏差 均方根误差 平均偏差 均方根误差 22.24 1.16 3.12 -1.92 4.74 3.63 5.19 2.77 5.24 23.04 1.35 3.04 -0.87 4.82 0.79 2.95 2.30 5.19 23.84 1.05 2.69 -1.61 4.34 1.60 3.32 1.97 4.24 25.44 0.74 1.91 -0.08 2.90 2.82 3.84 1.96 4.26 26.24 0.65 1.76 -1.93 4.15 1.30 1.91 1.83 3.70 27.84 0.49 1.63 -2.21 4.89 1.10 1.64 1.58 3.42 31.40 0.50 1.40 -1.47 3.61 0.70 1.52 1.60 3.18 51.26 4.09 4.36 4.66 4.87 2.89 5.39 4.01 5.13 52.28 2.99 3.38 4.02 4.17 4.90 5.64 3.87 4.68 53.86 3.38 3.50 1.48 1.71 4.48 4.60 2.81 3.73 54.94 0.10 0.44 -0.35 0.70 1.61 2.31 -0.27 2.43 56.66 -0.48 0.66 -0.89 1.07 1.14 1.54 -1.33 2.47 57.30 -0.46 0.67 -0.96 1.24 1.16 1.58 -1.42 2.44 58.00 -0.42 0.64 -1.02 1.27 1.15 1.59 -1.55 2.43
下载: 导出CSV
表 5 有云样本实测亮温与模拟亮温偏差情况(单位:K)
Table 5 Deviation of observed and simulated brightness temperature in cloud samples(unit:K)
中心频率/GHz MWR-G MWR-A MWR-C1 MWR-C2 平均偏差 均方根误差 平均偏差 均方根误差 平均偏差 均方根误差 平均偏差 均方根误差 22.24 0.56 3.43 -1.85 4.59 3.07 5.01 3.17 5.75 23.04 0.72 3.40 -0.03 4.06 0.42 3.53 2.25 5.38 23.84 0.30 3.26 -1.16 3.54 1.14 3.74 1.72 4.43 25.44 -0.18 3.09 -0.03 3.28 2.25 4.06 1.55 4.39 26.24 -0.35 3.17 -1.81 3.99 0.51 3.39 1.27 4.04 27.84 -0.69 3.48 -2.04 4.57 0.22 3.57 0.94 3.87 31.40 -0.93 4.08 -1.89 4.54 -0.46 4.17 0.86 4.16 51.26 2.27 5.85 3.02 5.98 -0.02 6.18 2.23 5.92 52.28 1.56 4.57 2.86 4.98 2.71 5.37 2.50 4.89 53.86 3.06 3.35 1.33 1.86 3.88 4.12 2.58 3.49 54.94 0.14 0.45 -0.31 0.67 2.04 2.65 -0.16 2.24 56.66 -0.43 0.57 -0.72 0.93 1.12 1.45 -1.21 2.26 57.30 -0.42 0.59 -0.74 0.92 1.16 1.48 -1.31 2.23 58.00 -0.38 0.55 -0.99 1.23 1.27 1.63 -1.49 2.21
下载: 导出CSV
表 6 有云样本实测亮温与模拟亮温偏差情况(单位:K)
Table 6 Deviation of observed and simulated brightness temperature in cloud samples(unit:K)
中心频率/GHz MWR-G MWR-A MWR-C1 MWR-C2 平均偏差 均方根误差 平均偏差 均方根误差 平均偏差 均方根误差 平均偏差 均方根误差 22.24 -35.68 70.45 -62.92 76.12 -19.72 51.28 -38.66 58.00 23.04 -39.56 73.98 -66.91 80.20 -25.85 55.73 -41.13 60.97 23.84 -45.00 80.25 -74.45 88.00 -29.19 59.55 -49.26 69.02 25.44 -55.83 91.23 -84.45 98.81 -39.39 66.81 -59.42 80.78 26.24 -60.28 95.69 -92.33 107.09 -44.63 71.42 -66.89 87.45 27.84 -67.74 103.12 -101.39 116.55 -53.34 78.35 -73.29 94.98 31.40 -81.37 115.12 -116.45 131.08 -69.85 91.08 -85.66 107.72 51.26 -71.06 91.68 -90.02 101.08 -63.13 76.34 -154.44 155.22 52.28 -53.67 69.76 -68.09 76.72 -46.22 56.42 -117.24 117.81 53.86 -10.62 16.10 -17.04 19.54 -8.96 12.20 -27.17 27.35 54.94 -0.19 3.37 -2.41 3.26 0.53 2.16 -2.56 3.43 56.66 0.70 2.22 -0.90 1.50 1.06 1.37 0.07 2.05 57.30 0.73 2.18 -0.89 1.60 1.28 1.60 -0.10 1.89 58.00 0.79 2.14 -1.03 1.52 1.15 1.45 -0.11 2.02
下载: 导出CSV
-
[1] Yao Zhigang, Lin Longfu, Chen Hongbin, et al.A scheme for estimating tropical cyclone intensity using AMSU-A data.Adv Atomos Sci, 2008, 25(1):96-106. doi: 10.1007/s00376-008-0096-3 [2] Gao Y, Duan M.Preliminary comparisons of the typical polarized radiative transfer models:Precision and efficiency.J Remote Sens, 2010, 14(5):839-851. http://en.cnki.com.cn/Article_en/CJFDTOTAL-YGXB201005002.htm [3] 周秀骥.大气微波辐射及遥感原理.北京:气象出版社, 1982. [4] Cimini D, Campos E, Ware R, et al.Thermodynamic atmospheric profiling during the 2010 Winter Olympics using ground-based microwave radiometry.IEEE Trans Geosci Remote Sens, 2011, 49(12):4959-4969. doi: 10.1109/TGRS.2011.2154337 [5] Crewell S, Ebell K, Löhnert U.Can liquid water profiles be retrieved from passive microwave zenith observations.Geophys Res Lett, 2009, 36(6):L06803. http://d.old.wanfangdata.com.cn/NSTLQK/NSTL_QKJJ0211022444/ [6] Ware R, Cimini D, Herzegh P, et al.Ground-based Microwave Radiometer Measurements During Precipitation//8th Specialist Meeting on Microwave Radiometry, 2004. [7] Crewell S, Löhnert U.Accuracy of boundary layer temperature profiles retrieved with multi-frequency, multi-angle microwave radiometry.IEEE Trans Geosci Remote Sens, 2007, 45:2195-2201. doi: 10.1109/TGRS.2006.888434 [8] Ware R, Carpenter R, Güldner J, et al.A multichannel radiometric profiler of temperature, humidity, and cloud liquid.Radio Science, 2016, 38(4):44-1-44-13. http://www.wanfangdata.com.cn/details/detail.do?_type=perio&id=91eb3b202eb0ec2c092c73ca8f032e81 [9] Ware R, Cimini D, Campos E, et al.Thermodynamic and liquid profiling during the 2010 Winter Olympics.Atmos Res, 2013, 132-133(10):278-290. http://www.wanfangdata.com.cn/details/detail.do?_type=perio&id=b6d0918fe631ee4393162fa45369c089 [10] Pospichal B, Küchler N, Löhnert U, et al.Calibration of Ground-based Microwave Radiometers-Accuracy Assessment and Recommendations for Network Users.Egu General Assembly Conference, 2016:14776. http://adsabs.harvard.edu/abs/2016EGUGA..1814776P [11] 刘思波, 何文英, 刘红燕, 等.地基微波辐射计探测大气边界层高度方法.应用气象学报, 2015, 26(5):626-635. http://qikan.camscma.cn/jams/ch/reader/view_abstract.aspx?file_no=20150512&flag=1 [12] 姚雯, 马颖, 高丽娜.L波段与59-701探空系统相对湿度对比分析.应用气象学报, 2017, 28(2):218-226. http://qikan.camscma.cn/jams/ch/reader/view_abstract.aspx?file_no=20170209&flag=1 [13] 刘红燕.三年地基微波辐射计观测温度廓线的精度分析.气象学报, 2011, 69(4):719-728. http://www.wanfangdata.com.cn/details/detail.do?_type=perio&id=QK201103344414 [14] 侯叶叶, 刘红燕, 鲍艳松.地基微波辐射计反演水汽密度廓线精度分析.气象科技, 2016, 44(5):702-709. doi: 10.3969/j.issn.1671-6345.2016.05.002 [15] 魏重, 雷恒池, 沈志来.地基微波辐射计的雨天探测.应用气象学报, 2001, 12(增刊Ⅰ):65-72. http://d.old.wanfangdata.com.cn/Periodical/yyqxxb2001z1009 [16] 郭丽君, 郭学良.利用地基多通道微波辐射计遥感反演华北持续性大雾天气温、湿度廓线的检验研究.气象学报, 2015, 73(2):368-381. http://d.old.wanfangdata.com.cn/Periodical/qxxb201502012 [17] 唐英杰, 马舒庆, 杨玲, 等.云底高度的地基毫米波云雷达观测对比.应用气象学报, 2015, 26(6):680-687. http://qikan.camscma.cn/jams/ch/reader/view_abstract.aspx?file_no=20150604&flag=1 [18] 车云飞, 马舒庆, 杨玲, 等.云对地基微波辐射计反演湿度廓线的影响.应用气象学报, 2015, 26(2):193-203. http://qikan.camscma.cn/jams/ch/reader/view_abstract.aspx?file_no=20150207&flag=1 [19] 王志诚, 张雪芬, 茆佳佳, 等.不同天气条件下地基微波辐射计探测性能比对.应用气象学报, 2018, 29(3):282-295. http://qikan.camscma.cn/jams/ch/reader/view_abstract.aspx?file_no=20180303&flag=1 [20] 敖雪, 王振会, 徐桂荣, 等.微波辐射计亮温观测质量控制研究.气象科学, 2013, 33(2):130-137. http://d.old.wanfangdata.com.cn/Periodical/qxkx201302002 [21] 王振会, 曹雪芬, 黄建松, 等.基于气象资料变化特征和辐射传输模式的微波辐射计工作状态分析.大气科学学报, 2014, 37(1):1-8. doi: 10.3969/j.issn.1674-7097.2014.01.001 [22] 李青, 胡方超, 楚艳丽, 等.北京-地基微波辐射计的观测数据一致性分析和订正实验.遥感技术与应用, 2014, 29(4):547-556. http://www.wanfangdata.com.cn/details/detail.do?_type=perio&id=ygjsyyy201404003 [23] 王振会, 李青, 楚艳丽, 等.地基微波辐射计工作环境对K波段亮温观测影响.应用气象学报, 2014, 25(6):711-721. http://qikan.camscma.cn/jams/ch/reader/view_abstract.aspx?file_no=20140607&flag=1 [24] 傅新姝, 谈建国.地基微波辐射计探测资料质量控制方法.应用气象学报, 2017, 28(2):209-217. http://qikan.camscma.cn/jams/ch/reader/view_abstract.aspx?file_no=20170208&flag=1 [25] Turner D D, Clough S A, Liljegren J C, et al.Retrieving liquid water path and precipitable water vapor from the atmospheric radiation measurement (ARM) microwave radiometers.IEEE Trans Geosc Remote Sens, 2007, 45(11):3680-3690. doi: 10.1109/TGRS.2007.903703 [26] 鲍艳松, 钱程, 闵锦忠, 等.利用地基微波辐射计资料反演0~10 km大气温湿廓线试验研究.热带气象学报, 2016, 32(2):163-171. http://d.old.wanfangdata.com.cn/Periodical/rdqxxb201602003 [27] 中国气象局.地面气象观测资料质量控制.北京:气象出版社, 2010. [28] 周毓荃, 欧建军.利用探空数据分析云垂直结构的方法及其应用研究.气象, 2010, 36(11):50-58. doi: 10.7519/j.issn.1000-0526.2010.11.008 -

 点击查看大图

计量
- 摘要浏览量: 3403
- HTML全文浏览量: 1232
- PDF下载量: 207
- 被引次数: 0
