
 设为首页
设为首页 加入收藏
加入收藏

Effects of Low-frequency Oscillation on the Persistent Extreme Precipitation in Sichuan Basin
-
摘要: 利用1981—2016年我国地面气象站降水资料和NCEP/NCAR再分析资料,通过小波分析、合成分析、Butterworth滤波等方法,定义了适用于四川盆地的持续性强降水,对降水和大气15~30 d低频振荡特征进行详细分析,可为该地延伸期预报提供参考。结果表明:该地降水具有15~30 d和30~60 d低频振荡特征,其中以15~30 d振荡为主。降水期间各高度层和各纬度带低频系统具有垂直斜压性,在三维空间上相互配合,形成有利于降水产生的低频环流形势。低层和中层南北气流汇合于四川盆地形成辐合区,高层表现为北风南下。低层低纬度气旋在西太平洋生成并逐渐向西北移动至南海、华南,带来暖湿气流,中高纬度贝加尔湖东南侧生成气旋并向东移动至鄂霍次克海附近,加强北风输送。中层中高纬度欧亚大陆低压中心向东南方移动,降水时到达蒙古,并分裂小槽传播至下游,在日本海加强,高压中心紧随其后到达乌拉尔山。降水期间四川盆地上空高层为辐散区,有利于中低层辐合上升运动的维持。Abstract: Based on precipitation data of surface meteorological stations and NCEP/NCAR reanalysis data during 1981-2016, the persistent extreme precipitation is defined for Sichuan Basin, and 15-30-day low-frequency oscillation characteristics of precipitation and atmosphere are analyzed in detail by means of wavelet analysis, synthetic analysis and Butterworth filtering, which provide theoretical basis and reference for extended period forecast.Results show that persistent extreme precipitations in Sichuan Basin are concentrated from June to September, which generally last for 3 days. The precipitation has low-frequency oscillation characteristics of 15-30 days and 30-60 days, and mainly 15-30-day oscillation. During the precipitation, the South Asia high and upper jet form a high-level divergence field, the subtropical high is strong and extends westward, the low pressure in the Lake Baikal and the Sea of Okhotsk extends southward, and the airflow in South China Sea and the airflow in the west side of subtropical high converge and pass northward. During the precipitation, low-frequency systems in each height layer and each latitude cooperate with each other in three-dimension space to form a low-frequency circulation which is favorable for precipitation. The vertical baroclinicity of the low-frequency system is conducive to the accumulation of unstable energy and provides energy conditions for precipitation.In the low-frequency flow field, during the precipitation period, the low-level and middle-level north-south airflows merge into the basin to form a convergence area, and the upper layer appears as a northerly wind. The low-latitude cyclone in the lower layer is generated in the western Pacific Ocean and gradually moves northwestward to the South China Sea to bring warm and humid airflow. The southeast side of the mid-high-latitude Lake Baikal generates a cyclone which then moves eastward to the vicinity of the Okhotsk Sea to enhance the northerly wind transport. The mid-high-latitude Eurasia low-pressure center in the middle layer corresponds to the transverse trough in the polar region of the original field. With the transverse trough turning vertical, the center of the low-pressure moves to the southeast, arriving at Mongolia in precipitation, and splits the small trough to the downstream, strengthening in the Sea of Japan, followed by the high-pressure center to the Ural Mountains. During the precipitation period, the divergence of Sichuan Basin at high-level is positive, which is favorable for the continuous convergence and upward movement at lower and middle layers.
-

图 1 降水合成小波功率谱(实线)
(阴影区表示达到0.05显著性水平,虚线表示边界影响区,横坐标上“0”表示降水开始)
Fig. 1 Composited wavelet power spectrum of persistent extreme precipitation events (the solid line)
(the shaded denotes passing the test of 0.05 level, the dotted line denotes the boundary influence area)
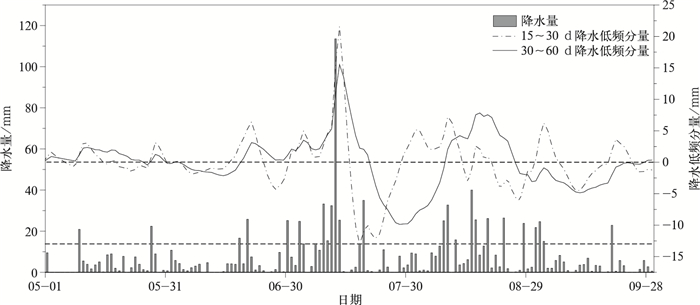
图 2 1981年5—9月四川盆地逐日降水量、15~30 d降水分量及30~60 d降水分量
(下参照线为强降水阈值,上参照线为低频曲线0值)
Fig. 2 Time series of daily precipitation, 15-30-day and 30-60-day precipitation from May to Sep in 1981 in Sichuan Basin
(the lower horizontal line marks the threshold of extreme precipitation, while the upper horizontal line represents the value of 0 for low-frequency components)
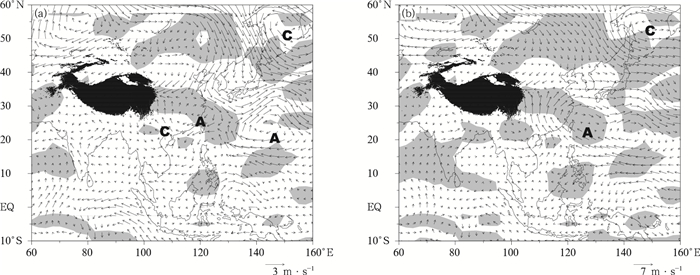
图 3 四川盆地持续性降水期间850 hPa 15~30 d低频风场(a)和滤波前风场(b)
(灰色表示达到0.05显著性水平区域,箭头矢量为距平风场,“A”代表反气旋,“C”代表气旋,黑色表示青藏高原)
Fig. 3 15-30-day wind fields(a) and wind field before filtering(b) at 850 hPa during the persistent extreme precipitation period
(the gray denotes passing the test of 0.05 level, "A" and "C" denote anticyclonic and cyclonic anomalies, and the black denotes the Tibetan Plateau)
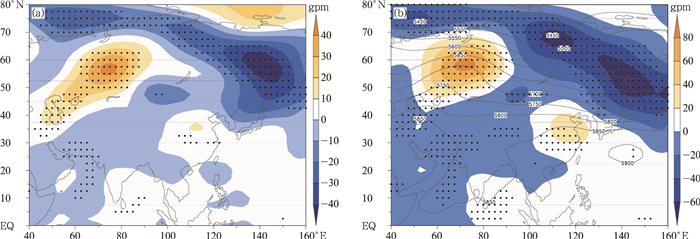
图 4 四川盆地续性降水期间500 hPa 15~30 d低频高度场(a)和滤波前高度场(b)
(填色表示距平;等值线表示滤波前高度,单位:gpm;黑点表示达到0.05显著性水平区域)
Fig. 4 15-30-day geopotential fields(a) and geopotential fields before filtering(b) at 500 hPa during the persistent extreme precipitation period
(the shaded denotes the geopotential anomaly; the contour denotes the original height, unit:gpm; the black dots denote passing the test of 0.05 level)
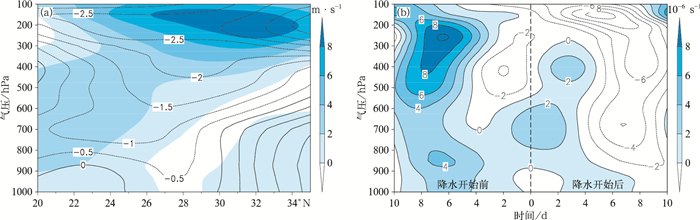
图 5 四川盆地降水期间15~30 d低频风场垂直纬度剖面和涡度垂直剖面
(a)沿102°~105°E平均风场(等值线为经向风分量,正值表示南风,负值表示北风;阴影表示纬向风分量; 单位:m·s-1),(b)28°~34°N,102°~105°E平均涡度场(单位:10-6 s-1)
Fig. 5 Cross-sections of 15-30-day composited wind field and 15-30-day composited vorticity during the period of persistent extreme precipitation events
(a)wind field averaged along 102°-105°E (the contour denotes meridional wind, the positive denotes south wind and the negative denotes north wind; the shaded denotes zonal wind, unit:m·s-1), (b)vorticity field averaged 28°-34°N, 102°-105°E (unit:10-6s-1)
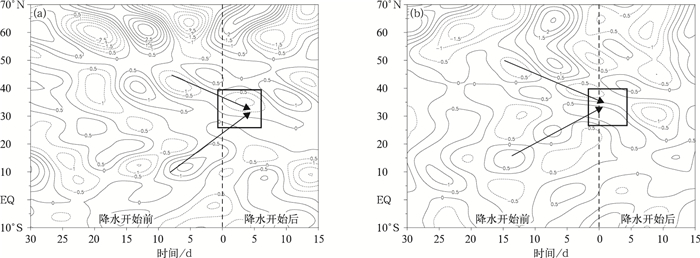
图 6 降水前第30天至降水后第15天850 hPa沿100°E~120°E平均的15~30 d低频风场剖面
(单位:m·s-1,方框为四川盆地降水区, 下同)
(a)纬向风,(b)经向风Fig. 6 Cross-section of 15-30-day wind field along 100°-120°E at 850 hPa from 30 days before precipitation to 15 days after precipitation
(unit:m·s-1, the box denotes the target area of Sichuan Basin, hereinafter)
(a)zonal wind, (b)meridional wind
图 7 降水前第7天至降水后第1天850 hPa合成的15~30 d低频风场演变
(单位:m·s-1, “A”为关键低频反气旋,“C”为关键低频气旋,黑色代表青藏高原)
Fig. 7 Evolution of 15-30-day wind fields at 850 hPa from 7 days before the precipitation to the first day after onset (unit:m·s-1, "A" and "C" denote anticyclonic and cyclonic, respectively, and the black denotes the Tibetan Plateau)
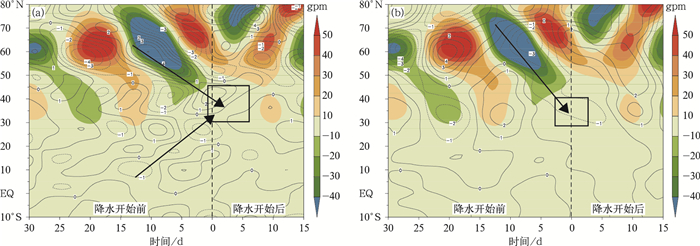
图 8 降水前第30天至降水后第15天500 hPa沿80°~100°E平均的15~30 d位势高度(填色)和风场(等值线, 单位:m·s-1)剖面
(a)位势高度和纬向风,(b)位势高度和经向风
Fig. 8 Cross-section of 15-30-day geopotential height (the shaded) and wind field (the contour, unit:m·s-1) along 80°-100°E at 500 hPa from 30 days before precipitation to 15 days after precipitation
(a)geopotential height and zonal wind, (b)geopotential height and meridional wind
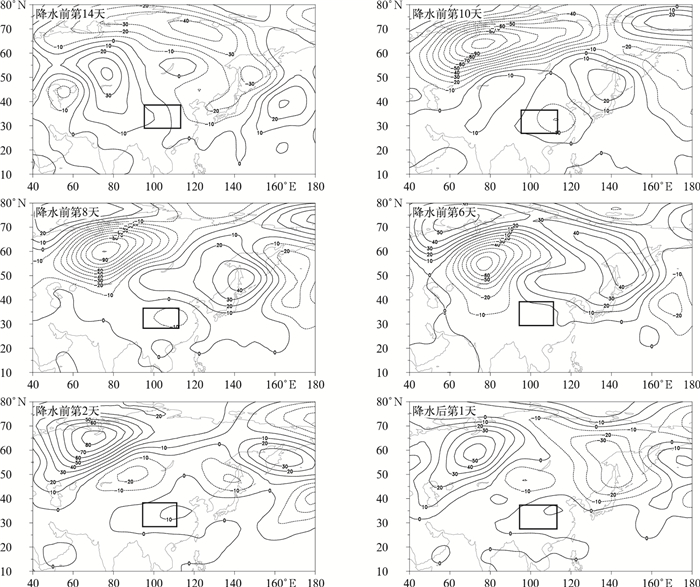
图 9 降水前第14天至降水后第1天500 hPa合成的15~30 d低频高度场(单位:gpm)
Fig. 9 Evolution of 15-30-day geopotential height at 500 hPa from 14 days before the precipitation to the first day after onset (unit:gpm)
表 1 四川盆地持续性强降水个例
Table 1 Persistent extreme precipitation events in Sichuan Basin
发生时间 持续时间/d 1981-07-10—14 5 1981-09-01—03 3 1982-07-08—10 3 1983-07-28—30 3 1984-08-02—04 3 1985-09-11—14 4 1987-06-24—27 4 1988-07-23—26 4 1988-08-11—15 5 1990-08-26—28 3 1992-07-12—14 3 1992-08-01—03 3 1998-07-04—06 3 1999-07-13—15 3 2005-06-30—03 4 2005-08-07—09 3 2008-09-08—10 3 2008-09-23—26 4 2009-09-10—14 5 2010-07-15—17 3 2013-06-19—21 3 2013-07-08—11 4 2014-08-07—09 3  下载: 导出CSV
-
[1] Madden R A, Julian P R.Detection of a 40-50 day oscillation in the zonal wind in the tropical Pacific.J Atmos Sci, 1970, 28:702-708. http://www.wanfangdata.com.cn/details/detail.do?_type=perio&id=0520071205163141 [2] Madden R A, Julian P R.Description of global scale in the tropic with 40-50 day period.J Atmos Sci, 1972, 29:1109-1123. doi: 10.1175/1520-0469(1972)029<1109:DOGSCC>2.0.CO;2 [3] Murakami T, Nakazawa T, He J.On the 40-50 day oscillation during the 1979 Northern Hemisphere summer.Part Ⅰ:Phase propagation.J Meteor Soc Japan, 1984, 62:440-468. doi: 10.2151/jmsj1965.62.3_440 [4] Jiang X A, Li T.Re-initiation of the boreal summer intraseasonal oscillation in the tropical Indian Ocean.J Climate, 2005, 18(18):3777-3795. doi: 10.1175/JCLI3516.1 [5] Wang B, Webster P, Teng H Y.Antecedents and self-induction of active-break South Asian monsoon unraveled by satellites.Geophys Res Lett, 2005, 32(4):24-59. http://www.wanfangdata.com.cn/details/detail.do?_type=perio&id=a0619439b502cdef95543abe2d8f8b71 [6] Qi Y, Zhang R, Li T, et al.Interactions between the summer meanmonsoon and the intraseasonal oscillation in the Indian monsoon region.Geophys Res Lett, 2008, 35(5):134-143. doi: 10.1029/2008GL034517/pdf [7] Qi Yanjun, Zhang Renhe, Zhao Ping, et al.Comparison of the structure and evolution of intraseasonal oscillations before and after onset of the Asian summer monsoon.Acta Meteor Sinica, 2013, 27(5):684-700. doi: 10.1007/s13351-013-0511-2 [8] Li T.Recent advance in understanding the dynamics of the Madden-Julian oscillation.J Meteor Res, 2014, 28(1):1-33. http://www.wanfangdata.com.cn/details/detail.do?_type=perio&id=qxxb-e201401003 [9] 米瑞芝, 牛法宝, 向影, 等.MJO影响下2016年云南首场强降水过程的成因.干旱气象, 2017, 35(2):232-238. http://d.old.wanfangdata.com.cn/Periodical/ghqx201702009 [10] Chatterjee P, Goswami B N.Structure, genesis and scale selection of the tropical quasi-biweekly mode.Quart J Roy Meteor Soc, 2004, 130:1171-1194. doi: 10.1256/qj.03.133 [11] Hsu P C, Li T.Role of the boundary layer moisture asymmetry in causing the eastward propagation of the Madden-Julian Oscillation.J Climate, 2012, 25:4914-4931. doi: 10.1175/JCLI-D-11-00310.1 [12] Lorence A C.The evolution of p1anetary scale 200mb divergence flow during FGGE year.Quart J R Meteor Soc, 1984, 100:427-442. doi: 10.1002/qj.49711046408 [13] 谭桂容, 范艺媛, 牛若芸.江淮地区强降水分型及其环流演变.应用气象学报, 2018, 29(4):396-409. http://qikan.camscma.cn/jams/ch/reader/view_abstract.aspx?file_no=20180402&flag=1 [14] 穆明权, 李崇银.1998年南海夏季风的爆发与大气季节内振荡的活动.气候与环境研究, 2000, 5(4):375-387. http://d.old.wanfangdata.com.cn/Periodical/qhyhjyj200004005 [15] Lin Ailan, Liang Jianyin, Li Chunhui.Characteristics of frequency spectrum variation of intraseasonal oscillation of convection during South China Sea summer monsoon.Journal of Tropical Meteorology, 2006, 12(1):34-40. http://mall.cnki.net/magazine/Article/RQXB200601006.htm [16] 琚建华, 钱诚, 曹杰.东亚夏季风的季节内振荡研究.大气科学, 2005, 29(2):187-194. doi: 10.3878/j.issn.1006-9895.2005.02.03 [17] 琚建华, 刘一伶, 李汀, 等.南海夏季风季节内振荡的年际变化研究.大气科学, 2010, 34(2):253-261. http://d.old.wanfangdata.com.cn/Periodical/daqikx201002002 [18] 陈尚锋, 温之平, 陈文.南海地区大气30~60天低频振荡及其对南海夏季风的可能影响.大气科学, 2011, 35(5):982-992. doi: 10.3878/j.issn.1006-9895.2011.05.17 [19] 毛江玉, 吴国雄.1991年江淮梅雨与副热带高压的低频振荡.气象学报, 2005, 63(5):762-770. doi: 10.3321/j.issn:0577-6619.2005.05.020 [20] Zhu C W, Nakazawa T, Li J P, et al.The 30-60 day intraseasonal oscillation over the western North Pacific Ocean and its impacts on summer flooding in China during 1998.Geophys Res Lett, 2003, 30(18):356-370. http://www.wanfangdata.com.cn/details/detail.do?_type=perio&id=36e4f2596f3bc4439d19a9ad59239df7 [21] 夏芸, 管兆勇, 王黎娟.2003年江淮流域强降水过程与30-70 d低频振荡的联系.南京气象学院学报, 2008, 31(1):33-41. doi: 10.3969/j.issn.1674-7097.2008.01.005 [22] 陆尔, 丁一汇.1991年江淮特大暴雨与东亚大气低频振荡.气象学报, 1996, 54(6):730-736. http://www.wanfangdata.com.cn/details/detail.do?_type=perio&id=QK199600422715 [23] 信飞.1997年华南汛期降水异常与大气低频振荡的关系//第26届中国气象学会年会预测与公共服务分会场论文集.2009. http://www.cnki.com.cn/Article/CJFDTotal-QXXX200712005.htm [24] 胡坚, 陈雪峰.大气季节内低频振荡与华北暴雨过程.气象学报, 1995, 53(1):622-630. doi: 10.3321/j.issn:0577-6619.1995.01.007 [25] Hsu P C, Lee J Y, Ha K J.Influence of boreal summer intraseasonal oscillation on rainfall extremes in southern China.Int J Climatol, 2016, 36(4):1403-1412. http://www.wanfangdata.com.cn/details/detail.do?_type=perio&id=16aa265947bac585d9743ec08e36ba78 [26] 李春晖, 潘蔚娟, 王婷.广东省降水的多尺度时空投影预测方法.应用气象学报, 2018, 29(2):217-231. http://qikan.camscma.cn/jams/ch/reader/view_abstract.aspx?file_no=20180208&flag=1 [27] 史学丽, 丁一汇.1994年中国华南大范围暴雨过程的形成与夏季风活动的研究.气象学报, 2000, 58(6):666-678. doi: 10.3321/j.issn:0577-6619.2000.06.003 [28] 陈官军.中国南方夏季区域持续性强降水与大气季节内振荡.北京:中国气象科学研究院, 2014. http://cdmd.cnki.com.cn/Article/CDMD-85101-1014215178.htm [29] 尹志聪, 王亚非.江淮夏季降水季节内振荡和海气背景场的关系.大气科学, 2011, 35(3):495-505. doi: 10.3878/j.issn.1006-9895.2011.03.10 [30] 韩世茹, 王黎娟, 于波.淮河流域夏季持续性降水与15~30天低频振荡的联系及前期信号.气象与环境科学, 2015, 38(4):22-32. doi: 10.3969/j.issn.1673-7148.2015.04.003 [31] 温之平, 黄荣辉, 贺海晏, 等.中高纬度大气环流异常和低纬30~60天低频对流活动对南海夏季风爆发的影响.大气科学, 2006, 30(5):952-964. doi: 10.3878/j.issn.1006-9895.2006.05.23 [32] 赵华生, 黄小燕, 黄颖.ECMWF集合预报产品在广西暴雨预报中的释用.应用气象学报, 2018, 29(3):344-353. http://qikan.camscma.cn/jams/ch/reader/view_abstract.aspx?file_no=20180308&flag=1 [33] 张博, 金荣花, 赵滨, 等.一个表征江南春雨的环流指数及其天气学特征.应用气象学报, 2018, 29(2):129-140. http://qikan.camscma.cn/jams/ch/reader/view_abstract.aspx?file_no=20180201&flag=1 [34] 赵琳娜, 刘莹, 包红军, 等.基于重组降水集合预报的洪水概率预报.应用气象学报, 2017, 28(5):544-554. http://qikan.camscma.cn/jams/ch/reader/view_abstract.aspx?file_no=20170503&flag=1 [35] 吴洪宝.气候变率诊断和预测方法.北京:气象出版社, 2005. [36] 姚菊香, 王盘兴, 李丽平.季节内振荡研究中两种数字滤波器的性能对比.南京气象学院学报, 2005, 28(2):248-253. doi: 10.3969/j.issn.1674-7097.2005.02.014 [37] 施能, 魏风英, 封国林, 等.气象场相关分析及合成分析中蒙特卡洛检验方法及应用.南京气象学院学报, 1997, 20(3):355-359. http://www.wanfangdata.com.cn/details/detail.do?_type=perio&id=QK199700406800 [38] 庞玥.江淮流域梅雨期持续性降水与10-30 d低频振荡的关系及其前期信号研究.南京:南京信息工程大学, 2013. [39] 闵屾, 钱永甫.中国极端降水事件的区域性和持续性研究.水科学进展, 2008, 19(6):763-771. doi: 10.3321/j.issn:1001-6791.2008.06.001 [40] 陈思, 高建芸, 黄丽娜, 等.华南前汛期持续性暴雨年代际变化特征及成因.应用气象学报, 2017, 28(1):86-97. http://qikan.camscma.cn/jams/ch/reader/view_abstract.aspx?file_no=20170108&flag=1 [41] 甘衍军, 徐晶, 赵平, 等.暴雨致洪预报系统及其评估.应用气象学报, 2017, 28(4):385-398. http://qikan.camscma.cn/jams/ch/reader/view_abstract.aspx?file_no=20170401&flag=1 [42] 陈官军, 魏凤英.基于低频振荡特征的夏季江淮持续性降水延伸期预报方法.大气科学, 2012, 36(3):633-644. http://d.old.wanfangdata.com.cn/Periodical/daqikx201203015 [43] 钟利华, 曾鹏, 史彩霞, 等.西江流域面雨量与区域大气环流型关系.应用气象学报, 2017, 28(4):470-480. http://qikan.camscma.cn/jams/ch/reader/view_abstract.aspx?file_no=20170408&flag=1 [44] 王黎娟, 庞玥, 于波, 等.江淮流域梅雨期持续性强降水及其10~30 d低频环流特征.热带气象学报, 2014, 30(5):851-860. doi: 10.3969/j.issn.1004-4965.2014.05.005 -

 点击查看大图
计量
- 摘要浏览量: 4170
- HTML全文浏览量: 1310
- PDF下载量: 175
- 被引次数: 0
