
 设为首页
设为首页 加入收藏
加入收藏

Characteristics of PM2.5 in Heavy Pollution Events in Beijing and Surrounding Areas from November to December in 2016
-
摘要: 该文对2016年11—12月北京及周边地区不同站点重污染期间PM2.5质量浓度变化特征进行分析,并结合地面和探空气象要素及化学组分等对重污染成因进行深入探讨,比较了其中两次持续3 d及以上重污染过程的异同。结果表明:重污染期间北京及周边地区PM2.5质量浓度较高,北京上甸子站、顺义站、朝阳站的PM2.5质量浓度分别为73.1,130.8,226.0 μg·m-3,河北保定站和石家庄站分别为357.8 μg·m-3和346.9 μg·m-3。12月17—21日重污染过程比11月3—5日持续时间更长且PM2.5质量浓度更高。通过对11—12月所有重污染过程分析发现,北京颗粒物重污染发生的主要气象条件是静稳天气。在排放源相对稳定情况下,逆温层的结构、演变和持续时间决定了重污染的程度,其中污染持续时间和污染期间的主导逆温层类型演变对重污染程度有较好的指示作用。较低的水平风速、逆温层的持续出现及更多的燃煤和机动车尾气排放是12月17—21日污染偏重的原因。Abstract: PM2.5 and PM10 mass as well as meteorological data at six stations in Beijing and Hebei Province are analyzed to investigate characteristics of heavy pollution processes from November to December of 2016. Results show that PM2.5 concentrations are 73.1, 130.8 μg·m-3 and 226.0 μg·m-3 at Shangdianzi, Shunyi and Chaoyang stations in Beijing during the heavy pollution, which are lower than those measured at Baoding and Shijiazhuang stations in Hebei (357.8 μg·m-3 and 346.9 μg·m-3, respectively). The average concentration of PM2.5 for the heavy haze days is 3-4 times of that in clean days at all six stations, with the haze accompanied by calm wind, high humidity, and other adverse weather conditions. Observations indicate most pollution cases last longer in Hebei than those in Beijing, which is probably caused by intensified emissions from industry in Shijiazhuang. In addition, the sulfur dioxide, nitrogen oxides and particulate matter discharged from Shijiazhuang and Baoding are blocked by the Taihang Mountains, which make pollutants easy to accumulate in this area.The daily average air quality index (AQI) during heavy pollution events has a complex relationship with the type, strength, duration and thickness of the inversion layer. Meanwhile, it has good consistency with the duration of the inversion both before and after the heating period in Beijing. The analysis of sounding data indicates that the atmospheric boundary layer also plays an important role in the accumulation of pollutants. Comparing with inversion at higher level, the inversion near the ground has significantly greater suppression effects on the diffusion. The pollution case from 17 December to 21 December lasts 5 days and PM2.5 mass concentrations are higher than the case from 3 November to 5 November in 2016. It suggests that the vertical diffusion of pollutants is suppressed for longer time and contaminants accumulate on the ground with the temperature inversion. On the other hand, the horizontal wind speed is lower, and pollutants cannot spread horizontally which aggravate pollution. Concentrations of OC and EC in PM10 at Gucheng in Hebei in two cases are also significantly different. Much higher OC, EC and OC/EC concentrations on 22 December are observed than on 3 November 2016, which may indicate more automobile exhaust and coal combustion in this heavy pollution event. The continuous appearance of the inversion layer, lower horizontal wind speed and more coal combustion and vehicle exhaust emissions are the main causes for this heavy pollution process.
-
Key words:
- Beijing and surrounding areas;
- aerosols;
- haze;
- different types of stations
-
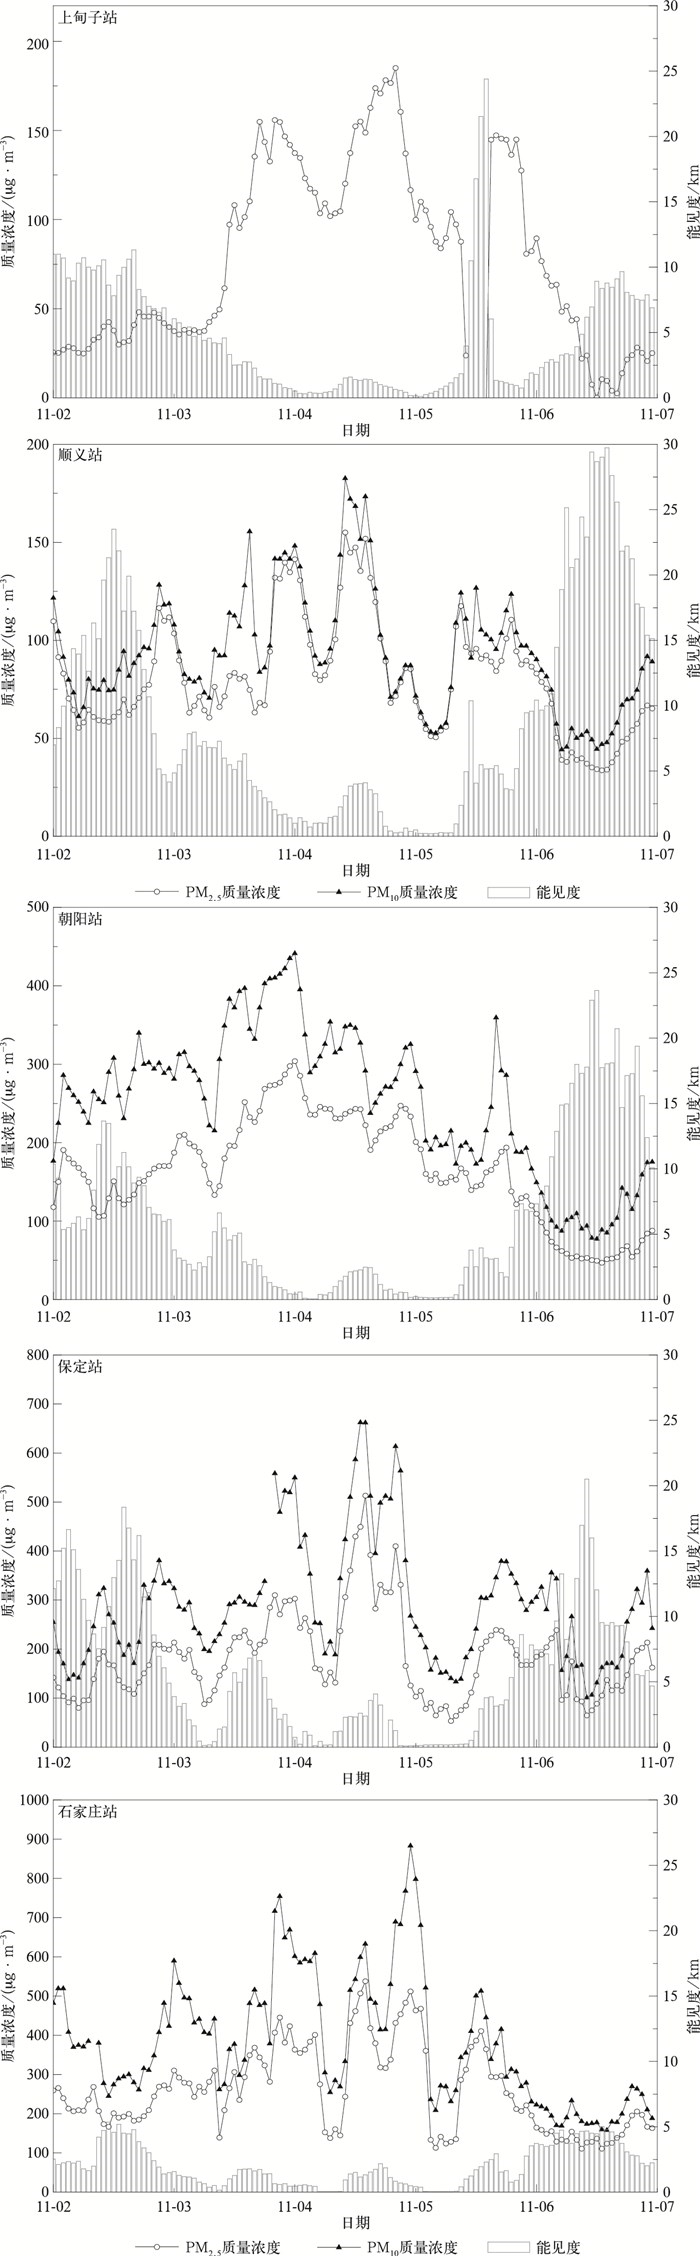
图 2 2016年11月2—6日上甸子站、顺义站、朝阳站、保定站和石家庄站PM2.5和PM10质量浓度及能见度变化
Fig. 2 Temporal variation of PM2.5, PM10 and visibility at Shangdianzi, Shunyi, Chaoyang, Baoding and Shijiazhuang from 2 Nov to 6 Nov in 2016
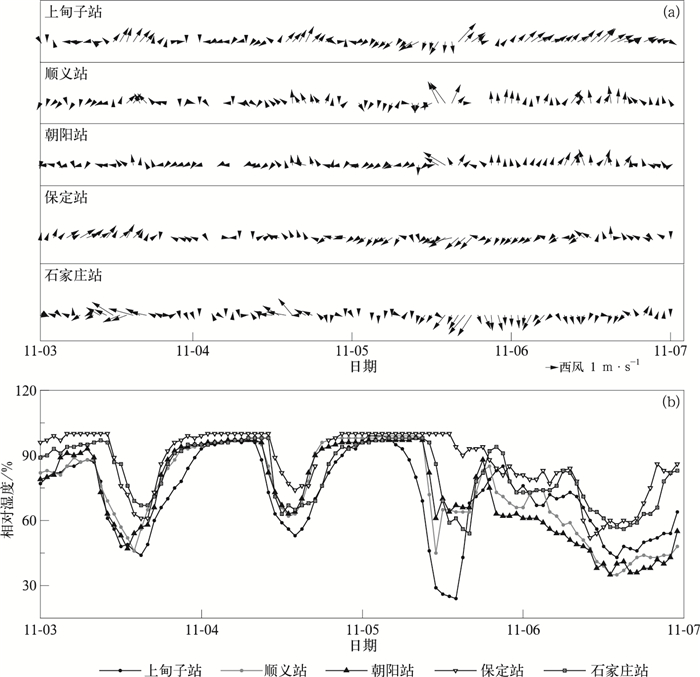
图 3 2016年11月3—6日风向、风速(a)和相对湿度(b)变化
Fig. 3 Temporal variation of wind(a) and relative humidity(b) from 3 Nov to 6 Nov in 2016
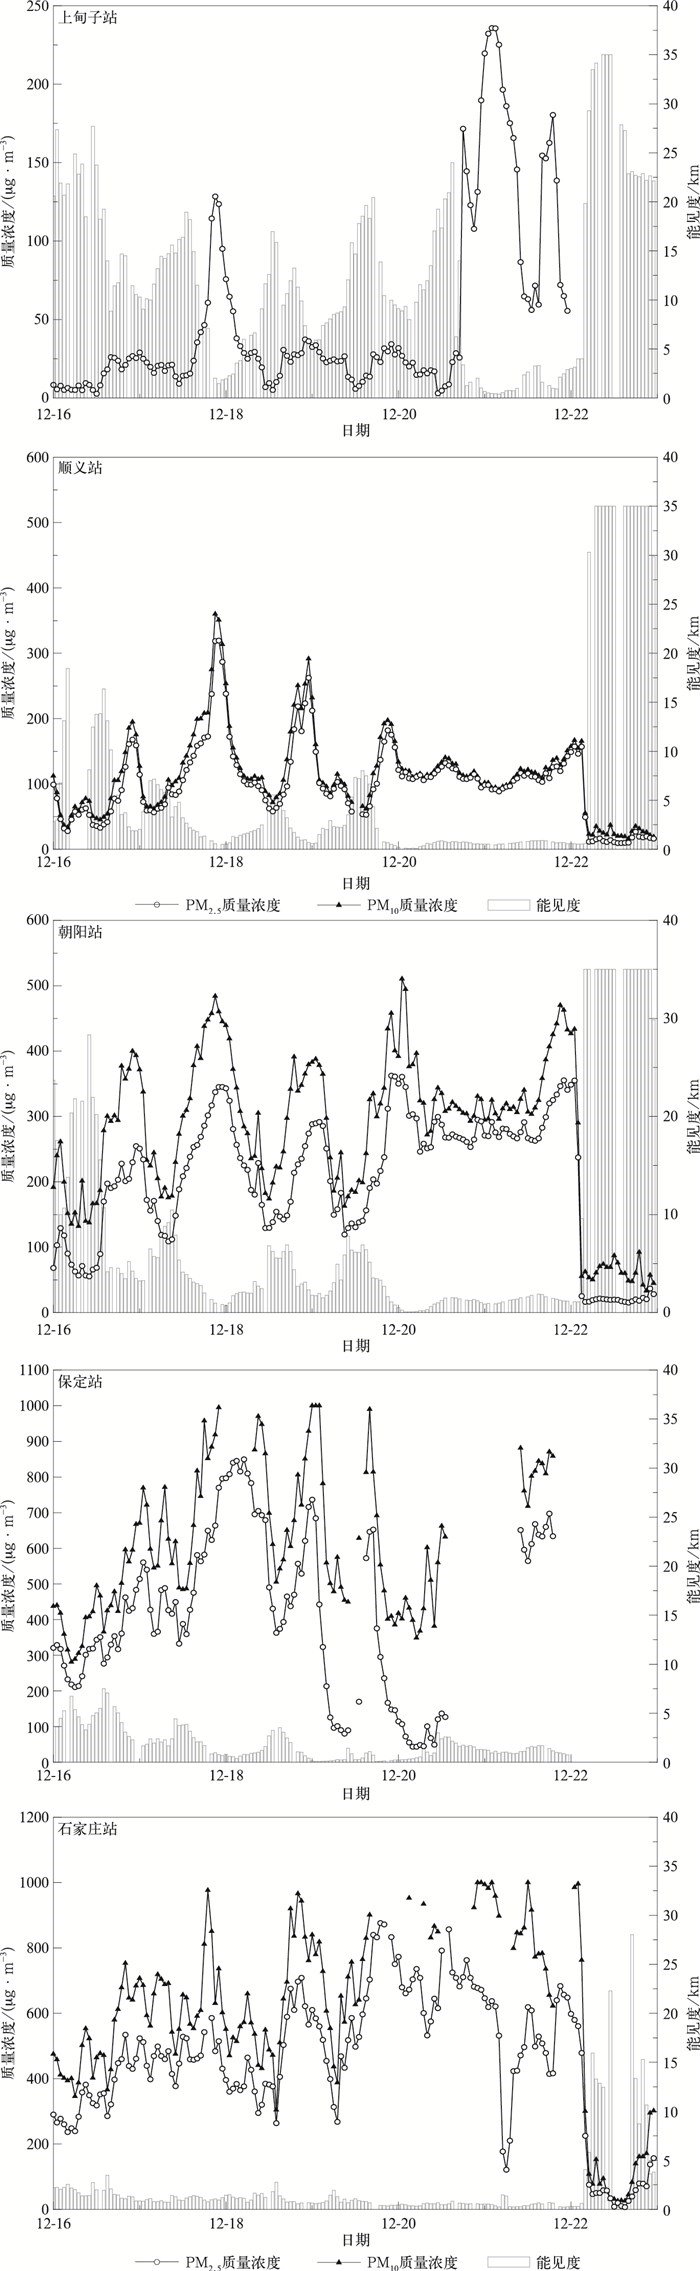
图 4 2016年12月16—22日上甸子站、顺义站、朝阳站、保定站和石家庄站PM2.5和PM10质量浓度及能见度变化
Fig. 4 Temporal variations of PM2.5, PM10 and visibility at Shangdianzi, Shunyi, Chaoyang, Baoding and Shijiazhuang from 16 Dec to 22 Dec in 2016
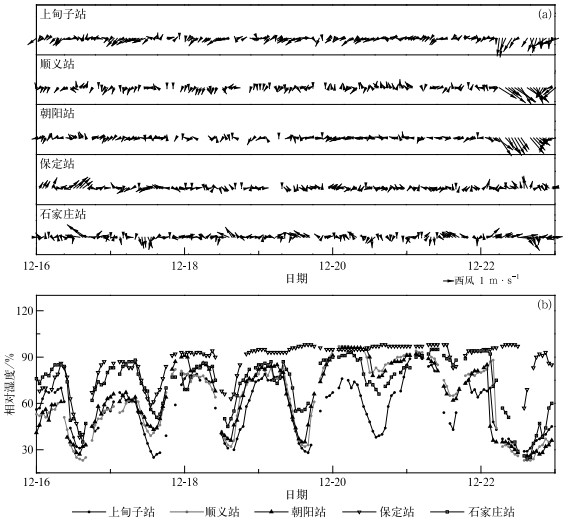
图 5 2016年12月16—22日风向、风速(a)和相对湿度(b)变化
Fig. 5 Temporal variation of wind(a) and relative humidity(b) from 12 Dec to 22 Dec in 2016
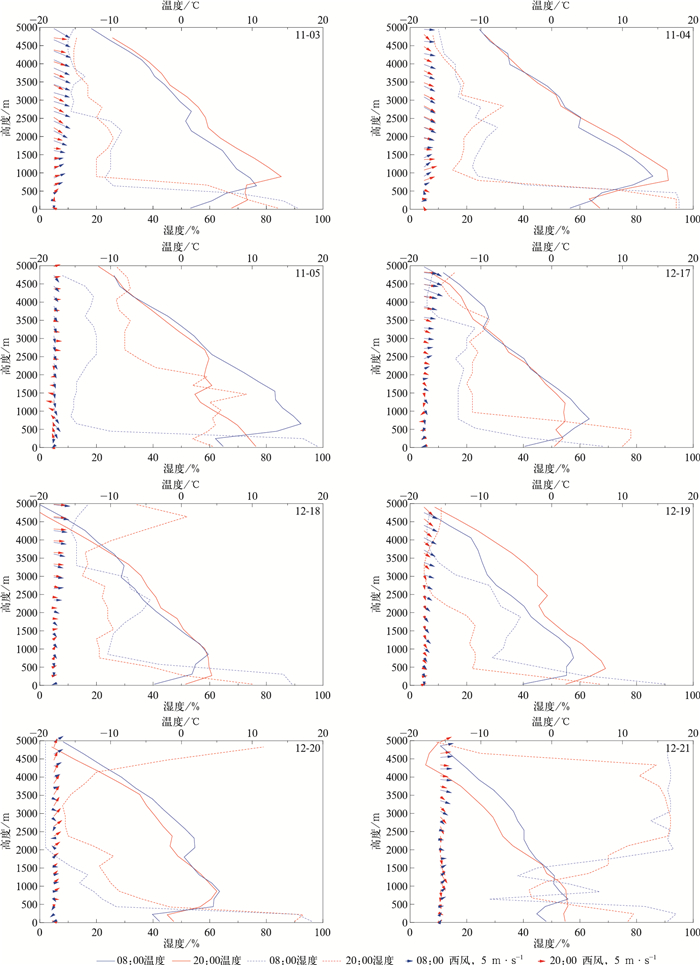
图 6 北京市观象台不同高度温度、湿度、风向风速变化
Fig. 6 Vertical profiles of temperature, humidity, wind speed and direction at Beijing Weather Observatory
表 1 主要大气污染物监测仪器
Table 1 Instruments at monitoring sites
站点 PM2.5在线观测 PM10在线观测 PM10膜采样 上甸子站 TOEM1400 顺义站 GRIMM180 GRIMM180 朝阳站 GRIMM180 GRIMM180 保定站 GRIMM180 GRIMM180 固城站 MiniVol 石家庄站 GRIMM180 GRIMM180  下载: 导出CSV
表 2 2016年11—12月北京重污染过程及周边地区污染情况
Table 2 Pollution episodes in Beijing and surrounding areas from Nov 2016 to Dec 2016
北京重污
染时段北京AQI 北京重污染
持续时间/d北京重污染时段PM2.5浓度水平/
(μg·m-3)北京周边地区重污染时段 朝阳站 保定站 石家庄站 保定 石家庄 11-03—05 230~292 3 191.0 210.4 295.0 11-03—04* 11-02—05 11-09 208 1 170.0 178.6 260.4 11-18 242 1 167.3 252.9 327.5 11-18—19 11-11—19 11-25—26 214~315 2 257.0 331.9 244.4 11-24—27 11-25** 12-03—04 259~302 2 254.6 687.4 648.0 12-02—04 12-02—07 12-11—12 219~271 2 202.3 401.4 342.3 12-11—12 12-10—12 12-17—21 246~431 5 240.9 433.2 533.9 12-16—22 12-14—21 12-30—31 262~351 2 262.6 379.9 12-28—31 12-28—31 注:*11月5日保定为中度污染,AQI为170;**11月26日石家庄为轻度污染,AQI为148。
下载: 导出CSV
表 3 2016年11—12月重污染、清洁天气期间PM2.5平均浓度及日数
Table 3 Average concentrations of PM2.5 and the number of days during different pollutions from Nov 2016 to Dec 2016
站点 PM2.5平均浓度/(μg·m-3) 日数/d 重污染 清洁 11—12月 重污染 清洁 11—12月
有效观测上甸子站 73.1 18.0 48.6 17 11 40 顺义站 130.8 48.7 80.7 16 22 50 朝阳站 226.0 60.3 132.5 18 23 56 保定站 357.8 94.1 268.2 18 5 37 石家庄站 346.9 86.9 282.6 33 2 50
下载: 导出CSV
表 4 2016年11—12月重污染天气期间各站气象条件
Table 4 The weather condition during haze from Nov 2016 to Dec 2016
时间 上甸子站 顺义站 朝阳站 风向 相对湿度/% 风向 相对湿度/% 风向 相对湿度/% 11-03—05 SW 74.8 NE 82.2 E 82.4 11-09 SW 75.5 NE,S 79.9 NE 71.7 11-18 NE 98.2 N 82.9 E 83.5 11-25—26 NE,SW 62.5 NE 63.4 E 60.2 12-03—04 NE 63.4 NE 70.1 NE,E 68.3 12-11—12 NE,SW 61.7 NE 63.8 NE,E 61.4 12-17—21 NE,E 60.4 NE 73.5 E 72.0 注:12月30—31日污染过程未在2016年结束,其过程演变特征和成因在本工作中未做讨论。
下载: 导出CSV
表 5 2016年11—12月重污染期间北京市观象台探空气象数据
Table 5 The vertical variation of meteorological condition during haze at Beijing Weather Observatory from Nov to Dec in 2016
污染过程 逆温层类型 最大逆温强度/
(℃·(100 m)-1)逆温层内主导风向 最大逆温高度/m 最大逆温厚度/m 11-03—05 贴地转脱地 3.0 SW 878 878 11-09 贴地 0.3 SW 698 698 11-18 脱地 0.5 SW 1730 793 11-25—26 贴地 1.37 SW 614 263 12-03—04 贴地 2.2 W 695 695 12-11—12 贴地、脱地 0.7 SW 1375 482 12-17—21 贴地 1.57 SW, W, E 833 821 注:对于多层逆温,选择厚度最大的一层的为逆温层统计逆温层厚度[31];表中所列污染过程风速均不超过2 m·s-1。
下载: 导出CSV
表 6 2016年重污染期间固城站PM10中主要化学组分浓度(单位:μg·m-3)
Table 6 The concentration of main chemical component in PM10 during heavy pollution at Gucheng in 2016(unit:μg·m-3)
时间 PM10 SO42- NO3- OC EC 11-03 299.7 71.8 48.8 38.5 16.8 12-22 477.9 72.1 46.8 121.9 34.5
下载: 导出CSV
-
[1] 高愈霄, 霍晓芹, 闫慧, 等.京津冀区域大气重污染过程特征初步分析.中国环境监测, 2016, 32(6):26-35. http://d.old.wanfangdata.com.cn/Periodical/zghjjc201606005 [2] 杨孝文, 周颖, 程水源, 等.北京冬季一次重污染过程的污染特征及成因分析.中国环境科学, 2016, 36(3):679-686. doi: 10.3969/j.issn.1000-6923.2016.03.007 [3] Zhang Z Y, Gong D Y, Mao R, et al.Cause and predictability for the severe haze pollutions in downtown Beijing during November-December 2015.Science of the Total Environment, 2017, 592:627-638. doi: 10.1016/j.scitotenv.2017.03.009 [4] Zhang L, Wang T, Lv M Y, et al.On the severe haze in Beijing during January 2013:Unraveling the effects of meteorological anomalies with WRF-Chem.Atmos Environ, 2015, 104:11-21. doi: 10.1016/j.atmosenv.2015.01.001 [5] 靳军莉, 颜鹏, 马志强, 等.北京及周边地区2013年1-3月PM2.5变化特征.应用气象学报, 2014, 25(6):690-700. http://qikan.camscma.cn/jams/ch/reader/view_abstract.aspx?file_no=20140605&flag=1 [6] Xu L L, Duan F K, He K B, et al.Characteristics of the secondary water-soluble ions in a typical autumn haze in Beijing.Environmental Pollution, 2017, 227:296-305. doi: 10.1016/j.envpol.2017.04.076 [7] 陈云波, 徐峻, 何友江, 等.北京市冬季典型重污染时段PM2.5污染来源模式解析.环境科学研究, 2016, 29(5):627-636. http://d.old.wanfangdata.com.cn/Periodical/hjkxyj201605003 [8] 张人禾, 李强, 张若楠.2013年1月中国东部持续性强雾霾天气产生的气象条件分析.中国科学(地球科学), 2014, 44(1):27-36. http://www.wanfangdata.com.cn/details/detail.do?_type=perio&id=zgkx-cd201401004 [9] 花丛, 张恒德, 张碧辉.2013-2014冬半年北京重污染天气气象传输条件分析及预报指数初建.气象, 2016, 42(3):314-321. http://d.old.wanfangdata.com.cn/Periodical/qx201603006 [10] 黄怡民, 刘子锐, 陈宏, 等.北京夏冬季霾天气下气溶胶水溶性离子粒径分布特征.环境科学, 2013, 34(4):1236-1244. http://d.old.wanfangdata.com.cn/Periodical/hjkx201304003 [11] 刘兴瑞, 马嫣, 崔芬萍, 等.南京北郊一次重污染事件期间PM2.5理化特性及其对大气消光的影响.环境化学, 2016, 35(6):1164-1171. http://d.old.wanfangdata.com.cn/Periodical/hjhx201606008 [12] 孙兆彬, 廖晓农, 王占山, 等.北京地区空气重污染下雾凇和偏东风对PM2.5清除作用.环境科学, 2016, 37(10):3679-3685. http://d.old.wanfangdata.com.cn/Periodical/hjkx201610001 [13] 林伟立, 葛宝珠, 徐晓斌, 等.上甸子本底站臭氧生成效率的观测研究.环境科学, 2010, 31(7):1444-1450. http://d.old.wanfangdata.com.cn/Conference/7409309 [14] 颜鹏, 刘桂清, 周秀骥, 等.上甸子秋冬季雾霾期间气溶胶光学特性.应用气象学报, 2010, 21(3):257-265. doi: 10.3969/j.issn.1001-7313.2010.03.001 [15] Pu W, Quan W, Ma Z, et al.Long-term trend of chemical composition of atmospheric precipitation at a regional background station in Northern China.Science of the Total Environment, 2017, 580:1340-1350. doi: 10.1016/j.scitotenv.2016.12.097 [16] 刘希文, 徐晓斌, 林伟立.北京及周边地区典型站点近地面O3的变化特征.中国环境科学, 2010, 30(7):946-953. http://d.old.wanfangdata.com.cn/Periodical/zghjkx201007012 [17] 孟昭阳, 谢育林, 贾诗卉, 等.2013年夏季华北乡村站点固城大气氨变化特征.应用气象学报, 2015, 26(2):141-150. http://qikan.camscma.cn/jams/ch/reader/view_abstract.aspx?file_no=20150202&flag=1 [18] 中国气象局综合观测司.大气成分观测业务规范(试行).2012. [19] 环境保护部, 国家质量监督检验检疫总局.GB3095-2012环境空气质量标准.北京:中国标准出版, 2012. [20] 孟昭阳, 贾小芳, 张仁健, 等.2010年长江三角洲临安本底站PM2.5理化特征.应用气象学报, 2012, 23(4):424-432. doi: 10.3969/j.issn.1001-7313.2012.04.005 [21] 李令军, 王占山, 张大伟, 等.2013-2014年北京大气重污染特征研究.中国环境科学, 2016, 36(1):27-35. doi: 10.3969/j.issn.1000-6923.2016.01.005 [22] 徐虹, 肖致美, 孔君, 等.天津市冬季典型大气重污染过程特征.中国环境科学, 2017, 37(4):1239-1246. doi: 10.3969/j.issn.1000-6923.2017.04.005 [23] 邓发荣, 康娜, Kanike R K, 等.长江三角洲地区大气污染过程分析.中国环境科学, 2018, 38(2):401-411. doi: 10.3969/j.issn.1000-6923.2018.02.001 [24] 杨文峰, 李星敏, 陈闯, 等.西安市两次雾霾期间气象要素和气溶胶特性分析.中国环境科学, 2015, 35(8):2298-2306. doi: 10.3969/j.issn.1000-6923.2015.08.007 [25] 张雅斌, 林琳, 吴其重, 等."13·12"西安重污染气象条件及影响因素.应用气象学报, 2016, 27(1):35-46. http://qikan.camscma.cn/jams/ch/reader/view_abstract.aspx?file_no=20160104&flag=1 [26] 中华人民共和国国家统计局.中国统计年鉴2017.北京:中国统计出版社, 2017:38-39. [27] 徐晓斌.我国霾和光化学污染观测研究进展.应用气象学报, 2016, 27(5):604-619. http://qikan.camscma.cn/jams/ch/reader/view_abstract.aspx?file_no=20160509&flag=1 [28] 王跃思, 姚利, 王莉莉, 等.2013年元月我国中东部地区强霾污染成因分析.中国科学(地球科学), 2014, 44(1):15-26. http://www.wanfangdata.com.cn/details/detail.do?_type=perio&id=zgkx-cd201401003 [29] 潘玮, 左志燕, 肖栋, 等.近50年中国霾年代际特征及气象成因.应用气象学报, 2017, 28(3):257-269. http://qikan.camscma.cn/jams/ch/reader/view_abstract.aspx?file_no=20170301&flag=1 [30] 姜江, 张国平, 高金兵.北京大气能见度的主要影响因子.应用气象学报, 2018, 29(2):188-199. http://qikan.camscma.cn/jams/ch/reader/view_abstract.aspx?file_no=20180206&flag=1 [31] 夏敏洁, 周文君, 裴海瑛, 等.基于L波段雷达探空资料的南京低空逆温特征.大气科学学报, 2017, 40(4):562-569. http://d.old.wanfangdata.com.cn/Periodical/njqxxyxb201704013 [32] Schauer J J, Kleeman M J, Cass G R, et al.Measurement of emissions from air pollution sources.5.C1-C32 organic compounds from gasoline-powered motor vehicles.Environ Sci Technol, 2002, 36(6):1169-1180. doi: 10.1021/es0108077 [33] Chen Y, Zhi G, Feng Y, et al.Measurements of emission factors for primary carbonaceous particles from residential raw-coal combustion in China.Geophys Res Lett, 2006, 33:L20815. doi: 10.1029/2006GL026966 [34] He L Y, Hu M, Huang X F, et al.Measurement of emissions of fine particulate organic matter from Chinese cooking.Atmos Environ, 2004, 38:6557-6564. doi: 10.1016/j.atmosenv.2004.08.034 [35] Schauer J J, Kleeman M J, Cass G R, et al.Measurement of emissions from air pollution sources.2.C1 through C30 organic compounds from medium duty diesel trucks.Environ Sci Technol, 1999, 33:1578-1587. doi: 10.1021/es980081n [36] 李璇, 赵晓楠, 俞磊, 等.石家庄市采暖前后大气颗粒物及其碳组分特征.环境科学研究, 2018, 31(4):679-687. http://d.old.wanfangdata.com.cn/Periodical/hjkxyj201804010 [37] Zhang Y M, Wang Y Q, Zhang X X, et al.Chemical components, variation, and source identification of PM1 during the heavy air pollution episodes in Beijing in December 2016.J Meteor Res, 2018, 32(1):1-13. doi: 10.1007/s13351-018-7051-8 -

 点击查看大图
计量
- 摘要浏览量: 4135
- HTML全文浏览量: 1331
- PDF下载量: 118
- 被引次数: 0
