
 设为首页
设为首页 加入收藏
加入收藏

The Relationship Between East-west Movement of Subtropical High over Northwestern Pacific and Precipitation in Southwestern China
-
摘要: 西北太平洋副热带高压(简称副高)位置的异常变动对东亚和中国气候有十分重要的影响。为进一步认识副高东西变动对中国西南地区降水的影响,根据东亚—西北太平洋地区高低层大气环流的季节特征,选取700 hPa不同关键区区域平均相对涡度定义了一个新的表征副高位置东西变动的VORT指数。分析发现:该指数不仅能客观定性地表征副高反气旋环流位置的东西变动,而且能反映副高与东亚经向环流变化的关系,副高偏东(西)时,东亚呈负-正-负(正-负-正)经向异常波列。与其他副高指数相比,该指数能较好地反映夏季中国东部雨带位置的季节性移动,并与西南地区降水呈显著相关,对西南地区降水变化有指示意义。其中,6月和7月的相关非常显著,副高偏西时,6月四川西部和南部、云南中北部地区降水偏少,贵州大部降水偏多;7月四川北部和东部、贵州东北部降水偏多,而云南中部和西北部降水偏少,反之亦然。进一步分析还发现,副高与海温的关系与副高活动的位置有关,副高越偏北,与海温的关系就越弱。
-
关键词:
- 中国西南地区;
- 夏季降水;
- 西北太平洋副热带高压;
- 东西位置变动
Abstract: The Northwest Pacific subtropical high (abbreviated as subtropical high) is one of the large-scale circulation systems that affect the climate in East Asia. The seasonal north-south movement of the subtropical high has a very important effect on the position of summer rain belt in eastern China. Most of the related researches focus on the movement of the subtropical high in the north-south direction, while less attention is paid to the east-west displacement, especially the influence on the climate in Southwest China. Southwest China is located in the eastward part of the Qinghai-Xizang Plateau, with high altitude and low latitude. Though the influence of the subtropical high on the climate in Southwest China is not as direct as that in the eastern part of China, it is found that the change of subtropical high also plays a very important role by affecting the configuration of atmospheric circulation system. Therefore, it is of great significance to study the anomalous movement of the east-west position of the subtropical high and its influence on the climate in southwestern China in order to understand causes of the climate anomaly.To further understand the influence of the change of the subtropical high, a new index to measure the east-west position of the summer subtropical high is defined by the regionally averaged relative vorticity at 700 hPa in different regions based on the climatology circulation. Results show that the index can characterize the east-west displacement of the anticyclonic circulation of the subtropical high more objectively and qualitatively, and it can also reflect the linkage between the subtropical high and meridional circulation over East Asia. When the subtropical high is east (west), there is a negative-positive-negative (positive-negative-positive) meridional anomalous wave train over East Asia. Comparing with other indices, the new index can better reflect the seasonal movement of rain belt position in eastern China in summer and has a significant correlation with precipitation in Southwest China in June and July. When the subtropical high is west, there is less precipitation in western and southern Sichuan, and most in Guizhou in June, and there is more precipitation in northern and eastern Sichuan, northeast Guizhou, and less precipitation in central and northwest Yunnan in July. When the subtropical high is east, the precipitation distribution is almost the contrary. Further analysis also shows that the relationship between the subtropical high and SST is related to the active position of the subtropical high. The farther north the subtropical high is, the weaker the relationship between the subtropical high and the SST is. -
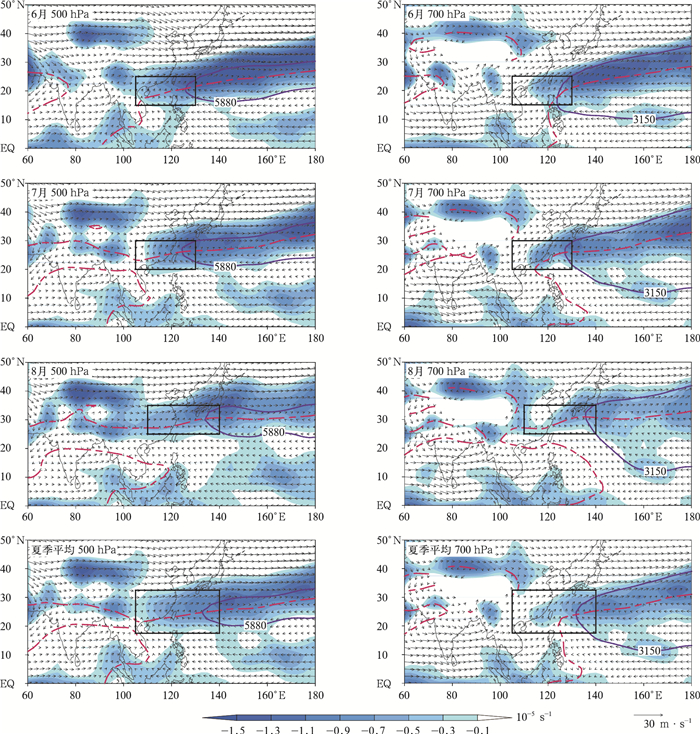
图 1 夏季6月,7月,8月和夏季平均500 hPa和700 hPa高度特征线(蓝色实线,单位:gpm)、脊线位置(红色长虚线)、相对涡度(填色)和风场(矢量)的多年气候平均(1981—2010年)分布(矩形方框表示关键区位置)
Fig. 1 Climatological characteristic lines(the blue solid line, unit:gpm), ridge lines(the red long dashed line), relative vorticity(the shaded) and vector winds(the vector) at 500 hPa and 700 hPa in Jun, Jul, Aug and summer (the rectangular box denotes the location of key area)
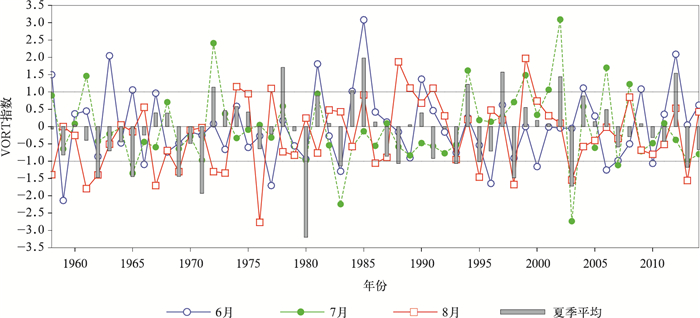
图 2 1958—2014年6月、7月、8月和夏季平均标准化VORT指数年际变化
Fig. 2 Interannual variation of VORT standardized subtropical high index in Jun, Jul, Aug and summer from 1958 to 2014
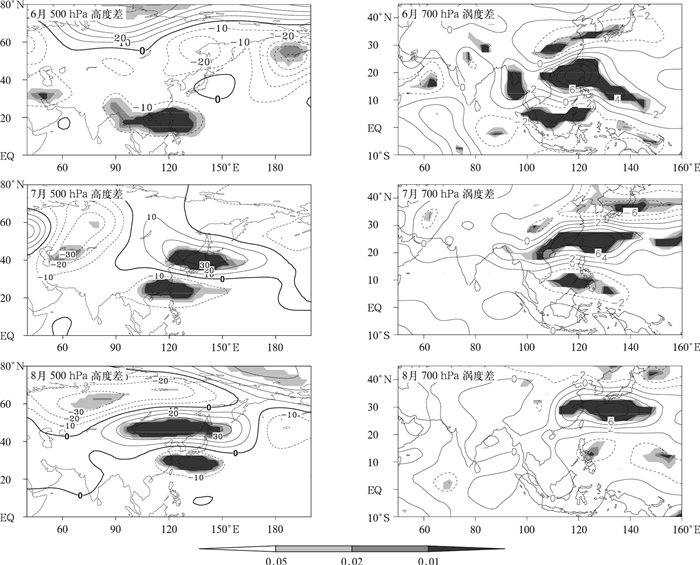
图 3 夏季6月、7月、8月VORT指数正负异常年500 hPa高度差(单位:gpm)和700 hPa涡度差(单位:10-6 s-1)
(由浅到深的阴影区分别表示达到0.05,0.02和0.01的显著性水平)
Fig. 3 The difference distribution of 500 hPa height(unit:gpm) and 700 hPa vorticity(unit:10-6s-1) between positive and negative VORT years in Jun, Jul and Aug
(light to dark shaded areas denote passing the test of 0.05, 0.02 and 0.01 levels)
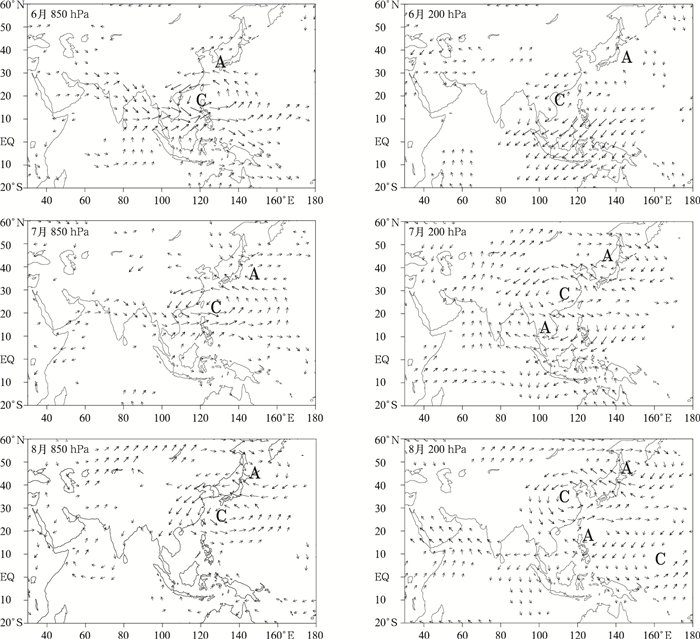
图 4 1958—2014年夏季6月、7月和8月VORT指数分别与同期850 hPa和200 hPa风场相关
(矢量表示达到0.05显著性水平区域)
Fig. 4 The correlation distribution between VORT index and vector wind at 850 hPa and 200 hPa level in Jun, Jul and Aug during 1958-2014
(vectors denote passing the test of 0.05 level)
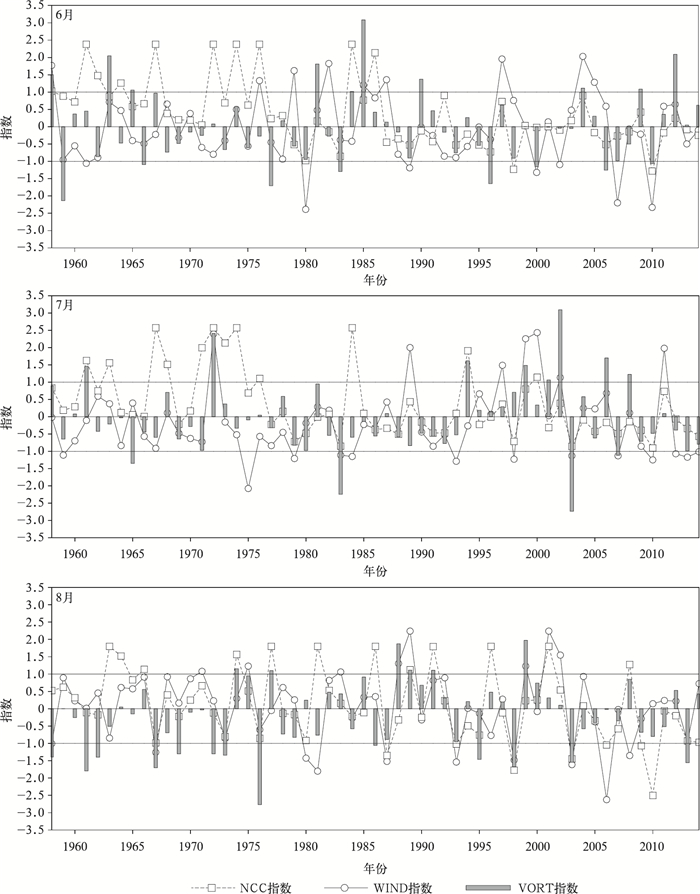
图 5 1958—2014年夏季6月、7月和8月标准化NCC指数、WIND指数和VORT指数变化
Fig. 5 The interannual variation of NCC index, WIND index and VORT index in Jun, Jul and Aug from 1958 to 2014

图 6 典型差异年份500 hPa相对涡度(填色)、脊线位置(红色长虚线)、5880 gpm特征线(蓝色点虚线, 单位:gpm)、多年气候平均5880 gpm特征线(蓝色实线, 单位:gpm)、矢量风场和大于10 mm降水区(绿色线,单位:mm)
(a)1992年6月,(b)1998年6月,(c)1984年7月,(d)1989年7月,(e)1981年8月,(f)1986年8月
Fig. 6 The distribution of relative vorticity(the shaded), ridge line(the red long dashed line), 5880 gpm characteristic line (the blue dotted line, unit:gpm), climatological 5880 gpm line(the blue solid line, unit:gpm), vector winds and exceeding 10 mm precipitation region(the green line, unit:mm) in evidently different years
(a)Jun 1992, (b)Jun 1998, (c)Jul 1984, (d)Jul 1989, (e)Aug 1981, (f)Aug 1986
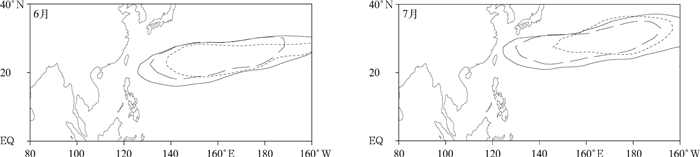
图 7 6月和7月IVORT>1.0(短虚线)和0.5>IVORT>0(长虚线)时5880 gpm特征线位置(实线为多年气候平均5880 gpm特征线)
Fig. 7 5880 gpm isogram according to IVORT>1.0(the short dotted line)and 0.5>IVORT>0 (the long dashed line)in Jun, Jul and Aug(the solid line denotes 5880 gpm)
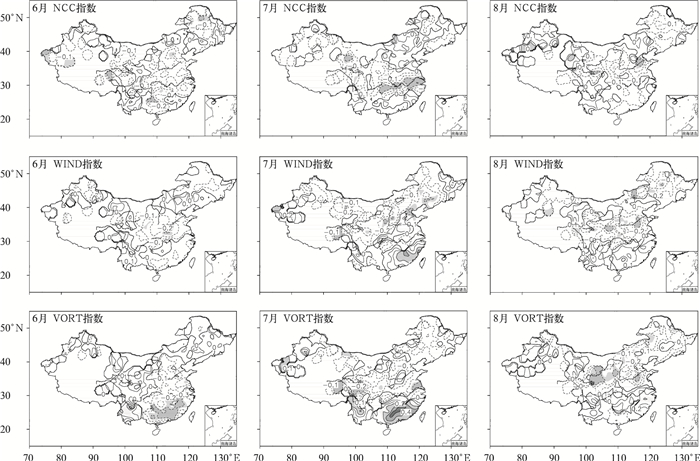
图 8 1961—2014年夏季NCC指数、WIND指数和VORT指数与中国降水相关分布
(阴影表示达到0.05显著性水平)
Fig. 8 Correlation distributions between different index and precipitation in China during 1961-2014
(the shaded denotes passing the test of 0.05 level)
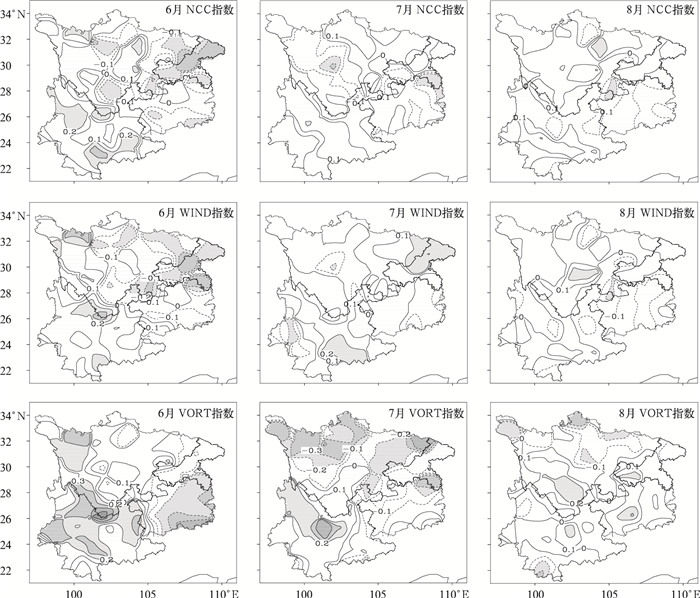
图 9 1961—2014年夏季NCC指数、WIND指数和VORT指数与西南降水相关分布
(阴影区表示达到0.1显著性水平)
Fig. 9 Correlation distributions between different index and precipitation in Southwestern China for 1961-2014
(the shaded denotes passing the test of 0.1 level)
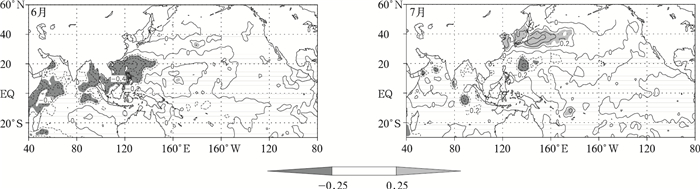
图 10 6月和7月VORT指数与海温同期相关
(阴影区表示达到0.05显著性水平)
Fig. 10 Correlation between VORT index and SST field in Jun and Jul
(the shaded denotes passing the test of 0.05 level)
表 1 夏季6月、7月和8月3个指数相关分析
Table 1 The relationship between three indices in Jun Jul and Aug
指数 6月 7月 8月 NCC WIND VORT NCC WIND VORT NCC WIND VORT NCC 1 0.14 0.31 1 0.19 0.30 1 0.39 0.41 WIND 1 0.43 1 0.51 1 0.43 VORT 1 1 1 注:相关系数超过0.26均达到0.05显著性水平。  下载: 导出CSV
-
[1] 谭桂容, 范艺媛, 牛若芸.江淮地区强降水分型及其环流演变.应用气象学报, 2018, 78(4):396-409. http://qikan.camscma.cn/jams/ch/reader/view_abstract.aspx?file_no=20180402&flag=1 [2] 王月, 张强, 顾西辉, 等.淮河流域夏季降水异常与若干气候因子的关系.应用气象学报, 2016, 76(1):67-74. http://qikan.camscma.cn/jams/ch/reader/view_abstract.aspx?file_no=20160107&flag=1 [3] 薛秋芳, 任传森, 陶诗言.长江流域洪涝灾害的成因分析.应用气象学报, 2001, 12(2):246-250. http://qikan.camscma.cn/jams/ch/reader/view_abstract.aspx?file_no=20010233&flag=1 [4] 牛若芸, 张志刚, 金荣花.2010年我国南方两次持续性强降水的环流特征.应用气象学报, 2012, 23(4):385-394. http://qikan.camscma.cn/jams/ch/reader/view_abstract.aspx?file_no=20120401&flag=1 [5] 朱乾根, 林锦瑞, 寿绍文, 等.天气学原理和方法.北京:气象出版社, 1992. [6] 陶诗言, 卫捷.再论夏季西太平洋副热带高压的西伸北跳.应用气象学报, 2006, 17(5):513-525. http://qikan.camscma.cn/jams/ch/reader/view_abstract.aspx?file_no=20060591&flag=1 [7] 张庆云, 陶诗言.夏季西太平洋副热带高压异常时的东亚大气环流特征.大气科学, 2003, 27(3):269-380. http://d.old.wanfangdata.com.cn/Periodical/daqikx200303007 [8] 姚秀萍, 于玉斌, 刘还珠.2003年淮河流域异常降水期间副热带高压的特征.热带气象学报, 2005, 21(4):393-400. doi: 10.3969/j.issn.1004-4965.2005.04.007 [9] 金啟华, 王辉, 姜华, 等.北太平洋副热带海洋环流强度异常对长江中下游夏季降水的影响.海洋学报, 2012, 34(1):64-70. http://d.old.wanfangdata.com.cn/Periodical/hyxb201201008 [10] 李慧, 周顺武, 王亚非.西太平洋副热带高压异常与中国长江中下游夏季降水关系研究综述.气象与环境学报, 2013, 29(1):93-102. doi: 10.3969/j.issn.1673-503X.2013.01.016 [11] 翟盘茂, 李蕾, 周佰铨, 等.江淮流域持续性极端降水及预报方法研究进展.应用气象学报, 2016, 76(5):631-640. http://qikan.camscma.cn/jams/ch/reader/view_abstract.aspx?file_no=20160511&flag=1 [12] 张庆云, 陶诗言.夏季西太平洋副热带高压北跳及异常的研究.气象学报, 1999, 57(5):539-548. http://www.wanfangdata.com.cn/details/detail.do?_type=perio&id=QK199900533752 [13] 李建平, 朱建磊.晚春初夏西太平洋副热带高压南撤过程的气候学特征.气象学报, 2008, 66(6):926-939. doi: 10.3321/j.issn:0577-6619.2008.06.008 [14] 韦道明, 李崇银, 谭言科.夏季西太平洋副热带高压南北位置变动特征及其影.气候与环境研究, 2011, 16(3):255-272. doi: 10.3878/j.issn.1006-9585.2011.03.01 [15] 晏红明, 程建刚, 郑建盟, 等.2009年云南秋季特大干旱的气候成因分析.大气科学学报, 2012, 35(2):229-239. doi: 10.3969/j.issn.1674-7097.2012.02.011 [16] 晏红明, 王灵, 朱勇, 等.2008年初云南低温雨雪冰冻天气的气候成因分析.高原气象, 2009, 28(4):870-879. http://d.old.wanfangdata.com.cn/Periodical/gyqx200904020 [17] 刘芸芸, 李维京, 艾孑兑秀, 等.月尺度西太平洋副热带高压指数的重建与应用.应用气象学报, 2012, 23(4):414-423. http://qikan.camscma.cn/jams/ch/reader/view_abstract.aspx?file_no=20120404&flag=1 [18] Lu R.Indices of the summertime western North Pacific subtropical high.Adv Atmos Sci, 2002, 19:1004-1028. doi: 10.1007/s00376-002-0061-5 [19] Yang H, Sun S.Longtitudinal displacement of the subtropical high in the western Pacific in summer and its influence.Adv Atmos Sci, 2003, 20:921-933. doi: 10.1007/BF02915515 [20] Yang H, Sun S.The characteristics of the subtropical high in the western Pacific in pre-rainy season in South China.Adv Atmos Sci, 2005, 22:392-400. doi: 10.1007/BF02918752 [21] 王黎娟, 罗玲, 张兴强, 等.西太平洋副热带高压东西位置变动特征分析.南京气象学院学报, 2005, 28(5):577-585. http://d.old.wanfangdata.com.cn/Periodical/njqxxyxb200505001 [22] 陆日宇, 李颖, Chan-Su Ryu.夏季西太平洋副热带高压的东西偏移和对流层低层环流变化的主要模态的关系.自然科学进展, 2007, 17(4):546-550. doi: 10.3321/j.issn:1002-008X.2007.04.019 [23] Yang R W, Xie Z A, Cao J.A dynamic index for the westward ridge point variability of the western Pacific subtropical high during summer.J Climate, 2017, 30:3325-3341. doi: 10.1175/JCLI-D-16-0434.1 [24] Xie P, Arkin P A.Global precipitation:A 17-year monthly analysis based on gauge observations, satellite estimates, and numerical model outputs.Bull Amer Meteor Soc, 1997, 78:2539-2558. doi: 10.1175/1520-0477(1997)078<2539:GPAYMA>2.0.CO;2 [25] Kalnay E, Kanamitsu M, Kistler R.The NCEP/NCAR 40-year reanalysis project, Bull Amer Meteor Soc, 1996, 77:437-470. doi: 10.1175/1520-0477(1996)077<0437:TNYRP>2.0.CO;2 [26] Rayner N A, Parker D E, Horton E B, et al.Global analyses of SST, sea ice and night marine air temperature since the late nineteenth century.Journal of Geophysical Research Atmospheres, 2003, 108(D14):4407, DOI: 10.1029/2002JD002670. [27] Liu Y M, Wu G X, Liu H, et al.Condensation heating of the Asian summer monsoon and the subtropical anticyclone in the Eastern Hemisphere.Climate Dyn, 2001, 17(4):327-338. doi: 10.1007/s003820000117 [28] Rodwell M J, Hoskins B J.Subtropical anticyclones and summer monsoons.J Climate, 2000, 14:3192-3211. http://d.old.wanfangdata.com.cn/NSTLQK/NSTL_QKJJ0231802743/ [29] 陈志举.散度、涡度与天气.甘肃气象, 1985(4):16. http://d.old.wanfangdata.com.cn/Thesis/Y398979 [30] 赵俊虎, 封国林, 杨杰, 等.夏季西太平洋副热带高压的不同类型与中国汛期大尺度旱涝的分布.气象学报, 2012, 70(5):1021-1031. http://d.old.wanfangdata.com.cn/Periodical/qxxb201205009 [31] 李万彪, 周春平.热带西太平洋暖池和副热带高压之间的关系.气象学报, 1998, 56(5):619-626. doi: 10.3321/j.issn:0577-6619.1998.05.011 [32] 陈迪, 高山红, 陈锦年, 等.赤道东太平洋和印度洋-南海暖池海温场的协同作用对西太平洋副热带高压的影响.海洋学报, 2016, 38(2):1-15. doi: 10.3969/j.issn.0253-4193.2016.02.001 [33] 陈丽娟, 袁媛, 杨明珠, 等.海温异常对东亚夏季风影响机理的研究进展.应用气象学报, 2013, 24(5):521-532. http://qikan.camscma.cn/jams/ch/reader/view_abstract.aspx?file_no=20130502&flag=1 -

 点击查看大图
计量
- 摘要浏览量: 2983
- HTML全文浏览量: 1391
- PDF下载量: 182
- 被引次数: 0
