用TRMM/LIS资料分析长江三角洲地区的闪电活动
ANALYSIS OF LIGHTNING ACTIVITY OVER THE YANGTZE RIVER DELTA USING TRMM/LIS OBSERVATIONS
-
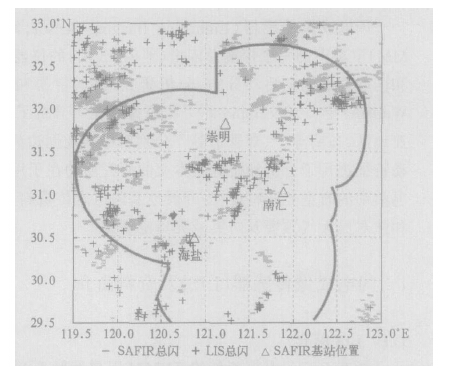
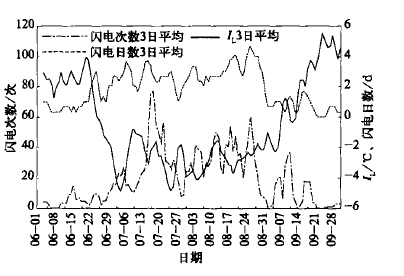
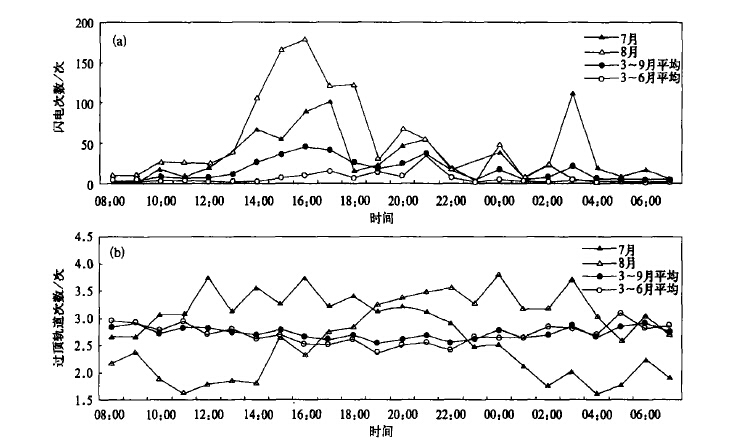
摘要: 统计分析了1998~2004年长江三角洲(长三角)地区由星载闪电成像传感器(LIS)观测的闪电资料,发现了该地区LIS闪电活动的一些时空分布特征:闪电次数的年差异较大,最多年份是最少年份的3倍;7~8月盛夏季节是闪电高发期,闪电次数和日数分别占全年的70%和60%;闪电高发期间的抬升指数(IL)小于-2℃;7~8月闪电主要集中于午后,3~6月则集中在上半夜;上海地区单日LIS闪电次数超过8次时,多伴有强对流天气和短时强降水;长三角地区的闪电活动区主要分布在上海的东部,部分沿江、沿湖地区和浙江的龙门山等山区;水域闪电少于陆地,大城市城区下风方向闪电活动较多,部分雷暴刚入海时有加强的趋势。分析表明:太阳辐射的季节变化和日变化等是造成闪电时间分布的主要原因;地形的动力作用和下垫面的物理特性及其差异是造成气候意义上中小尺度闪电空间分布差异的主要原因。文章对LIS闪电定位资料进行了探测效率订正,根据LIS注视时间计算了闪电密度,并与地基闪电定位资料和多普勒天气雷达资料进行了对比。LIS闪电活动特征的分析,对雷暴预警和防灾减灾有指导意义。Abstract: In terms of TRMM/Lightning Imaging Sensor (LIS) data, the lightning activity over the Yangtze River Delta from 1998 to 2004 is undertaken. After applying the observation efficiency correction for the LIS data and using the viewing times statistics of LIS over the target area, the temporal (annual and diurnal) and spatial distributions of LIS lightning are depicted. The number of lightning flashes observed by LIS varies year by year, and the maximum is about three times the minimum. About 60% of the lightning days and 70% of the lightning flashes of a year occurs during July and August, with lightning peaking in the afternoon. The lightning activity peaks in the early evening in other months. In Shanghai, severe thunderstorms often occurs when the number of LIS lightning flashes in a day is more than eight. Fewer lighting flashes and days are found over water areas. Some lightning activity centers are found downstream of metropolis such as the east part of Shanghai, and mountain areas such as Longmen Mountains. When moving off shore, some thunderstorms tend to intensify and produce more flashes. Results show that the temporal change in solar radiation brings about the temporal distribution of LIS lightning activity. The physical features of surface and topography may be major causes for the difference in the spatial distribution of lightning in mesoscale. Comparisons with ground-based observations, such as Doppler weather radar and the SAFIR total lighting localization system are also made。
-
表 1 1998-2004 年长三角地区LIS 闪电的逐年统计

-
[1] Christian H J,Blakeslee R J,Goodman S J,et al.The Lightning Imaging Sensor.Proceedings of the 11th International Conference on Atmospheric Electricity,Guntersville,Alabama,June 7-11,1999.746-749。 [2] Christian H J,Blakeslee R J,Goodman S J,et al.Algorithm Theoretical Basis Document (ATBD) for the Lightning Imaging Sensor (LIS).NASA/ Marshall Space Flight Center,2000。 [3] Williams E R,Rothkin K,Stevenson D,et al.Global lightning variations caused by changes in thunderstorm flash rate and by changes in the number of thunderstorms.J Appl Met,2000,39(12):2223-2230。 doi: 10.1175/1520-0450(2001)040<2223:GLVCBC>2.0.CO;2 [4] Boccippio D J,Goodman S J.Regional differences in tropical lightning distributions.J Appl Met,2000,39(12):2231-2248。 doi: 10.1175/1520-0450(2001)040<2231:RDITLD>2.0.CO;2 [5] 郄秀书,周筠,袁铁,等.卫星观测到的全球闪电活动及其地域差异.地球物理学报,2003,46(6):743-750。 http://www.cnki.com.cn/Article/CJFDTOTAL-DQWX200306004.htm [6] 马明,陶善昌,祝宝友,等.卫星观测的中国及周边地区闪电密度的气候分布.中国科学(D辑),2004,34(4):298-306。 http://www.cnki.com.cn/Article/CJFDTOTAL-JDXK200404001.htm [7] 郄秀书,Ralf Toumi.卫星观测到的青藏高原雷电活动特征.高原气象,2003,22(3):288-293。 http://www.cnki.com.cn/Article/CJFDTOTAL-GYQX200303013.htm [8] Boccippio D J,Koshak W J,Blakeslee R J.Performance assessment of the optical transient detector and lightning imaging sensor.Part I:Predicted diurnal variability.J Atmos Oceanic Tech,2002,19(9):1318-1332。 doi: 10.1175/1520-0426(2002)019<1318:PAOTOT>2.0.CO;2 [9] VAISALA公司.SAFIR Site Selection,Site CMA-3000 Shanghai Area.上海:上海中心气象台,2002。 [10] Galway J G.The lifted index as a predictor of latent instability.Bull Amer Meteor Soc,1956,37:528-529。 http://www.scirp.org/reference/ReferencesPapers.aspx?ReferenceID=396819 -


 设为首页
设为首页 加入收藏
加入收藏


 下载:
下载:


