
 设为首页
设为首页 加入收藏
加入收藏

利用静止气象卫星红外通道遥感监测中国沙尘暴
Remote Sensing and Detection of Dust Storm in China Using the Thermal Bands of Geostationary Meteorological Satellite
-
摘要: 气象卫星的红外窗区通道 (8~12 μm) 对于通常大气气溶胶几乎没有响应, 但对于较大颗粒且浓度较强的沙尘气溶胶, 尤其是沙尘暴有明显的信号反应。空气中的沙尘在红外分裂窗通道表现出两个特征:一是对地表发射到空间的红外信号产生衰减, 造成卫星探测到的地气系统亮温降低, 这就是所谓的红外差值沙尘指数IDDI; 二是沙尘粒子在红外分裂窗两个通道的比辐射率不同, 11 μm比12 μm的比辐射率低, 从而造成这两个通道的亮温差是负值。基于这两个特征和沙尘多通道光谱聚类法, 针对静止气象卫星观测数据进行了沙尘暴卫星遥感监测业务算法开发, 输出沙尘暴监测产品和红外差值沙尘指数产品, 这一算法不仅用于已经退役的GMS-5卫星, 而且应用于正在运行的静止气象卫星FY-2C, 它还为沙尘暴的定量或半定量遥感提供参考借鉴。Abstract: The earth observation system from space includes two kinds of platform:Polar orbit and geostationary satellite. Optical sensors onboard polar satellite have the advantage of high spatial resolution and more spectral bands in visible to infrared regions such as AVHRR/NOAA, MODIS/EOS, MVIS/FY-1C/1D etc. But it can conduct only twice a day. It is not enough for hazardous dust weather whose time scale is very short and moves quickly. It is difficult to understand dust moving and evolution as a whole using polar sensors' observation. Geostationary Meteorological Satellite such as GMS-5, FY-2, GOES and Meteosat can observe the earth continuously all daytime and night at high temporal resolution. Developing an algorithm for remote sensing and monitoring dust event will be very useful for forecast model, environment and climate monitoring and scientific research. Dust cloud is not easy to be discriminated like other strong weather phenomena such as typhoon. It is to be understood of the optical and radiative mechanism of airborne dust. The base theories of remote sensing of airborne dust will be introduced using the thermal and other bands of geostationary sensors. Observation signal of thermal infrared window (8—12 μm) bands have almost no sensitivity to general aerosols with small and thin particle sizes. There are some sensitivity to large and strong dust particles, especially in dust storm or heavy dust storm. The airborne dust can exert two kinds of features on thermal infrared observation signals. Firstly the infrared radiance of ground target into space will be reduced by dust layer and the brightness temperature of the observed underlying target be decreased. This kind of temperature reduction is called infrared difference dust index (IDDI). Secondly the emissivities of airborne dust are different in these two split window bands and produce the negative brightness temperature difference for dust targets. Based on these above theories and the traditional sophisticated multispectral classification technique, a set of algorithms for automatically detecting dust storm is developed using observation data of geostationary meteorological satellite. The first step of this algorithm is to extract the data of all bands from normalized disk image of observation and to conduct the interested region projection and calibration processing. The data reading is not only from present time but also from previous ten days for integrating background brightness temperature image. It is ready for IDDI image integration. The second step is cloud mask processing which is very important for dust discrimination. And then dust determination is conducted using above mentioned theories and methods. It is the key part of this algorithm. The last step is the production output including several types of dust remote sensing. This algorithm can obtain ideal result of dust storm detection and the product of IDDI. This algorithm has already been experimentally run in National Satellite Meteorological Center since 2001. It is not only used for dust detection from data of Japanese GMS-5, but also becomes a useful operational production of the new geostationary meteorological satellite FY-2C in orbit in 2005. In addition, it provides extended potential of quantitative or semi-quantitative remote sensing of dust storm.
-
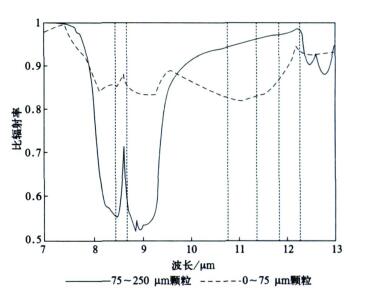
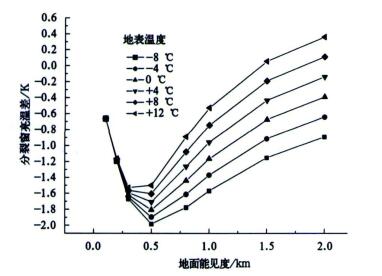
图 2 中纬度冬季标准大气条件下不同强度的沙尘分裂窗亮温差随地面能见度的变化
Fig. 2 Brightness temperature difference (BTD) in split window dependence of dust loading in several winter surface temperatures in mid-latitudes
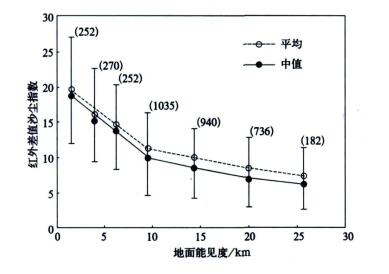
图 3 地面能见度和红外差值沙尘指数对应关系[6]
(其中能见度对应7个等级[0, 2.5], [2.5, 5], [5, 7.5], [7.5, 10], [10, 15], [15, 20], [20, 30] km; 括号内数字为样本数)
Fig. 3 Climatological relation between IDDI and visibility[6]
(visibility measurements being classified into seven categories defined by the intervals [0, 2.5], [2.5, 5], [5, 7.5], [7.5, 10], [10, 15], [15, 20], [20, 30] km; the number inside bracket denotes the sample number)
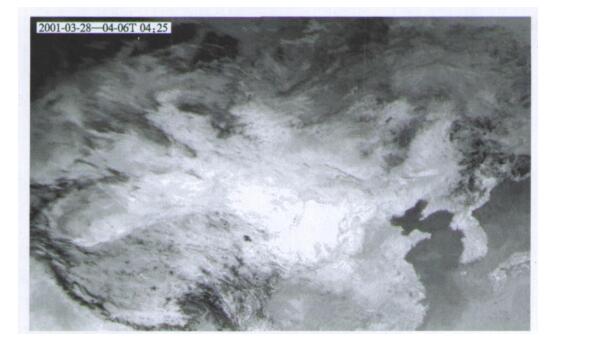
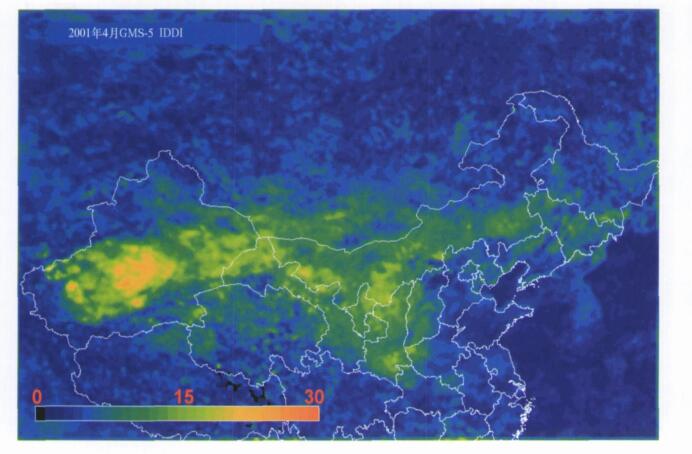
图 4 GMS-5 10 d合成红外背景亮温图像
Fig. 4 GMS-5 integrated brightness temperature image of background during ten days
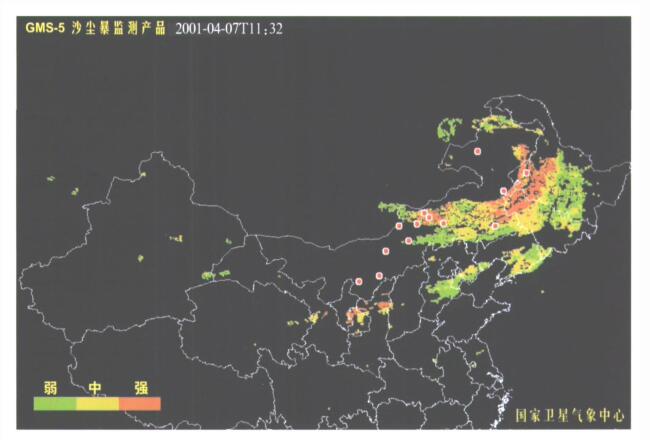
图 5 GSM-5沙尘暴监测结果格点图
(图中红点代表地面有沙尘报告的气象观测站)
Fig. 5 GSM-5 dust detection grid image
(red points denote the weather station with the report of dust occurrence)
-
[1] 石广玉, 赵思雄.沙尘暴研究中的若干科学问题.大气科学, 2003, 27(4):591-606. http://www.cnki.com.cn/Article/CJFDTOTAL-DQXK200304010.htm [2] Stowe L L, Ignatov A M, Singh R R. Development, validation, and potential enhancements to the second-generation operational aerosol product at the national environmental satellite, data, and information service of the National Oceanic and Atmospheric Administration. J Geophys Res, 1997, 102:16923-16934. doi: 10.1029/96JD02132 [3] Moulin C, Guillard F, Dulac F, et al. Long term daily monitoring of Saharan dust load over ocean using Meteosat ISCCP-B2 data, part Ⅰ:Methodology and preliminary results for 1983-1994 in the Mediterranean. J Geophys Res, 1997, 102:16947-16958. doi: 10.1029/96JD02620 [4] Kaufman Y J, Karnieli A, Tanre D. Detection of dust over deserts using satellite data in the solar wavelengths. IEEE Trans Geosci Remote Sensing, 2000, 38:525-531. doi: 10.1109/36.823947 [5] Herman J R, Bhartia P K, Torres O, et al. Global distribution of UV-absorbing aerosols from Nimbus 7/TOMS data. J Geophys Res, 1997, 102:16911-16922. doi: 10.1029/96JD03680 [6] Legrand M, Plana-Fattori A, N'doume. Satellite detection of dust using the IR imagery of Meteosat Ⅰ:Infrared difference dust index. J Geophys Res, 2001, 106(D16):18251-18274. doi: 10.1029/2000JD900749 [7] Brooks N.Dust-climate Interactions in the Sahel-Sahara Zone of Northern Africa, with Particular Reference to Late Twentieth Century Sahelian Drought.Climatic Research Unit, University of East Anglia, Norwich UK, 2000. [8] Ackerman S A. Remote sensing aerosols using satellite infrared observations. J Geophys Res, 1997, 102:17069-17079. doi: 10.1029/96JD03066 [9] Wald A, Kaufman Y J, Tanre D, et al. Daytime and nighttime detection of mineral dust over desert using infrared spectral contrast. J Geophys Res, 1998, 103:32307-32313. doi: 10.1029/98JD01454 [10] Ackerman S A. Using the radiative temperature difference at 3.7 and 11 μm to track dust outbreaks. Remote Sensing Environment, 1989, 27:129-133. doi: 10.1016/0034-4257(89)90012-6 [11] 方宗义, 朱福康, 江吉喜, 等.中国沙尘暴研究.北京:气象出版社, 1997:82-87. [12] 方宗义, 张运刚, 郑新江, 等.用气象卫星遥感监测沙尘的方法和初步研究.第四纪研究, 2001, 21(1):48-55. http://www.cnki.com.cn/Article/CJFDTOTAL-DSJJ200101006.htm [13] 郑新江, 陆文杰, 罗敬宁.气象卫星多通道信息监测沙尘暴的研究.遥感学报, 2001, 5(4):300-306. http://www.cnki.com.cn/Article/CJFDTOTAL-YGXB200104009.htm [14] 罗敬宁, 范一大, 史培军, 等.多源遥感数据沙尘暴强度监测的信息可比方法.自然灾害学报, 2003, 12(2):28-34. http://www.cnki.com.cn/Article/CJFDTOTAL-ZRZH200302005.htm [15] 胡秀清, 卢乃锰, 邱红, 等.利用静止气象卫星监测沙尘暴.气候与环境研究, 2003, 8(1):101-106. http://www.cnki.com.cn/Article/CJFDTOTAL-QHYH200301011.htm [16] 胡秀清. 中国北方沙尘暴的静止气象卫星遥感监测研究. 北京: 北京师范大学地理学与遥感科学学院, 2004. [17] Hu Xiuqing, Lu Naimeng, Zhang Peng, et al. China Dust Storm Monitoring Using Meteorological Satellite. The 24th Asia Conference on Remote Sensing & 2003 International Symposium on Remote Sensing. Busan, Korea, 2003:707-709. [18] 周自江, 王锡稳, 牛若芸.近47年中国沙尘暴气候特征研究.应用气象学报, 2002, 13 (2):193-200. http://qikan.camscma.cn/jams/ch/reader/view_abstract.aspx?file_no=20020225&flag=1 [19] 杨东贞, 王超, 温玉璞, 等.1990年春季两次沙尘暴特征分析.应用气象学报, 1995, 6(1):18-26. http://qikan.camscma.cn/jams/ch/reader/view_abstract.aspx?file_no=19950103&flag=1 -

 下载:
下载:
 点击查看大图
计量
- 摘要浏览量: 4184
- HTML全文浏览量: 862
- PDF下载量: 3625
- 被引次数: 0
