我国380nm波长气溶胶光学厚度分布特征和演变趋势
Spatial/Temporal Variations and Trends of Aerosol Optical Depth at 380 nm Wavelength in China During 1980—2001
-
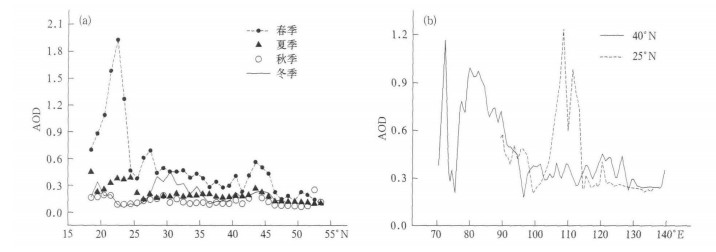
摘要: 利用1980—2001年TOMS/ NASA逐月气溶胶光学厚度 (AOD) 资料, 通过EOF, Morlet小波分析、趋势分析和突变检验等方法, 研究了我国大气气溶胶380nm光学厚度的时空分布特征和变化趋势。结果表明:全国全年存在两个范围较大、持续时间较长的AOD高值区:南疆盆地和四川盆地; 绝大部分地区春季AOD值最大, 最小值出现的季节则有所不同; 季节差异随纬度增加而减小; AOD变化具有明显的季节性和年际振荡特征; 年平均AOD呈明显增加趋势, 20世纪80年代末90年代初增加趋势有所减弱。
-
关键词:
- TOMS;
- 380nm气溶胶光学厚度;
- 时空分布
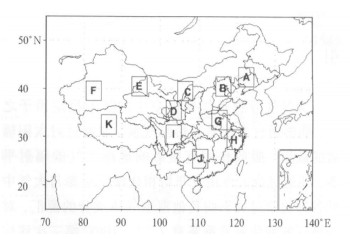
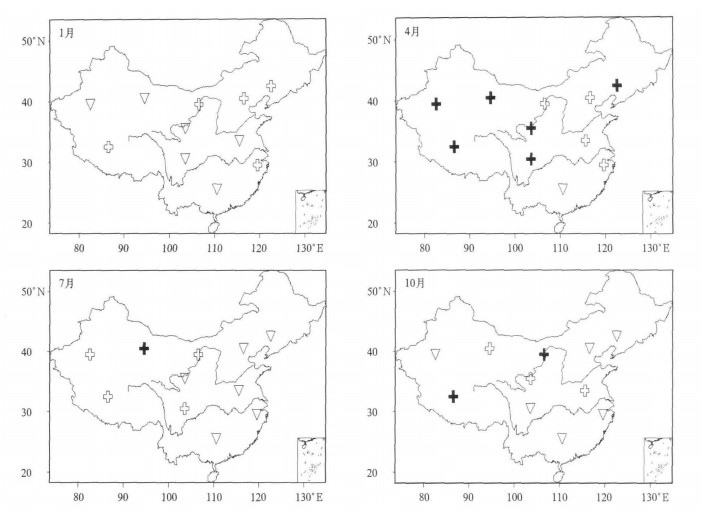
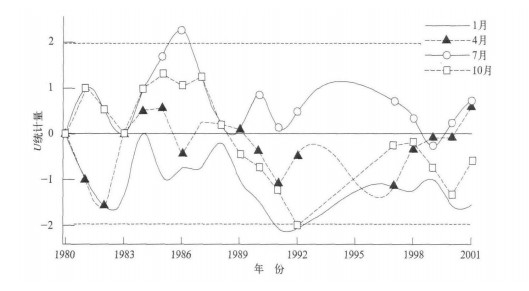
Abstract: Study is undertaken of the spatial and temporal distributions and long-term trends of 380 nm Aerosol optical depth (AOD) over China of 1980—2001 TOMS/NASA monthly data which are then treated with techniques such as EOF (empirical orthogonal function), Morlet wavelet transform, Fourier power spectrum, linear trend, Mann-Kendall test (M-K test) and moving t-test. The conclusions as follows are drawn. AOD differs greatly in its meridional distribution all over China. On an annual-mean basis there are two AOD high-value regions covering wide areas and active throughout the whole year, which are the basins in South Xinjiang and Sichuan Basin, together with a short-term high-valued area in South China as well as low AOD covering Northeast China and the Tibetan Plateau. In spring, the northern values are higher in comparison with the southern ones except the high value zone in South China. In summer the southern values are slightly bigger than the northern ones and the reversal happens in winter. AOD in autumn is higher in the north than in the south to the west of 110°N and v.v. to the east. During the research period, the AOD at wavelength of 380 nm varies remarkably with time, thickest during spring in most part of China except the Tibetan Plateau and thinnest in different seasons for regions all over China. Furthermore, variations in seasonal AOD are dominated by significant geographic characteristics, which are of two patterns. The one for summer is a type with the south/west AOD opposite to north/east AOD and the other is a type with no difference in the general tendency throughout the whole country for the other three seasons. Eleven areas (Zone A—K) are selected for regional research of the spatial and temporal variations based on the annual distribution and seasonal EOF analysis of the AOD characteristics. There are five kinds of annual cycles for the AOD in the selected eleven regions. The differences among seasons are decreasing with the latitude and significant in lower latitudes. AOD in target areas and the national means show pronounced intra-seasonal/annual oscillations, as well as significant 1-, 2- and 4-yearly periods. The AOD anomaly of China and regional representatives have been weakened since late 1980s. During 1980—2001 annual-mean AODs experience the linear increasing trends on the national and regional scales, whose increase rates have been slowed down since the period from the late 1980s to the early 1990s, occurring from east to west and from north to south in China, with remarkable inter-annual abrupt changes in North China, i.e., Zone A-F, H and K in this study. Except the decreasing trend in January, most of the regional trends in different study months also have similar linear increasing trends and decreasing shifts. The turning points of seasonal AODs in eleven selected areas also occur during the period from the late 1980s to the early 1990s, especially significant in time series of spring and autumn AODs for the eleven research zones. -
表 1 1980-2001年各区周期 (经小波方差和傅立叶功率谱验证的Morlet小波结果)
Table 1 Periods of Zone A-K & China during 1980-2001 (already verified by the global power spectrum and Fourier power spectrum at 90% level)

-
[1] Kaufman Y J, Tanre D, Boucher O. A satellite view of aerosols in the climate system. Nature, 2002, 419(6903):215-223. doi: 10.1038/nature01091 [2] Hudson J G. Cloud condensation nuclei. J Appl Meteor, 1993, 32(4):596-607. doi: 10.1175/1520-0450(1993)032<0596:CCN>2.0.CO;2 [3] Lohmann U, Lesins G. Stronger constraints on the anthropogenic indirect aerosol effect. Science, 2002, 298(5595):1012-1015. doi: 10.1126/science.1075405 [4] Houghton J T, Ding Y H, Griggs D J, et al. Climate Change 2001:The Scientific Basis. Cambridge:Cambridge University Press, 2001:1-20;135-146. [5] Li Fang, Lu Daren. Features of aerosol optical depth with visibility grade over Beijing. Atmos Environ, 1997, 31(20):3413-3419. http://adsabs.harvard.edu/abs/1997AtmEn..31.3413L [6] Qiu Jinhuan, Yang Liquan. Variation characteristic of atmospheric aerosol optical depths and visibility in North China during 1980—1994. Atmos Environ, 2000, 34(4):603-609. doi: 10.1016/S1352-2310(99)00173-9 [7] 周秀骥, 李维亮, 罗云峰.中国地区大气气溶胶辐射强迫及区域气候效应的数值模拟.大气科学, 1998, 22(4):413-427. http://www.cnki.com.cn/Article/CJFDTOTAL-DQXK804.003.htm [8] 罗云峰, 吕达仁, 周秀骥, 等.30年来我国大气气溶胶光学厚度平均分布特征分析.大气科学, 2002, 26(6):721-730. http://www.cnki.com.cn/Article/CJFDTOTAL-DQXK200206000.htm [9] 宗雪梅, 邱金桓, 王普才.近10年中国16个台站大气气溶胶光学厚度的变化特征分析.气候与环境研究, 2005, 10(2): 201-208. http://www.cnki.com.cn/Article/CJFDTOTAL-QHYH200502006.htm [10] 毛节泰, 李成才, 张军华, 等. MODIS卫星遥感北京地区气溶胶光学厚度及与地面光度计遥感的对比.应用气象学报, 2002, 13(特刊):127-135. http://www.cnki.com.cn/Article/CJFDTOTAL-YYQX2002S1013.htm [11] 李成才, 毛节泰, 刘启汉, 等.利用MODIS研究中国东部地区气溶胶光学厚度的分布和季节变化特征.科学通报, 2003, 48(19):2094-2100. http://www.cnki.com.cn/Article/CJFDTOTAL-KXTB200319018.htm [12] 张军华, 斯召俊, 毛节泰, 等. GMS卫星遥感中国地区气溶胶光学厚度.大气科学, 2003, 27(1):23-35. http://www.cnki.com.cn/Article/CJFDTOTAL-DQXK200301002.htm [13] 施晓晖, 徐祥德, 张胜军, 等. EOF模型分析北京周边气溶胶影响域气候变化显著性特征.中国科学 (D辑), 2005, 35(增刊I):206-218. http://www.cnki.com.cn/Article/CJFDTOTAL-JDXK2005S1020.htm [14] Massie S T, Torres O, Smith S J. Total Ozone Mapping Spectrometer (TOMS) observations of increases in Asia aerosol in winter from 1979 to 2000. J Geophys Res, 2004, 109 (D18211):doi:10.1029/ 2004JD004620. [15] Dubovik O, Smirnov A, Holben B N, et al.Accuracy assessments of aerosol optical properties retrieved from AERONET sun and sky-radiance measurements. J Geophys Res, 2000, 105: 9791-9806. doi: 10.1029/2000JD900040/abstract [16] Yu H B, Kaufman Y J, Chin M. A review of measurementbased assessments of the aerosol direct radiative effect and forcing. Atmos Chem Phys, 2006, 6(3):613-666. http://centaur.reading.ac.uk/34634/ [17] Torres O, Bhartia P K, Herman J R, et al. Derivation of aerosol properties from satellite measurements of backscattered ultraviolet radiation:Theoretical basis. J Geophys Res, 1998, 103 (D14):17099-17110. doi: 10.1029/98JD00900 [18] Torres O, Bhartia P K, Herman J R, et al. A long-term record of aerosol optical depth from TOMS observations and comparison to AERONET measurements.J Atmos Sci, 2002, 59(1):398-413. doi: 10.1175/1520-0469%282002%29059%3C0398%3AALTROA%3E2.0.CO%3B2 [19] Ramanathan V, CrutzenP J, Mitra A P, et al. The Indian Ocean Experiment and the Asian brown cloud. Current Science, 2002, 83(8):947-955. http://scrippsscholars.ucsd.edu/vramanathan/content/indian-ocean-experiment-and-asian-brown-cloud [20] Krishnamurti T N, Jha B, Prospero J M, et al. Aerosol and pollutant transport over the tropical Indian Ocean during the 1996 northeast monsoon and the impact on radiative forcing. Tellus, 1998, 50B: 521-542. [21] UNEP and C4. The Asian Brown Cloud:Climate and Other Environmental Impacts, Nairobi:UNEP, 2002. [22] Wu Shu, Liu Qinyu. Some problems on the global wavelet spectrum. Journal of Ocean University of China, 2005, 4(4):398-402. doi: 10.1007/s11802-005-0062-y [23] 中国科学院地质部.关于我国华北沙尘天气的成因与治理对策.地球科学进展, 2000, 15(4):361-36. http://www.cnki.com.cn/Article/CJFDTOTAL-DXJZ200004000.htm -


 设为首页
设为首页 加入收藏
加入收藏


 下载:
下载:
