
 设为首页
设为首页 加入收藏
加入收藏

近40年东亚季风变化特征及其与海陆温差关系
Variations of East Asian Monsoon and Its Relationships with Land-sea Temperature Difference in Recent 40 Years
-
摘要: 利用NCEP/NCAR再分析资料, 计算了乔云亭等定义的1957—2000年东亚季风指数, 研究了各指数之间相互关系和年际变化的主要特征, 在此基础上又利用全国194站1957—2000年地面资料分析东亚季风指数的年际变化与各气象要素场的年际变化之间的关系以及我国近40年气候变化特点。结果表明:西南季风、东南季风和偏北季风的年变化有所差异; 夏季, 东部地区降水量与相对应各个海区海陆温差负相关显著, 并且江淮区对应的海陆温差与东北区和华北区夏季降水有较好的正相关关系, 当江淮区对应的海陆温差降低时, 江淮区夏季降水量增加, 华北区和东北区夏季降水量减少; 经过前后两段时期 (1957—1978年和1979—2000年) 对比发现海陆温差变化对我国季风区夏季降水的影响在增强。同时, 发现850 hPa气温变化在前后两段时期也发生了显著变化, 1979年之前我国东部升温最快的区域位于华北西南部和江淮东部, 1979年之后升温最快的区域转移到江淮西部和我国东南部的海面上。Abstract: Using the NCEP/NCAR reanalysis grid data for the period of 1957—2000, East Asian Monsoon indexes defined by Qiao Yunting are calculated with interrelationship and annual changes of the indexes are examined. Relationships between the indexes and the variability of the weather elements and characteristics of the climate change in the east of China are analyzed by using surface data from 194 surface stations. The results show that the changes of the southwest monsoon, the southeast monsoon and the north monsoon are different. The intensity of southwest monsoon has been weakening until 1990s as well as the area's change. The southeast monsoon becomes weaker in recent 40 years. On the contrary, its range increases. The north monsoon changes little both in the intensity and area in winter. However the summer monsoon affecting the China continent weakens in liner changes in recent 40 years. In summer, the precipitation of Yangtze-Huaihe River valley increases apparently and decreases over the other east parts of China in summer. The precipitation of every part in monsoon region and its corresponding land-sea temperature difference show negative correlation, and the precipitation of Northeast China and North China have positive correlation with the land-sea temperature difference of Yangtze-Huaihe River valley. It means that when the land-sea temperature difference of Yangtze-Huaihe River valley drops, the precipitation of Yangtze-Huaihe River valley increases and that of Northeast China and North China decreases. The relationship between land-sea temperature difference and precipitation in two different phases are examined, and it is found that the influence of land-sea temperature difference on precipitation in summer enhances in the second phase (1979—2000) than in the first phase (1957—1978). The temperatures of the east part of China continent and the corresponding sea increase in recent 40 years, and the increasing velocity of the sea is larger than that of the continent, which resulting in the land-sea temperature difference decreasing year by year. That may be the cause why the summer monsoon changes weakly. During the period from 1957 to 1978, the temperatures of 850 hPa in summer drop over the middle and west part of China except north part of Xinjiang and rise over the east of China. During the second period from 1979 to 2000, the temperature of 850 hPa in summer rises all over China except middle and north part of Xingjiang and Qinghai, the north part of Gansu and west part of Inner Mongolia. The area where temperature of 850 hPa in summer increases most greatly moves from southwest of Northern China and east part of Yangtze-Huaihe River valley to west part of Yangtze-Huaihe River valley and the southeast sea to China continent.
-

图 1 1957-2000年季风区内 (20°~40°N, 100°~140°E) 季风面积指数和强度指数的时间演变及二阶拟合曲线
(a) 夏季风面积指数, (b) 夏季风强度指数, (c) 冬季风面积指数, (d) 冬季风强度指数
Fig. 1 Temporally-varying and two step fitting curve of monsoon area index and intensity index in monsoon area (20°-40°N, 100°-140°E) during 1957-2000
(a) summer monsoon area index, (b) summer monsoon intensity index, (c) winter monsoon area index, (d) winter monsoon intensity index
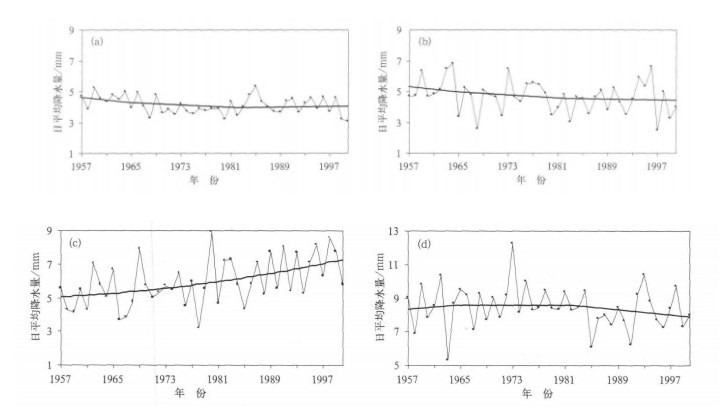
图 2 我国东部不同区域夏季降水量的时间演变及二阶拟合曲线 (a) 东北区, (b) 华北区, (c) 江淮区, (d) 华南区
(东北、华北和江淮区夏季降水量用6, 7, 8月的日平均降水量表示, 华南区夏季降水量用4, 5, 6月的日平均降水量表示)
Fig. 2 Temporally-varying and two step fitting curve of daily precipitation in summer in the east of China during 1957-2000 (a) Northeast China, (b) North China, (c) Yangtze-Huaihe River valley, (d) South China
(the precipitation in summer of Northeast China, North China and Yangtze-Huaihe River valley is represented by daily precipitation of June, July and August, and the precipitation in summer of South China is represented by daily precipitation of April, May and June)
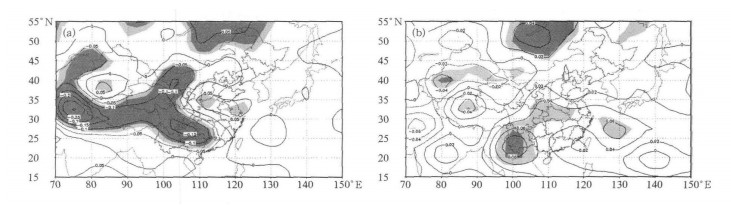
图 3 1957-1978年 (a) 和1979-2000年 (b) 我国夏季850 hPa年平均气温线性倾向值
(浅和深色阴影区分别表示达到0.05和0.01显著性水平)
Fig. 3 The line trend distribution of yearly air temperature of 850 hPa in China during 1957-1978 (a) and 1979-2000 (b)
(light and dark shaded areas denotes the test exceeding 0.05 and 0.01 level)
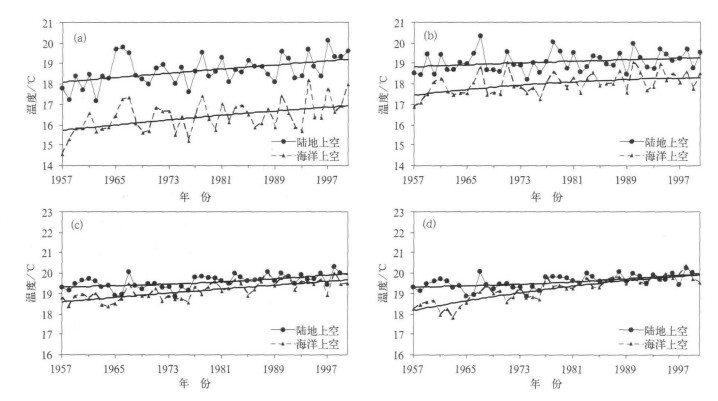
图 4 1957-2000年我国东部地区与对应海域夏季850 hPa气温时间演变及二阶拟合曲线
(a) 华北区及对应海域, (b) 江淮区及对应海域, (c) 华南区及对应东部海域, (d) 华南区及对应南部海域
Fig. 4 Temporally-varying and two step fitting curve of 850 hPa temperature in summer the east of China and corresponding sea areas during 1957-2000
(a) North China and corresponding sea area, (b) Yangtze-Huaihe River valley and corresponding sea area, (c) South China and corresponding east sea area, (d) South China and corresponding North sea area

图 5 我国东部地区与对应海域1957-2000年夏季海陆温差的时间演变及二阶拟合曲线
(a) 华北区及对应海域, (b) 江淮区及对应海域, (c) 华南区及对应东部海域, (d) 华南区及对应南部海域
Fig. 5 Temporally-varying and two step fitting curve of daily land-sea temperature difference in summer in the east of China and corresponding sea areas during 1957-2000
(a) North China and corresponding sea area, (b) Yangtze-Huaihe River valley and corresponding sea area, (c) South China and corresponding east sea area, (d) South China and corresponding North sea area
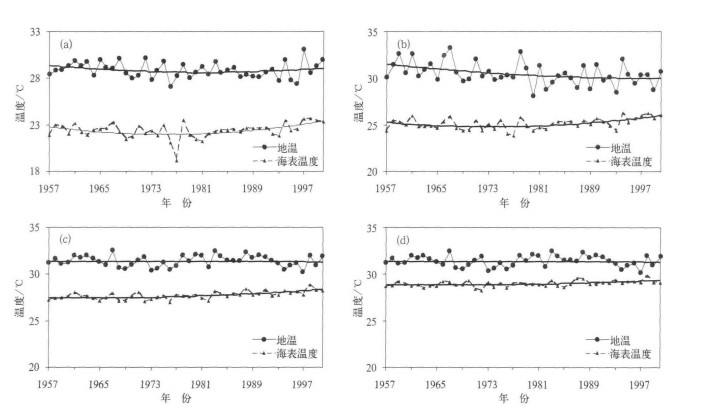
图 6 我国东部3个区的夏季地温时间序列图以及4个海区年平均海表温度时间演变及二阶拟合曲线
(a) 华北区及对应海域, (b) 江淮区及对应海域, (c) 华南区及对应东部海域, (d) 华南区及对应南部海域
Fig. 6 Temporally-varying and two step fitting curve of daily surface temperature in the east of China and SST of its corresponding sea area in summer during 1957-2000
(a) North China and corresponding sea area, (b) Yangtze-Huaihe River valley and corresponding sea area, (c) South China and corresponding east sea area, (d) South China and corresponding south sea area
表 1 1957-2000年东亚各季风特征指数间相关系数
Table 1 The correlation coefficients between different monsoon indices during 1957-2000

表 2 1957-2000年夏季海陆温差和西南、东南季风指数相关系数
Table 2 The correlation coefficients between land-sea temperature difference and different monsoon indices in summer during 1957-2000

表 3 1957-2000年夏季海陆温差和我国东部地区夏季降水量相关系数
Table 3 The correlation coefficients between land-sea temperature difference and precipitation over the east of China in summer during 1957-2000

表 4 1957-1978年和1979-2000年海陆温差和我国东部地区夏季降水量相关系数
Table 4 The correlation coefficients between land-sea temperature difference and precipitation over the east of China in summer during 1957-1978 and 1979-2000

-
[1] 陈隆勋, 朱乾根, 罗会邦, 等.东亚季风.北京:气象出版社, 1991:192-193. [2] 施能, 杨永胜. 1873—1996年东亚冬、夏季风强度指数及其主要特征.南京气象学院学报, 1998, 21(2):208-214. http://www.cnki.com.cn/Article/CJFDTOTAL-NJQX802.006.htm [3] 黄刚.东亚夏季风环流异常指数与夏季气候变化关系的研究.应用气象学报, 1999, 10(增刊):61-69. http://www.cnki.com.cn/Article/CJFDTOTAL-YYQX9S1.007.htm [4] Huang Ronghui. Decadal variability of the summer monsoon rainfall in East Asian and its association with the SST anomalies in the tropical pacific. Clivar Exchange, 2001, 2:7-8. [5] 郭其蕴, 蔡静宁, 邵雪梅, 等. 1873—2000年东亚夏季风变化的研究.大气科学, 2004, 28(2):206-215. http://www.cnki.com.cn/Article/CJFDTOTAL-DQXK200402003.htm [6] Halley E. An historical account of the trade winds and the monsoons, observable in the seas between and near the tropics, with an attempt to assign the physical cause of the said winds. Phil Trans Roy Soc London, 1686, 16:153-168. doi: 10.1098/rstl.1686.0026 [7] 陶诗言, 陈隆勋.亚洲夏季大陆上空大气环流的结构.气象学报, 1957, 28:234-247. http://www.cnki.com.cn/Article/CJFDTOTAL-QXXB195703005.htm [8] 李峰, 何金海.北太平洋海温异常与东亚夏季风相互作用的年代际变化.热带气象学报, 2000, 16(3):260-271. http://www.cnki.com.cn/Article/CJFDTOTAL-RDQX200003008.htm [9] 柳艳香, 郭裕福.中高纬度气压系统异常对东亚夏季风年代际变化的影响.高原气象, 2005, 24(2):129-135. http://www.cnki.com.cn/Article/CJFDTOTAL-GYQX200502000.htm [10] 张庆云, 陶诗言, 陈烈庭.东亚夏季风指数的年际变化与东亚大气环流.气象学报, 2003, 61(4):559-568. http://www.cnki.com.cn/Article/CJFDTOTAL-QXXB200305005.htm [11] 乔云亭, 陈烈庭, 张庆云.东亚季风指数的定义及其与中国气候的关系.大气科学, 2002, 26(1):69-82. http://www.cnki.com.cn/Article/CJFDTOTAL-DQXK200201006.htm [12] 徐玉貌, 刘红年, 徐桂玉.大气科学概论.南京:南京大学出版社, 2000:179-182. [13] 赵平, 周自江.东亚副热带夏季风指数及其与降水的关系.气象学报, 2005, 63(6):933-941. http://www.cnki.com.cn/Article/CJFDTOTAL-QXXB200506009.htm [14] 郭其蕴, 蔡静宁, 邵雪梅, 等. 1873—2000年东亚夏季风变化的研究.大气科学, 2004, 28(2):206-215. http://www.cnki.com.cn/Article/CJFDTOTAL-DQXK200402003.htm [15] 朱乾根, 林锦瑞, 寿绍文, 等.天气学原理和方法.北京:气象出版社, 2000:584-587. [16] 何金海, 宇婧婧, 沈新勇, 等.有关东亚季风的形成及其变率的研究.热带气象学报, 2004, 20(5):449-459. http://www.cnki.com.cn/Article/CJFDTOTAL-RDQX200405000.htm [17] 刘长征, 王会军, 姜大膀.东亚季风区夏季风强度和降水的配置关系.大气科学, 2004, 28(5):700-712. http://www.cnki.com.cn/Article/CJFDTOTAL-DQXK200405004.htm -

 下载:
下载:
计量
- 摘要浏览量: 4465
- HTML全文浏览量: 793
- PDF下载量: 1688
- 被引次数: 0
