
 设为首页
设为首页 加入收藏
加入收藏

冬半年南支西风中Rossby波传播及其与南支槽形成的关系
Relationship Between Rossby Wave Propagation in Southern Branch of Westerlies and the Formation of the Southern Branch Trough in Wintertime
-
摘要: 利用1948—2005年的10月—次年5月NCEP/NCAR再分析资料对西风急流中Rossby波的传播及其与冬半年副热带南支西风槽形成的关系进行研究, 结果表明:冬半年亚洲副热带西风急流下方存在3个南支波动, 分别位于阿拉伯海、孟加拉湾和我国华南地区, 其中孟加拉湾南支槽变率最小, 是半永久性低压槽; 从北非、阿拉伯海到孟加拉湾的“-+-”遥相关波列表明南支槽与北非槽呈正相关, 与阿拉伯海槽呈反相关。在西风波动从北非东传到孟加拉湾的过程中, 往往会在阿拉伯海有所停顿, 这种由西向东的传播过程约20 d一次, 具有明显的低频振荡特征; 源自北非的定常Rossby波能量沿着急流波导传播到孟加拉湾, 可能是南支槽明显增幅的一个主要机制; 另外, 从青藏高原东西两侧南下的冷空气活动也是南支槽加深发展的一个重要因素。Abstract: Based on the calculation of wave number of Rossby wave and flux of wave activity, the characteristics of Rossby wave propagation in southern branch of westerlies are analyzed, and the relationship between Rossby wave propagation in westerly jet stream and the formation mechanism of the wintertime southern branch trough in the subtropical westerlies is also investigated by using 58-year monthly and daily NCEP/ NCAR reanalysis data with the aid of one point correlation, EOF, harmonic and composition analysis.Results show that the reare three westerly disturbances under the subtropical westerly jet stream in Arabian Sea, the Bay of Bengal, and South China of Northern Hemisphere during the winter half year. Southern branch trough over the Bay of Bengal is a semi-permanent trough due to the smallest variability. A teleconnection wave train with negative, positive and negative centers, migrating from North Africa to the Bay of Bengal via Arabian Sea, suggests that southern branch trough is positively related with the trough over North Africa.In the propagation process from North Africa to the Bay of Bengal, the westerly disturbances usually pause or strengthen in the Arabian Sea.The propagation from west to east takes about 20 days, appearing remarkable quasi-biweekly oscillation.There are waveguide regions of wave number 6—8 along the subtropical westerly jet stream in the half year of winter.Because jet stream waveguide is the strongest and the stationary Rossby wave energy in the lower troposphere coming from North Africa is transported to the Bay of Bengal, southern branch trough becomes deepest in February.Bay of Bengal is also a main source place of southern branch trough in the winter half year, and the development of trough over South China mainly connects with the eastern propagation of southern branch trough.Moreover, the activity of the cold air along the eastern and western sides of the the Plateau plays an important role in the formation of southern branch trough.After the breaking down of cold air, it first arrives at Bay of Bengal along the southern sides of the Plateau and then departs from the western sides of the Tibetan Plateau, and makes the southern branch trough gradually deepened.The eastern cold air of the Tibetan Plateau breaks down in the wake of cold surge breaking down in East Asia.Cold air at surface layer from north-east to south-west disperses to the region of India and Burma, which is another important factor of development of southern branch trough.
-
Key words:
- Rossby wave;
- SBT;
- propagate and developed mechanism
-
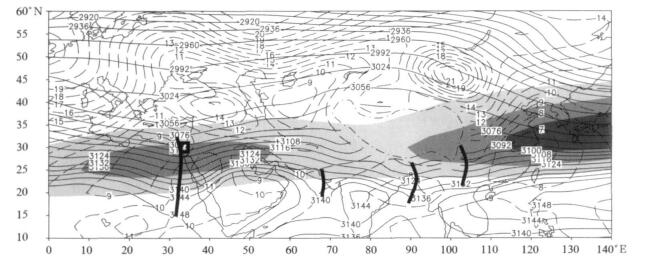
图 1 1948-2005年多年平均冬半年 (10月-次年5月)700 hPa位势高度 (实线, 单位:gpm) 及其标准差 (虚线, 单位:gpm) 和200 hPa西风急流 (阴影表示u≥30 m · s-1)
(点划线表示3000 m地形, 粗实线为槽线)
Fig. 1 Climatology of the geopotential height (solid contours, unit :gpm) and corresponding standard deviation (dashed lines, unit :gpm) at 700 hPa and the westerly jet stream (shaded area means the high speed of jet stream u≥30 m · s-1) at 200 hPa in winter (October to next May) averaged from 1948-2005(dot-dashed line indicates 3000 m topography, thick solid line indicates trough-line)
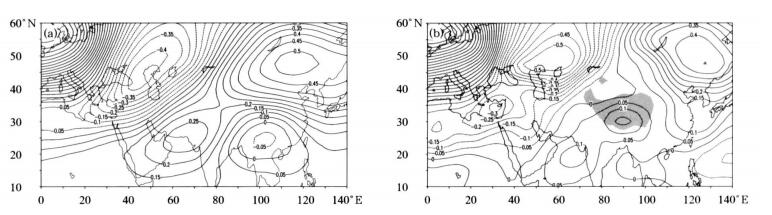
图 2 1948-2005年多年平均冬半年高度距平一点相关图 (基点:57.5°N, 0°)
(a)200 hPa, (b)700 hPa (图b中阴影表示3000 m地形)
Fig. 2 One-point correlation map between the base-point (57.5°N, 0°) and winter time geopotential height anomalies averaged from 1948-2005 at 200 hPa (a) and 700 hPa (b)(shadow in Fig.b is for the 3000 m topography)
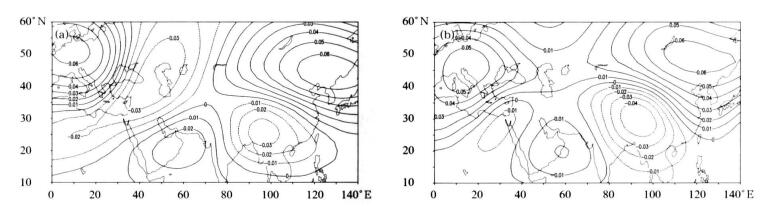
图 3 1948-2005年200 hPa高度距平标准化EOF第二模态
(a) 冬季 (11月-次年2月), (b) 春季 (3-5月)
Fig. 3 The second EOF modes based on the normalized geopotantial height anomalies at 200 hPa in winter (NDJF)(a) and spring (MAM)(b) from 1948 to 2005
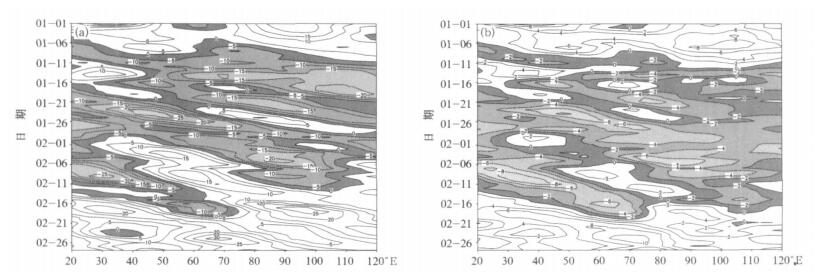
图 4 1948-2005年多年平均1月1日-2月28日位势高度距平经向-时间剖面
(a)200 hPa (沿20°~35°N), (b)700 hPa (沿20°~27.5°N)
Fig. 4 The meridion-time cross-section of the geopotential height anomalies from January 1 to February 28 averaged from 1948-2005 at 200 hPa along 20°-27.5°N (a), 700 hPa along 20°-35°N (b)
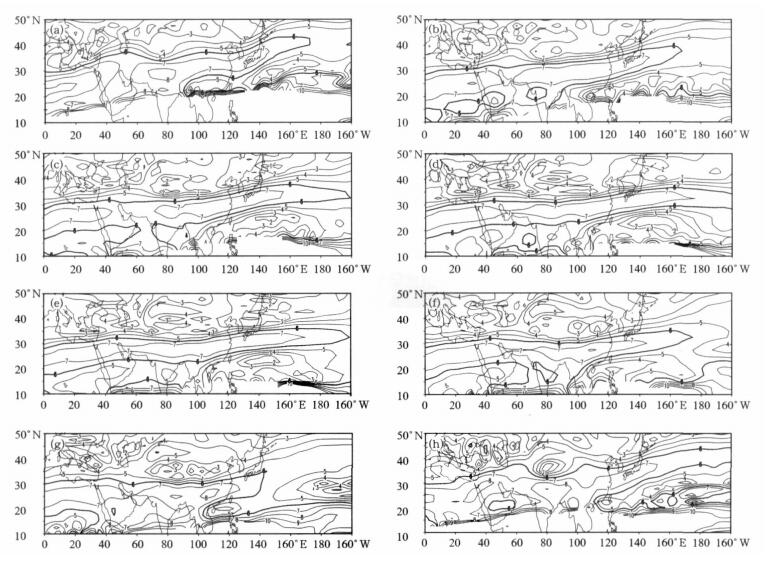
图 5 1948-2005年多年平均200 hPa局地定常Rossby波波数
(a)10月, (b)11月, (c)12月, (d)1月, (e)2月, (f)3月, (g)4月, (h)5月
Fig. 5 Distribution of the stationary Rossby wave number at 200 hPa for the period of 1948-2005 in Oct (a), Nov (b), Dec (c), Jan (d), Feb (e), Mar (f), Apr (g) and May (h)
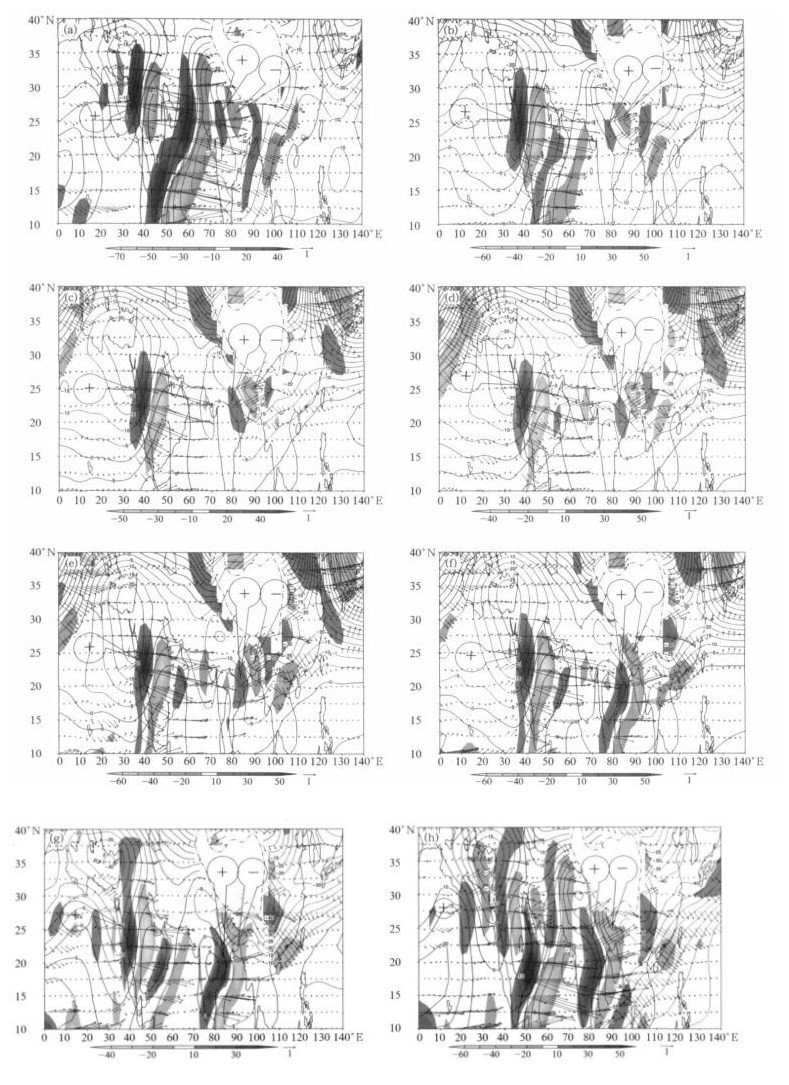
图 6 1948-2005年多年平均700 hPa水平波作用矢量 (箭矢, 单位:m2 · s-2) 及其散度(阴影表示绝对值≥10 m · s-2的散度, 单位:m · s-2) 和位势高度纬向偏差 (等值线, 单位:gpm)
(a)10月, (b)11月, (c)12月, (d)1月, (e)2月, (f)3月, (g)4月, (h)5月 (点划线表示3000 m地形; “ +”表示源, “-”表示汇)
Fig. 6 Distribution of the horizontal components of stationary Rossby wave activity flux (arrowheads, unit :m 2 · s-2) with its diver gence (shadows, divergence with its absolute value≥10 m · s-2 omitted, unit :m · s-2) and geopotential height anomalies (isolines, unit :gpm) in Oct (a), Nov (b), Dec (c), Jan (d), Feb (e), Mar (f), Apr (g) and May (h) averaged from 1948-2005 (dot-dashed line indicates the 3000 m topog raphy; " +" indicates sources and"-" indicates sinks)
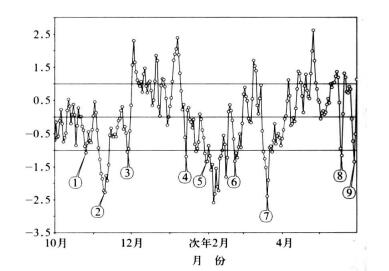
图 7 用傅利叶谐波分析滤除前2波后的冬半年南支槽指数标准化时间序列
Fig. 7 Time series of normalized winter time SBT index with the first two wave removed by Fourier harmonic analysis

图 8 700hPA南支槽最强日及前4天至后2天位势高度距平(等值线,单位:gpm)、复变温(阴影)和风场距平(箭矢,单位:s·m-1)分布
Fig. 8 Distribution of geopotential height anomaly (isolines, unit:gpm), negative anomaly of temperature (shadows) and wind anomaly (arrowheads, unit:m·-1) at 700hPa from leading 4 days to lag 2 days of the deepest SBT day
表 1 南支槽个例最强日前4天至后2天日期
Table 1 Appearing date of the deepest IBT from leading 4 days to lag 2 days

-
[1] 杨鉴初, 陶诗言, 叶笃正, 等.西藏高原气象学.北京:科学出版社, 1960.1-275 [2] 陶诗言.冬季中国上空平直西风环流条件下的西风波动.气象学报, 1956, 27:5-5 http://www.cnki.com.cn/Article/CJFDTOTAL-QXXB195604004.htm [3] 樊平.春季的"南支槽"·夏季的"南支槽"·冬季的"南支槽"∥云南省气象学会和云南省气象局.云南气象文选 (1949-1979).1980:42-53, 66-73 [4] 秦剑, 琚建华, 解明恩,等.低纬高原天气气候.北京:气象出版社, 1997.1-210 [5] 王恒康, 潘里娜, 余雄鹏.春季南支西风槽的天气气候分析.云南气象, 1991, 3:1-14 [6] Ramage C S. The relationship between the atmospheric circulation and the normal weather of the Southern Asia and the Western Pacific in winter. J Meteor, 1952, 9:403-408 doi: 10.1175/1520-0469(1952)009<0403:ROGCTN>2.0.CO;2 [7] Ding Y H. The variability of the Asian summer monsoon. J Meteor Soc Japan, 2007, 85B:21-54 doi: 10.2151/jmsj.85B.21 [8] Ambrizzi T, Hoskins B J, Hsu H H. Rossby wave propagation and teleconnection patterns in the austral winter. J Atmos Sci, 1995, 52: 3661-3672 doi: 10.1175/1520-0469(1995)052<3661:RWPATP>2.0.CO;2 [9] Yang S, Lau K M, Kim K M. Variations of the east Asian jet stream and Asian-Pacific-American winter climate anomalies. J Climate, 2002, 15L: 306-325 http://ci.nii.ac.jp/naid/80015296059/en [10] Hoskins, 孙照勃等 (译).大气中大尺度动力过程.北京:气象出版社, 1987. [11] Plumb R A. On the three-dimensional propagation of stationary waves. J Atmos Sci, 1985, 42: 217-229 doi: 10.1175/1520-0469(1985)042<0217:OTTDPO>2.0.CO;2 [12] Wallace J M, Gutzler D S. Teleconnections in the geopotential height field during the Northern Hemisphere winter. Mon Wea Rev, 1981, 109:784-812 doi: 10.1175/1520-0493(1981)109<0784:TITGHF>2.0.CO;2 [13] 李崇银.气候动力学引论 (第二版).北京:气象出版社, 2000.284-287 [14] 陶诗言.冬季由印缅来的低槽对于华南天气的影响.气象学报, 1952, 3:172-192 http://www.cnki.com.cn/Article/CJFDTOTAL-QXXB195301003.htm [15] Ding Q H, Wang Bin. Circumglobal teleconnection in the northern hemisphere summer. J Climate, 2005, 18: 3483-3505 doi: 10.1175/JCLI3473.1 [16] 雷兆崇.Plumb三维波作用通量和EP剖面图--对定常波模式输出结果的诊断分析.南京气象学院学报, 1991, 14(1):25-33 http://www.cnki.com.cn/Article/CJFDTOTAL-NJQX199101003.htm [17] 耿全震, 陈受钧.定常辐散场产生的涡源和定常波能量传播.大气科学, 1996, 20(3):298-305. http://www.cnki.com.cn/Article/CJFDTOTAL-DQXK603.004.htm -

 下载:
下载:
计量
- 摘要浏览量: 4620
- HTML全文浏览量: 953
- PDF下载量: 1186
- 被引次数: 0
