全球海气耦合模式对我国极端强降水模拟检验
Evaluation of Extreme Heavy Precipitation in Coupled Ocean-atmosphere General Circulation Models
-
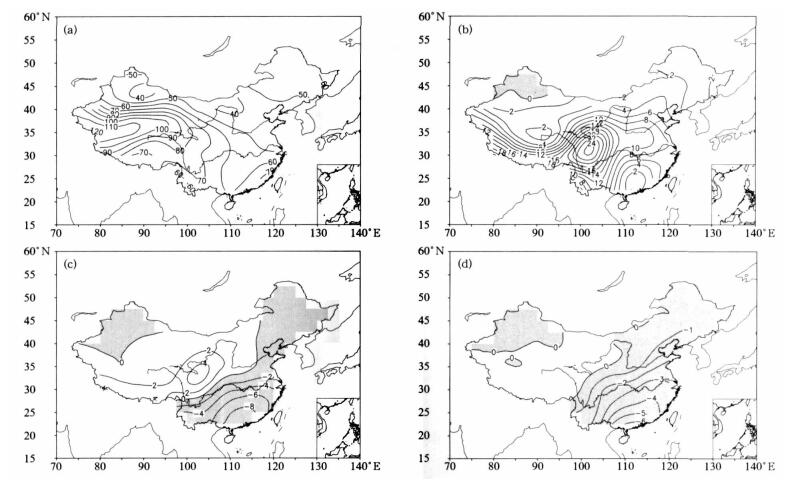
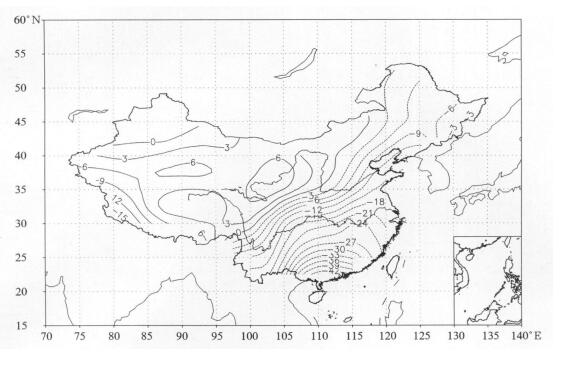
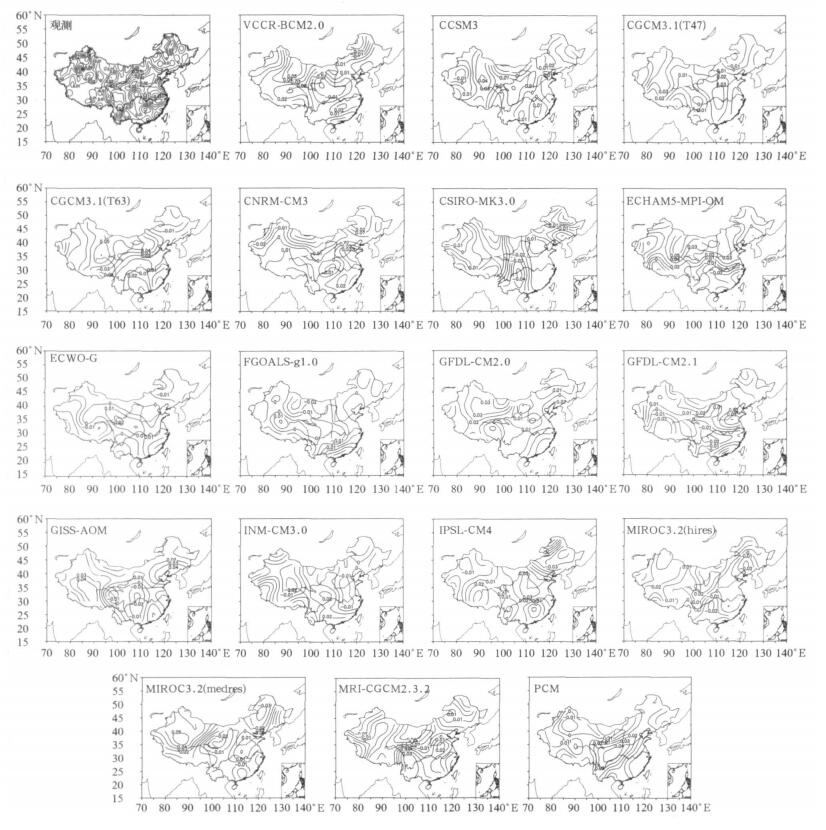
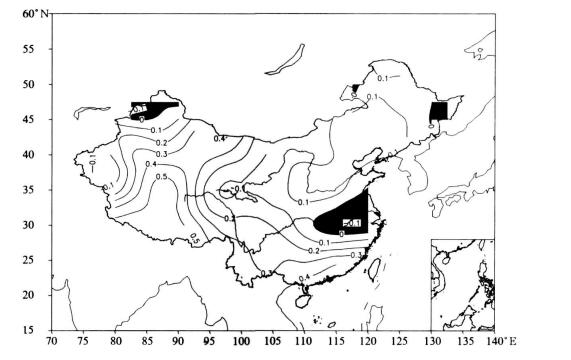
摘要: 以1961—1999年我国地面观测逐日降水资料作为观测基础, 初步分析了18个全球海气耦合模式对我国20世纪极端强降水的模拟能力。分析模式对不同级别降水的模拟发现, 各模式模拟的我国1~10 mm小雨日数普遍明显偏多; 10~25 mm中雨日数的模拟结果总体上也以偏多为主, 虽然部分模式能够模拟出我国南方存在的高值中心, 但位置偏北至长江中下游地区; 25~50 mm大雨日数在我国南方明显偏少, 并且大值中心的位置基本都没能模拟出来; 50 mm以上暴雨日数的模拟结果也明显偏小, 除MIROC3.2(hires) 外大部分模式在长江以南地区的结果都未超过2 d; 大部分模式不能正确模拟出我国东部地区大雨日数变化趋势的空间分布。进一步分析各模式对极端强降水的模拟发现:各模式极端强降水阈值明显低于观测; 半数左右的模式模拟出了1961—1999年西北西部极端降水增加的趋势, 个别模式趋势系数的大小与观测相当, 大部分模式对东北和长江中下游地区的模拟结果呈与观测反向的变化趋势, 没有模式能够模拟出我国东部地区存在的东北—华北与华中—长江中下游—华南存在的极端强降水日数增加-减少-增加-减少的空间分布; 大部分模式模拟的极端强降水日数标准差与观测结果比较接近, 这可能主要是由于对观测和各模式使用了同样的判定极端强降水发生的方法。总的来看, 全球海气耦合模式对我国极端强降水的模拟能力还有待进一步改进。Abstract: Based on the surface observation of daily precipitation from 1961 to 1999 in China, the simulation capabilities of 18 coupled ocean-atmosphere general circulation models for extreme heavy precipitation in China are evaluated.The analysis of annual rainy days with different categories precipitation in models shows that the annual rainy days with 1—10 mm daily precipitation in China are overestimated in all of the 18 models.The annual rainy days with 10—25 mm daily precipitation are also overestimated in most areas of China in most of the models and the high value center locates in South China in observation northward to the mid-low reaches of Yangtze River Basin in some models although those models are able to capture the high value centers to some extent.The annual rainy days with 25—50 mm daily precipitation are obviously underestimated especially in the southern China in the models and the locations of high value centers are missed in most of the models.The annual rainy days with daily precipitation greater than 50 mm are also obviously underestimated in all of the models, the days in the models except MIROC3.2(hires) are less than 2 days in south of the Yangtze River.And most models are not able to simulate the right spatial distribution of heavy rain trend in eastern China.The analysis of extreme heavy precipitation in models shows that the thresholds of extreme heavy precipitation are generally underestimated in all of the models; similar increase trend in west part of Northwest China to observation are obtained in about half of the models, and the trend coefficients in some individual model are close to the observation.While opposite linear trend in northeast area and mid-low reaches of the Yangtze River is produced by most of the models, and the " +-+-" spatial mode in Eastern China for the extreme heavy precipitation can not be caught hold by any model; close standard deviations of annual rainy days with extreme heavy precipitation with observation are obtained by most models, which is maybe mainly due to the same analysis method among the observation and the models.In conclusion, it is very necessary to further improve the simulating capabilities of the coupled ocean-atmosphere general circulation models for extreme heavy precipitation.
-
表 1 模式概况
Table 1 Introduction of Models

表 2 我国东部3个地区1961 — 1999年观测和模拟大雨日数变化趋势 (单位:d/a)
Table 2 Observed and simulated trends of annual rainy days with heavy precipitation in Eastern China from 1961 to 1999(unit:d/a)

-
[1] 翟盘茂, 任福民,张强.中国降水极值变化趋势检测.气象学报, 1999, 57(2):208-216 http://www.cnki.com.cn/Article/CJFDTOTAL-QXXB902.008.htm [2] 钱维宏, 符娇兰, 张玮玮, 等.近40年中国平均气候与极值气候变化的概述.地球科学进展, 2007, 22(7):673-684 http://www.cnki.com.cn/Article/CJFDTOTAL-DXJZ200707006.htm [3] 任朝霞, 杨达源.近40a西北干旱区极端气候变化趋势研究.干旱区资源与环境, 2007, 21(4):10-13 http://www.cnki.com.cn/Article/CJFDTOTAL-GHZH200704002.htm [4] 张天宇, 程炳岩, 刘晓冉.近45年长江中下游地区汛期极端强降水事件分析.气象, 2007, 33(10):80-87 http://www.cnki.com.cn/Article/CJFDTOTAL-QXXX200710013.htm [5] 张文, 寿绍文, 杨金虎.长江中下游地区汛期极端降水量的异常特征分析.气象, 2007, 33(3):61-67 http://www.cnki.com.cn/Article/CJFDTOTAL-QXXX200703008.htm [6] 马柱国, 华丽娟, 任小波.中国近代北方极端于湿事件的演变规律.地理学报, 2003, 58(增刊):69-74 http://www.cnki.com.cn/Article/CJFDTOTAL-DLXB2003S1007.htm [7] 孙凤华, 杨素英, 任国玉.东北地区降水日数、强度和持续时间的年代际变化.应用气象学报, 2007, 18(5):610-618 http://qikan.camscma.cn/jams/ch/reader/view_abstract.aspx?file_no=20070594&flag=1 [8] Rasmus E Benestad. Can we expect more extreme precipitation on the monthly time scale? J Climate, 2006, 19:630-637 doi: 10.1175/JCLI3656.1 [9] Gerald A Meehl, Francis Zwiers, Jenni Evans, et al. Trends in extreme weather and climate events: Issues related to modeling extremes in projections of future climate change. Bull Amer Meteor Soc, 2000, 81(3):427-436 doi: 10.1175/1520-0477(2000)081<0427:TIEWAC>2.3.CO;2 [10] 张勇, 许吟隆, 董文杰, 等.中国未来极端降水事件的变化——基于气候变化预估结果的分析.自然灾害学报, 2006,,15(6):228-234 http://www.cnki.com.cn/Article/CJFDTOTAL-ZRZH2006S1005.htm [11] 江志红, 丁裕国, 陈威霖.21世纪中国极端降水事件预估.气候变化研究进展, 2007, 3(4):202-207 http://www.cnki.com.cn/Article/CJFDTOTAL-QHBH200704005.htm [12] Phillips T J, Gleckler P J. Evaluation of continental precipitation in 20th century climate simulations: The utility of multimodel statistics. Water Resour Res, 2006, 42, W03202, doi: 10.1029/2005WR004313 [13] Sun Y, Solomon S, Dai A, et al. How often does it rain? J Climate, 2006, 19: 916-934 doi: 10.1175/JCLI3672.1 [14] Wang H L, Lau K M. Atmospheric hydrological cycle in the tropics in twentieth century coupled climate simulations. Int J Climatol, 2006, 26: 655-678 doi: 10.1002/(ISSN)1097-0088 [15] Cook K H, Vizy E K. Coupled model simulations of the West African monsoon system: 20th century simulations and 21st century predictions. J Climate, 2006, 19: 3681-3703 doi: 10.1175/JCLI3814.1 [16] Wang B, Kang I S, Lee J Y. Ensemble simulation of Asian-Australian monsoon variability by 11 GCMs. J Climate, 2004, 17: 803-818 doi: 10.1175/1520-0442(2004)017<0803:ESOAMV>2.0.CO;2 [17] 赵宗慈, 丁一汇, 李晓东, 等 .海气耦合模式在东亚地区的可靠性评估.应用气象学报, 1995, 6(增刊):9-18 http://www.cnki.com.cn/Article/CJFDTOTAL-YYQX5S1.001.htm [18] Iorio J P, Duffy P B, Govindasamy B, et al. Effects of model resolution and subgrid scale physics on the simulation of precipitation in the continental United States. Climate Dyn, 2004, 23: 243-258 doi: 10.1007/s00382-004-0440-y [19] Emori S, Hasegawa A, Suzuki T, et al. Validation, parameterization dependence and future projection of daily precipitation simulated with an atmospheric GCM. Geophys Res Lett, 2005, 32: L060708 https://www.researchgate.net/publication/228369243_Validation_parameterization_dependence_and_future_projection_of_daily_precipitation_simulated_with_a_high-resolution_atmospheric_GCM [20] 翟盘茂, 潘晓华.中国北方近50年温度和降水极端事件变化.地理学报, 2003,58(增刊):1-10 http://www.cnki.com.cn/Article/CJFDTOTAL-DLXB2003S1000.htm [21] Bonsal B R, Zhang X B, Vincent L A, et al. Characteristics of Daily and Extreme temperature over Canada. J Climate, 2001, 5(14): 1959-1976 doi: 10.1175/1520-0442%282001%29014%3C1959%3ACODAET%3E2.0.CO%3B2 [22] 张莉, 丁一汇, 孙颖.全球海气耦合模式对东亚季风降水模拟的检验.大气科学, 2008, 32(2):261-276 http://www.cnki.com.cn/Article/CJFDTOTAL-DQXK200802005.htm -


 设为首页
设为首页 加入收藏
加入收藏


 下载:
下载:


