
 设为首页
设为首页 加入收藏
加入收藏

近40年河北省地表干燥度的时空变化
The Spatial Distribution and Temporal Trend of Surface Aridity Index in Recent 40 Years in Hebei Province
-
摘要: 利用河北省1970-2007年48个气象台站逐日资料, 采用Penman-Monteith模型计算潜在蒸散量, 由潜在蒸散量和降水量之比构建干燥度指数, 并采用Kriging插值法进行空间插值以分析其区域特征。结果表明:1970-1985年, 由于降水量减少和潜在蒸散量减少, 蒸散量的减少速率大于降水量的减少速率, 地表干燥度指数呈下降趋势, 潜在蒸散量的显著减少是地表干燥度下降的主要原因, 而风速和日照时数的显著降低决定了潜在蒸散量的显著下降; 1986-2007年, 由于年平均气温的显著升高, 潜在蒸散量增加, 使得地表干燥度略呈上升趋势。河北省地表干燥度高值区分布在张家口地区的桑洋盆地和坝西高原, 而低值区主要在燕山南麓低山丘陵地区的承德西南部、唐山的北部和秦皇岛中北部大部分地区。干燥度减少区域主要集中在河北省东北部至河北省西部的带状区域。Abstract: Aridity index, used as an important parameter to measure regional dry and wet conditions, has become an important climatic indicator in global change research, especially widely applied in the climate change, drought and desertification research. Dry and wet changes of regional climate affect the local socio-economic and agricultural production severely, therefore attracted extensive attention and study. Hebei Province locates in the semi-arid areas, researching the temporal and spatial variation of surface aridity index there, determining the detailed climatic regionalization, will be helpful to mitigating the adverse effects of droughts and floods. The surface aridity index in Hebei Province is calculated from 1970 to 2007 on the basis of meteorological data in 48 stations, so as to investigate the impacts of climate change on surface dry-wet status. The aridity index is defined as a ratio of potential evapotranspiration to precipitation, and potential evapotranspiration is computed using FAO Penman-Monteith model. The spatial characters of aridity index are addressed by adopting Kriging interpolation, providing some decision-making evidences for the local government of Hebei Province.The results indicate that the variation of annual aridity index, potential evapotranspiration and precipitation could be divided into two periods: 1970-1985 and 1986-2007. Values of aridity index decrease generally in the period from 1970 to 1985. The decrease in potential evapotranspiration is greater than the reduction in precipitation, induced by a decrease of wind speed and hours of sunshine, particularly. The climatic tendency of aridity index is negative (-0.1/10 a), and its average value is 2.34. By contrast, the values of aridity index increase generally in the period from 1986 to 2007, which is attributed to the increase of potential evapotranspiration, caused by the significant increase of air temperature. The climatic tendency of aridity index is 0.14/10a, and its ave rage value is 2.32. Obviously, the ascent rate of yearly aridity index after 1986 is greater than decline rate of that before 1986.From 1970 to 1985, the higher values region of aridity index is located in Sangyang Basin and plateau of western dam in Zhangjiakou, mainly involving Xuanhua, Yangyuan, Huaian, Wanquan, Huailai and Zhuolu County. The range of aridity index is 2.81-3.39, and the higher values center is located in Yangyuan and Huailai County. Inversely, the lower values center of that is located in southwestern Chengde, northern Tangshan and middle-northern Qinhuangdao, mainly involving Luan county, Qian'an, Qianxi, Zunhua, Qinglong, Funing, Lulong and Xinglong county. The range of aridity index is 1.27-1.60. The overall trend of aridity index gradually increase from eastern to western, indicating that the surface wetting conditions of the eastern region is better than those of the western. Compared with the situations during 1970-1985, the increase and decrease trend of surface aridity index in Hebei Province is similar in 1986-2007. The decline region of aridity index is located in the majority of north-eastern part of Hebei Province. The decline trends of aridity index of sourthern Fuping and Laiyuan County in Taihang Mountain are significant, where the reduction value is 0.3. Inversely, the aridity index in the Kangbao, Shangyi, Zhangbei and Guyuan County in plateau of dam increase by 0.1, and it increase 0.1-0.2 in the region from southern Qinhuangdao to southern Handan, in eastern and southern Hebei respectively.
-
Key words:
- climate change;
- potential evapotranspiration;
- aridity index;
- agriculture
-
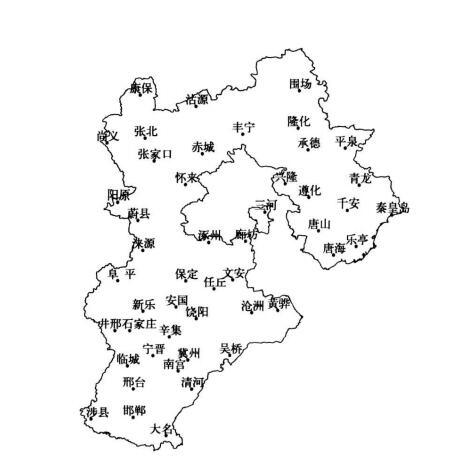
图 1 河北省气象站点的空间分布
Fig. 1 Spatial distribution of selected weather observation stations in Hebei Province
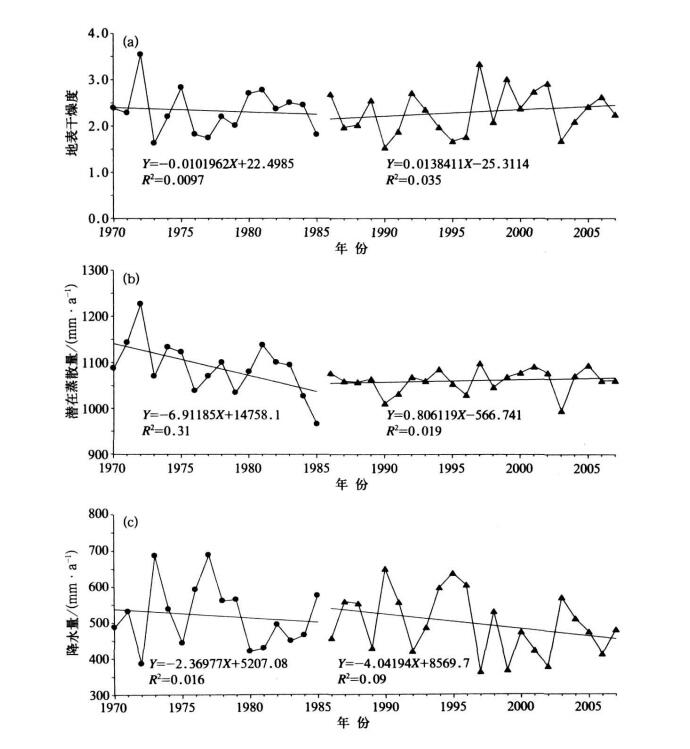
图 2 1970-2007年河北省地表干燥度(a)、潜在蒸散量(b) 和降水量(c) 变化趋势
Fig. 2 Variation trends of surface aridity index (a), potential evapotranspiration (b) and precipitation (c) in Heibei Province from 1970 to 2007
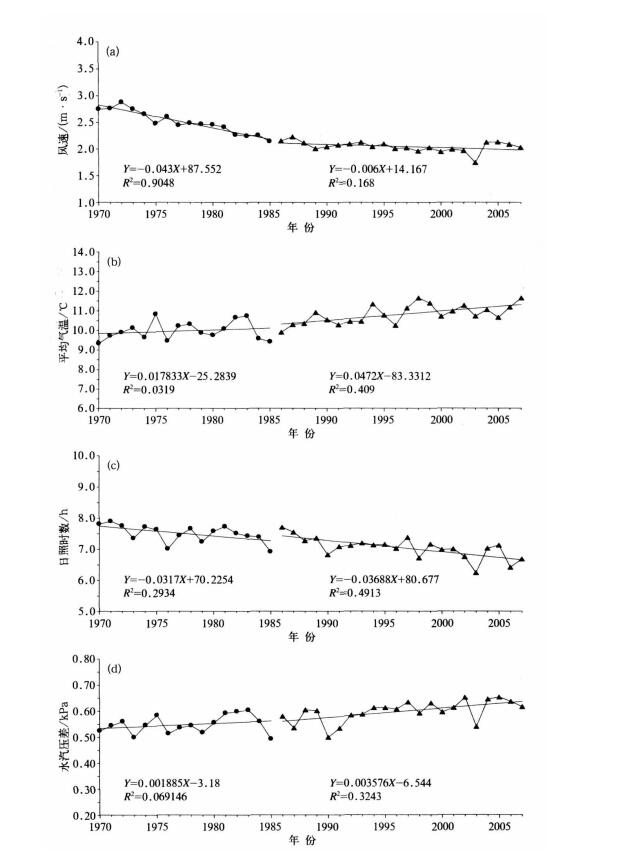
图 3 1970-2007年河北省风速(a)、平均气温(b)、日照时数(c) 和水汽压差(d) 变化趋势
Fig. 3 Variation trends of wind speed (a), mean air temperature (b), hours of sunshine (c) and vapour pressure difference (d) in Heibei Province from 1970 to 2007
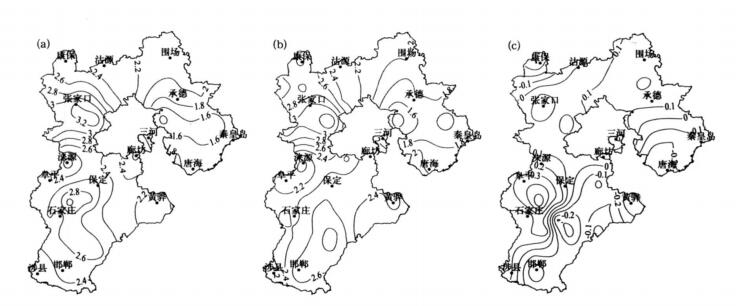
图 4 1970-1985年(a) 和1986-2007年(b) 河北省平均干燥度及其差值(c) 空间分布
Fig. 4 Spatial distribution of the mean aridity index from 1970 to 1985 (a) and that from 1986 to 2007 (b) with their difference (c) in Hebei Province
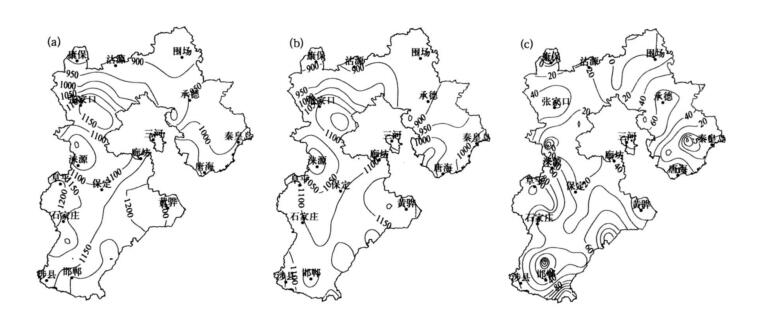
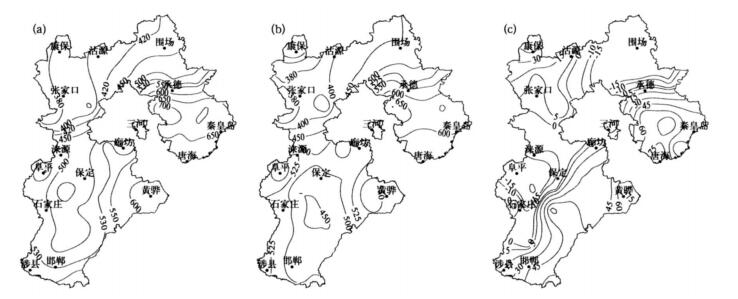
图 5 1970-1985年(a) 和1986-2007年(b) 河北省年平均潜在蒸散量及其差值(c) 空间分布(单位: mm · a-1)
Fig. 5 Spatial distribution of the mean potential evapotranspiration from 1970 to 1985 (a) and that from 1986 to 2007 (b) with their difference (c) in Hebei Province (unit:mm · a-1)
-
[1] Budyko M I. Climate and Life. Orlando: Academic Press, 1974: 1-508. [2] 孟猛, 倪键, 张治国. 地理生态学的干燥度指数及其应用评述. 植物生态学报, 2004, 28(6): 853-861. http://www.cnki.com.cn/Article/CJFDTOTAL-ZWSB200406017.htm [3] Penman H L.Natural evaporation from open water, bare soil, and grass.Proceedings Royal Society (Series A), 1948, 193: 454-465. http://rspa.royalsocietypublishing.org/content/193/1032/120 [4] Allen R G, Pereira L S, Raes D, et al. Crop Evapotranspiration-Guidelines for Computing Crop Water Requirements//FAO Irrigation and Drainage Paper 56. Rome, 1998. http://www.fao.org/docrep/X0490E/x0490e00.htm [5] Thornthwaite C W. An approach toward a rational classification of climate. Geographical Review, 1948, 38: 57-94. http://www.unc.edu/courses/2007fall/geog/801/001/www/ET/Thornthwaite48-GeogrRev.pdf [6] Holdridge L R. Determination of world plant formation from simple climatic data. Science, 1947, 105: 367-368. doi: 10.1126/science.105.2727.367 [7] Holdridge L R. Life Zone Ecology. San Jose, Costa Rica: Tropical Science Center, 1967. [8] 马柱国, 魏和林, 符淙斌. 中国东部区域土壤湿度的变化及其与气候变率的关系. 气象学报, 2000, 58(6): 278-287. http://www.cnki.com.cn/Article/CJFDTOTAL-QXXB200003002.htm [9] 郭建平, 高素华, 毛飞. 中国北方地区干旱化趋势与防御对策研究. 自然灾害学报, 2001, 10(3): 32-36. http://www.cnki.com.cn/Article/CJFDTOTAL-ZRZH200103006.htm [10] 孙力, 沈柏竹, 安刚. 中国东北地区地表干湿状况的变化及趋势分析. 应用气象学报, 2003, 14(5): 542-552. http://qk.cams.cma.gov.cn/jams/ch/reader/view_abstract.aspx?file_no=20030568&flag=1 [11] 孙永罡, 白人海, 谢安. 中国东北地区干旱趋势的年代际变化. 北京大学学报(自然科学版), 2004, 40(5): 806-813. http://www.cnki.com.cn/Article/CJFDTOTAL-BJDZ200405016.htm [12] 孙凤华, 吴志坚, 李丽光. 辽宁西部地区的气候变化及干湿状况年代际变化特征. 中国沙漠, 2006, 26(6): 969-975. http://cpfd.cnki.com.cn/Article/CPFDTOTAL-ZGQX200711004116.htm [13] Rora V K. The use of the aridity index to assess climate change effect on annual runoff. J Hydrol, 2002, 265: 164-177. http://www.sciencedirect.com/science/article/pii/S0022169402001014 [14] 杨建平, 丁永建, 陈仁升, 等. 近50年中国干湿气候界线的年际波动. 地理学报, 2002, 57(6): 655-661. http://www.cnki.com.cn/Article/CJFDTOTAL-DLXB200206003.htm [15] 杨建平, 丁永建, 陈仁升, 等. 近40a中国北方降水量与蒸发量变化. 干旱区资源与环境, 2003, 17(2): 6-11. http://www.cnki.com.cn/Article/CJFDTOTAL-GHZH200302001.htm [16] 庄立伟, 王石立. 东北地区逐日气象要素的空间插值方法应用研究. 应用气象学报, 2003, 14(5): 605-615. http://qk.cams.cma.gov.cn/jams/ch/reader/view_abstract.aspx?file_no=20030575&flag=1 [17] Richard G A, Luis S P, Dirk R, et al. Crop Evapotranspiration-Guidelines for Computing Crop Water Requirements//FAO Irrigation and Drainage Paper 56. Rome, 1998. http://www.fao.org/docrep/X0490E/x0490e00.htm [18] 马晓群, 张辉. 近30年安徽省地表干湿时空变化及对农业影响. 应用气象学报, 2007, 18(6): 784-790. http://qk.cams.cma.gov.cn/jams/ch/reader/view_abstract.aspx?file_no=200706120&flag=1 [19] 王亚平, 黄耀, 张稳. 中国东北三省1960-2005年地表干燥度变化趋势. 地球科学进展, 2008, 23(6): 619-627. http://www.cnki.com.cn/Article/CJFDTOTAL-DXJZ200806009.htm [20] 刘剑锋, 刘学锋, 刘芳圆, 等. 河北省气候干湿状况变化特征分析. 地理与地理信息科学, 2007, 23(2): 83-86;96. http://www.cnki.com.cn/Article/CJFDTOTAL-DLGT200702019.htm [21] Brutsaert W, Parlange M B. Hydrologic cycle explains the evaporation paradox. Nature, 1998, 396: 30. doi: 10.1038/23845 [22] Roderick M L, Farquhar G D.The cause of decreased pan evaporation over the past 50 years. Science, 2002, 298(15): 1410-1411. http://science.sciencemag.org/content/298/5597/1410 [23] Linacre E T. Evaporation trends theoretical and applied. Climatology, 2004, 79: 11-21. https://www.deepdyve.com/lp/springer-journals/evaporation-trends-Zq94eSiZAo [24] 邱新法, 刘昌明, 曾燕. 黄河流域近40年蒸发皿蒸发量的气候变化特征. 自然资源学报, 2003, 18(4): 437-442. http://www.cnki.com.cn/Article/CJFDTOTAL-ZRZX200304006.htm [25] 郭军, 任国玉. 黄淮海流域蒸发量的变化及其原因分析. 水科学进展, 2005, 16(5): 46-52. http://www.cnki.com.cn/Article/CJFDTOTAL-SKXJ200505008.htm [26] 安月改, 李元华. 河北省近50年蒸发量气候变化特征. 干旱区资源与环境, 2005, 19(4): 159-162. http://cpfd.cnki.com.cn/Article/CPFDTOTAL-ZGQX200610004074.htm -

 下载:
下载:
计量
- 摘要浏览量: 4035
- HTML全文浏览量: 785
- PDF下载量: 1905
- 被引次数: 0
