
 设为首页
设为首页 加入收藏
加入收藏

我国逐日降水量格点化方法
Interpolation Methods of China Daily Precipitation Data
-
摘要: 国家气象信息中心(NMIC)和美国大气海洋局气候预测中心合作开发了“中国逐日格点降水量实时分析系统(V1.0)”,并已在NMIC投入业务试运行。该系统基于我国2419个国家级地面气象站日降水量观测(08:00-08:00,北京时)数据,采用“基于气候背景场”的最优插值方法,实时生成空间分辨率为0.5°×0.5°的格点化日降水量资料。通过对汛期典型区域和单站降水过程的对比分析表明:该格点化产品的精度较高,能准确捕捉并再现每一次降水过程。误差分析表明:约91%的数据绝对误差小于1.0 mm/d。该产品在定量分析天气实况、检验天气气候模式精度、检验卫星产品精度等方面有应用前景。Abstract: Precipitation is one of the most important meteorological factors. Its spatial and temporal distribution is critical in climate diagnostics, numerical models verifications and hydrological models initiation. Substantial progress has been made in the last two decades in quantitatively documenting global precipitation. The development and operation of precipitation analysis products over China are relatively lagging behind other countries. Through the cooperation with the Climate Prediction Center (CPC) affiliated to National Oceanic and Atmospheric Administration (NOAA), the real time operational system of daily precipitation analysis over China is established in National Meteorological Information Center (NMIC). Based on the daily precipitation observations of over 2419 gauges, a system with the resolution of 0.5°×0.5° is established. It is consisted of four modules: Data obtaining, quality controlling, data processing and products serving. The kernel interpolation algorithm of this system is introduced from the CPC known as the climatological optimal interpolation (OI) method which can reduce the analysis error substantially arising from the large spatial discontinuity of precipitation. Daily climatology is defined for each station as the summation of the first 6 harmonics for the 365 calendar day time series of the mean daily precipitation, and then climatology fields are created by interpolating the truncated station climatology through the algorithm of Shepard. These fields are then adjusted by the PRISM (Parameter elevation Regressions on Independent Slopes Model) monthly precipitation climatology data, and the temporal variation patterns in the original daily climatology time series which also reflect orographic effects reasonably are retained. Analyzed fields of the ratio between daily precipitation and climatology are derived by interpolating the corresponding station values through the OI technique. Analyses of total daily precipitation are finally calculated by multiplying the daily climatology with the daily ratio. This system runs stably with reasonable products and users can get the products in three formats after 09:20 everyday on CDC website. It is an integral part of China real time and fine resolution precipitation analyses system under construction. Further improvements of the gauge based analysis will be implemented to correct the bias of wind effects. Collaborations in improving this system by refining the algorithm and merging with the satellite based precipitation products are welcome.
-
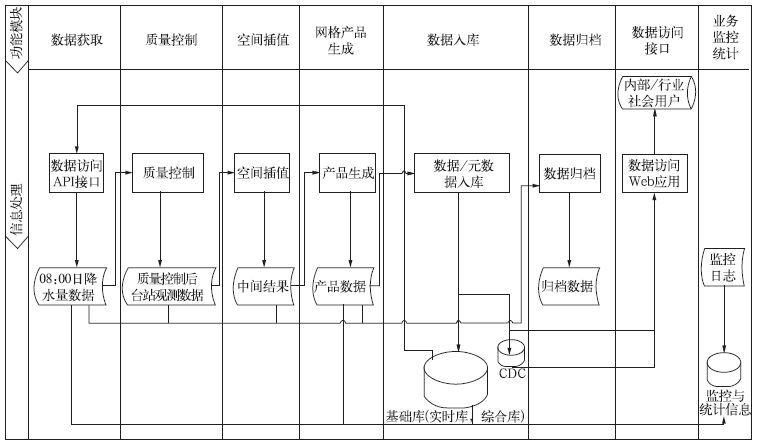
图 1 中国逐日格点降水量实时业务系统信息流程
Fig. 1 Information flow of daily precipitation analysis system over China
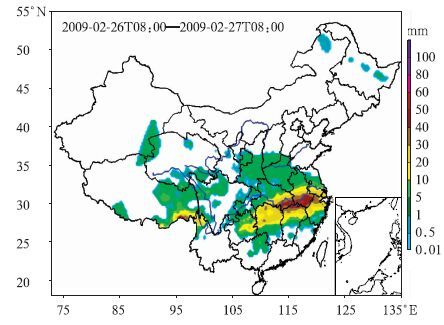
图 2 实时发布的日格点降水量图形产品 (单位:mm)
Fig. 2 Distribution map of daily precipitation analysis supplied to users (unit:mm)
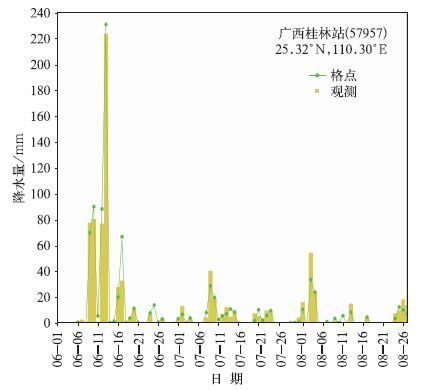
图 3 2008年6月1日—8月27日广西桂林站观测日降水量和对应格点降水量的时间序列
Fig. 3 Time series of measured daily precipitation and its grid-box analysis for Guilin Station in Guangxi from 1 June 2008 to 27 August 2008
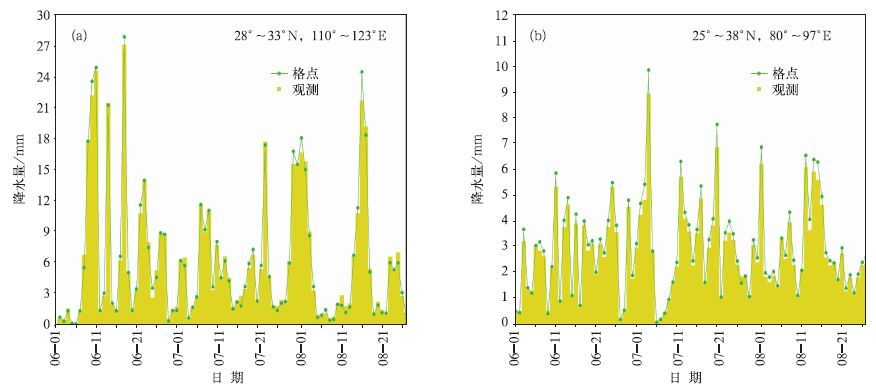
图 4 2008年6月1日—8月27日观测日降水量和对应格点降水量的时间序列 (a) 长江流域区,(b) 青藏高原区
Fig. 4 Time series of measured daily precipitation and its grid-box analysis over two researched regions from 1 June 2008 to 27 August 2008 (a) the Yangtze River Basin, (b) Tibetan Plateau region
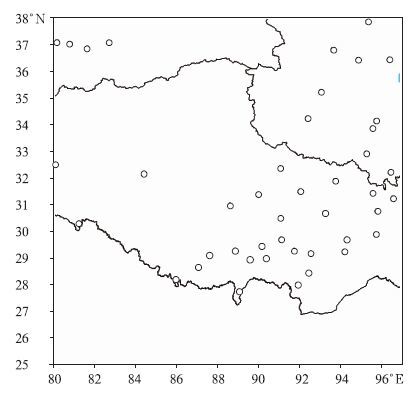
图 5 本系统中青藏高原区域的气象站点分布
Fig. 5 Distribution of meteorological stations over Tibetan Plateau in the system
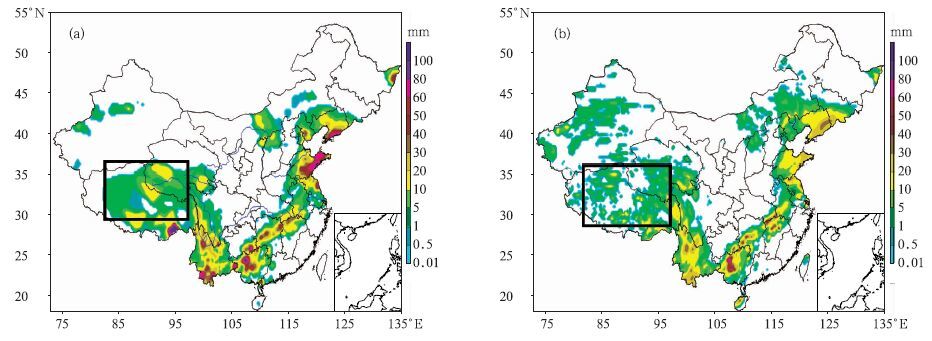
图 6 2008年8月17日08:00—18日08:00基于站点资料的日格点降水量 (a) 与卫星反演的日降水量 (b) 对比
Fig. 6 Comparison of gauge-based daily precipitation analysis (a) and its corresponding satellite product (b) from 08:00 17 August 2008 to 08:00 18 Auguest 2008
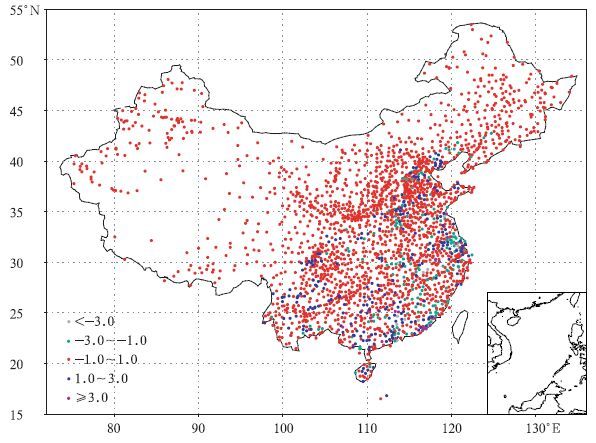
图 7 2008年6月1日—7月27日的格点降水量与站点降水量观测值之间的误差空间分布图 (单位:mm)
Fig. 7 Error spatial distribution between precipitation analysis and its observations from 1 June 2008 to 27 July 2008 (unit:mm)
表 1 不同误差范围的样本数和所占百分比 (总样本数943)
Table 1 Sample number and its percentage at each error intervals (total sample number is 943)

-
[1] Vose R S, Schm oyer R L, Steurer P M, et al. The Global Historical Climatology Network:Long-term Monthly Tem-perature, Precipitation, Sea-level Pressure, and Station Pres-sure Data.1992, 0RNL:1-325. [2] Peterson T C.Vose R S.An overview of the global historical climatology network temperature database. Bull American Meteor Soc, 1997, 78(12) :2837~2849. [3] Hulm e M .A 1951-80 global land precipitation climatology for the evaluation of general Circulation Models. Climate Dyn, 1992, 7 (1) :57-72. http://www.osti.gov/scitech/biblio/181886-global-land-precipitation-climatology-evaluation-general-circulation-models [4] Hufman G J, Adler R F, Rudolf B R, et al.TheGlobalPre cipitation Climatology Projecet(GPCP)combined precipitati on dataset.Bull Amet Meteor Soc, 1997, 78(1) :5-2O. doi: 10.1175/1520-0477(1997)078<0005:TGPCPG>2.0.CO;2 [5] Adler R F, Kidd C, Petty G, et al. Intercomparison of global grecipitation groducts:The Third Precipitation Intereompari-son Project(PIP-3) .Bull Amer Meteor Soc, 2001, 82(7) :1377-1396. doi: 10.1175/1520-0477(2001)082<1377:IOGPPT>2.3.CO;2 [6] Xie P, Arkin P A. Global Precipitation:A 17-year monthly analysis based on gauge observations, satellite estimates and numerical model outputs. Bull Arner M eteor Soc, 1997.78 (11) :2539-2558. doi: 10.1175/1520-0477%281997%29078%3C2539%3AGPAYMA%3E2.0.CO%3B2 [7] Chen M, Xie P, janowiak J E, et al.Global land precipitati-on:A 50-year monthly analysis based on gauge observations.J Hydrometeor, 2002, 3:249-266. http://www.cpc.ncep.noaa.gov/products/Soilmst_Monitoring/Papers/Chen_et_al_2002_JHM.pdf [8] 张强, 阮新, 熊安元.近57年我国气温格点数据集的建立和质量评估.应用气象学报, 2009, 20(4) :385-393. http://qikan.camscma.cn/jams/ch/reader/view_abstract.aspx?file_no=20090401&flag=1 [9] 沈艳, 熊安元, 施晓晖, 等.中国55年来地面水汽压网格数据集的建立及精度评价.气象学报, 2008, 66(2) :283-291. http://www.cnki.com.cn/Article/CJFDTOTAL-QXXB200802013.htm [10] Barrett E C, Martin D W.The User of Satellite Data in Rain-fall M onitoring.London:Academic Press, 1981. [11] Arkin P A, Ardanuy P E.Estimating climatic-scale precipita tion from space:A review.J Climate, 1989, 2:1229-1238. doi: 10.1175/1520-0442(1989)002<1229:ECSPFS>2.0.CO;2 [12] Daly C, Neilsen R P, Phillips D L.A statistical-topographic model for m apping clim atological precipitation over mountain-OUS terrain.J Appl Meteor, 1994, 33:140-158. doi: 10.1175/1520-0450(1994)033<0140:ASTMFM>2.0.CO;2 [13] Xie P P, Yatagai A, Chen M, et al.A gauge-based analysis of daily precipitation over East Asia.J Hydrometeor, 2007, 8:607-626. http://www.emc.ncep.noaa.gov/gmb/wd23ja/verify/Xie_et_al_2007_JHM_EAG.pdf [14] Shepard D.A Two Dimensional Interpolation Function for Ir regularly Spaced Data Proc 23rd National Conf of the Asso-ciation for Computing Machinery. Princeton, NJ, ACM, 1968:517-524. [15] Cressman G P.An operational objective analysis system.Man Wea Rev, 1959, 87(10) :367~374. doi: 10.1175/1520-0493%281959%29087%3C0367%3AAOOAS%3E2.0.CO%3B2 [16] Gandin L S.Objective Analysis of Meteorological Fields.Irael Program for Scientific Translations, 1965:1-242. [17] Chen M Y, Shi W, Xie P P, et al.Assessing objective tech-niques for gauge-based analyses of global daily precipitation.J Geophys Res, 2008, 113, D04110, doi:10.1029/2007JD009132. [18] 王伯民.基本气象资料质量控制综合判别法的研究.应用气象学报, 2005, 15(增刊):50~59. http://www.cnki.com.cn/Article/CJFDTOTAL-YYQX2004S1008.htm [19] 刘小宁, 鞠晓慧, 范邵华.空间回归检验方法在气象资料质量控制中的应用.应用气象学报, 2006, l7(1) :37-43. http://qikan.camscma.cn/jams/ch/reader/view_abstract.aspx?file_no=20060106&flag=1 [20] 中国气象局.地面气象观测数据文件和记录薄表格式.北京:气象出版社, 2005. [21] Joyce R J, Janowiak J E, Arkin P A, et al.CMORPH:A method that produces global precipitation estimates from pas-sive microwave and infrared data at high spatial and temporal resolution.J Hydro, 2004, 5:487-503. doi: 10.1175/1525-7541(2004)005<0487:CAMTPG>2.0.CO;2 [22] 蔡敏, 丁裕国, 江志红.我国东部极端降水时空分布及其概率特征.高原气象, 2007, 26(2) :309-318. http://www.cnki.com.cn/Article/CJFDTOTAL-GYQX200702012.htm [23] 江志红, 丁裕国, 陈威霖.21世纪中国极端降水事件预估.气候变化研究进展, 2007, 3(4) :202-207. http://www.cnki.com.cn/Article/CJFDTOTAL-QHBH200704005.htm [24] 孙风华, 杨素英, 任国玉.东北地区降水日数、强度和持续时间的年代际变化.应用气象学报, 2007, 18(5) :610-618. http://qikan.camscma.cn/jams/ch/reader/view_abstract.aspx?file_no=20070594&flag=1 [25] 岳彩军, 寿亦萱, 寿绍文, 等.湿Q矢量释用技术及其在定量降水预报中的应用.应用气象学报, 2007, 18(5) :666-675. http://qikan.camscma.cn/jams/ch/reader/view_abstract.aspx?file_no=200705101&flag=1 [26] Shen Y, Xiong A, Wang Y, et al.Performance of high-reso-lution satellite precipitation products over China.J Geophys Res, 2010, 115, D02114, doi:10.1029/2009JD012097. -

 下载:
下载:
计量
- 摘要浏览量: 5338
- HTML全文浏览量: 1006
- PDF下载量: 3687
- 被引次数: 0
