
 设为首页
设为首页 加入收藏
加入收藏

Synoptic Scale and Mesoscale Characteristics of 7·17 Urumqi Heavy Rainfall in 2007
-
摘要: 新疆位于半干旱地区,2007年7月13—18日新疆沿天山一带多站出现暴雨。利用每分钟与小时降水资料、常规地面与高空观测资料、NCEP 1°×1°再分析资料、静止卫星云图资料与雷达资料进行分析,重点考察2007年7月16—17日乌鲁木齐暴雨过程 (7·17暴雨) 的天气尺度及中尺度特征,并与1996年同期暴雨过程以及我国东部暴雨过程进行对比。结果表明:该降水是一次大尺度斜压过程,中亚低涡是该暴雨过程的主要影响系统,但其位置、形态与强度均不同于1996年过程;干冷空气侵入加强了大气的对流性不稳定,对暴雨的加强和发展起重要作用;该暴雨过程的水汽主要来自于青藏高原东部—甘肃西部一线以及南疆北部;该暴雨过程中有明显的γ-中尺度对流雨团发生,径向速度辐合可能是γ-中尺度对流雨团的重要触发机制。Abstract: Xinjiang is located in a semi-arid area, but a heavy rainfall event occurs unexpectedly along the Tianshan Mountains in Xinjiang during 13—18 July 2007. The circulation and the persistent mechanism of the low vortex as well as the mesoscale characteristics for the heavy rainfall in Urumqi during 16—17 July 2007 are analyzed and compared with one similar case in the same period of 1996, by use of the 1-hour and 1-minute precipitation data, geostationary satellite images, conventional surface and upper data, NCEP 1°×1° reanalysis data and the new generation Doppler radar data. The results are as follows: The heavy rainfall takes place under the favorable large-scale circumfluence. It is a large scale heavy rainfall which is related to the baroclinic disturbance. The central-Asian vortex is the major influential system, but the location, form and intensity are different from those of the cases in 1996. The atmospheric stratification turns unstable, but it is weaker comparing with the heavy rainfall in the eastern part of China. The characteristics of the stability are different during different rainfall periods, exhibiting the pattern of both stratiform and convective precipitation. The intrusion of the cold and dry air strengthens the instability of the atmosphere, and plays an important role for the heavy rainfall. The long maintenance of the vortex after the landing in Xinjiang is associated with the high PV anomaly (dry and cold air intrusion) in the upper-middle troposphere. Strong moisture convergence develops rapidly at lower level and the water mainly comes from the eastern part of the Tibetan Plateau, western part of Gansu Province and the north of the Southern Xinjiang Basin. The satellite and radar images show that there are obvious meso-γ-scale convective rainy cluster with characteristics of the echo pendency, vertical wind shear, but they are much weaker than those heavy rainfall systems in the east region of China. Radar radial base velocity products reveal that the mesoscale radial convergence may be the important trigger mechanism for the mesoscale convective rain cluster. Compared with the rainfall in eastern China, the rainfall in Xinjiang shows the characteristics of both synoptic scale and mesoscale. The water sources are less abundant and the convergence is more important. The instability of atmospheric stratification is not so strong without obvious low-level jet. The intrusion of the cold and dry air comes from the middle level of the troposphere. The mesoscale convective rainy-clusters have the characteristics of the mesoscale convective clouds, but the convection is not too intense as the cloud top black body temperature of the cloud clusters is not too low, and the vertical height of strong echo is not too high, either.
-
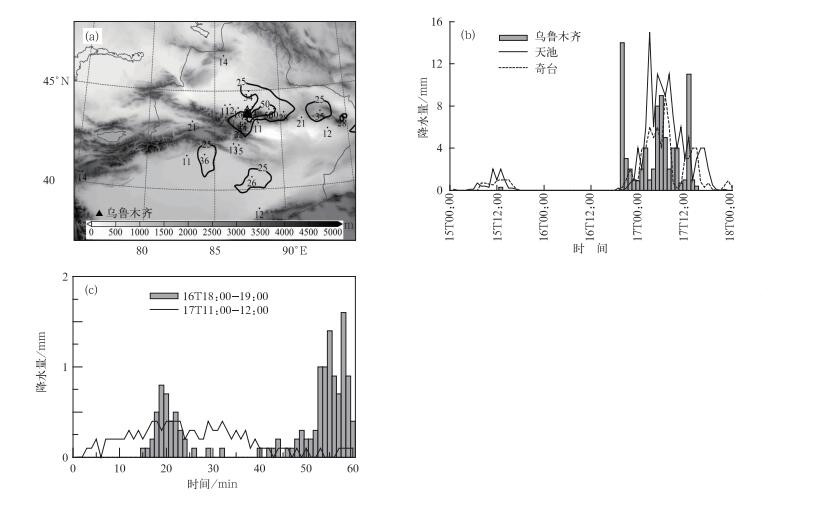
图 1 2007年7月15—18日新疆降水分布
(a)16日08:00—17日08:00降水量超过10 mm站点 (阴影代表地形高度),(b) 7月15日00:00—18日00:00逐小时降水量演变,(c) 乌鲁木齐7月16日18:00— 19:00和7月17日11:00-12:00分钟降水量演变
Fig. 1 Rainfall distribution in Xinjiang for 15—18 July 2007 (a) stations of the rainfall exceeding over 10 mm from 08:00 16 July to 08:00 17 July (the shaded denotes the topographic height), (b) the evolution of the rainfall from 00:00 15 July to 00:00 18 July, (c) the evolution of the rainfall at Urumqi in July 2007
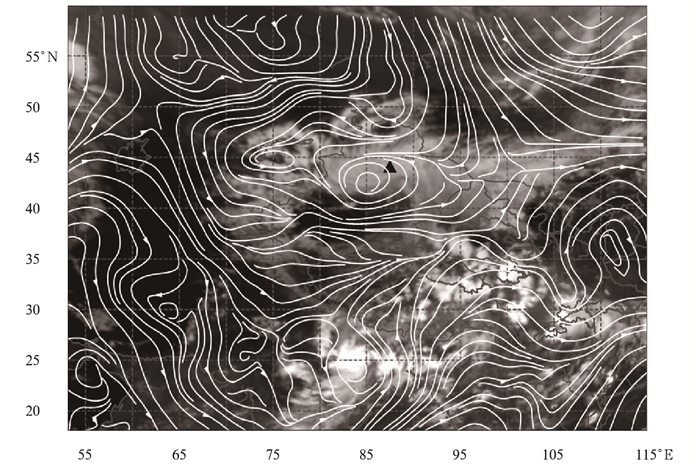
图 2 2007年7月16日20:00 500 hPa流场与18:00 FY-2C红外云图 (▲为乌鲁木齐)
Fig. 2 Flow field of 500 hPa at 20:00 16 July 2007 and FY-2C infrared satellite image at 18:00 16 July 2007 (▲ denotes Urumqi)
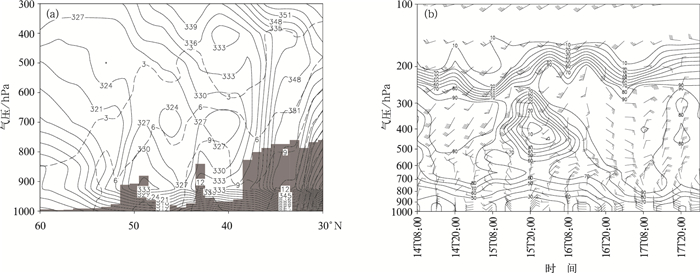
图 3 2007年7月16日20:00沿87°E假相当位温 (实线,单位:K) 和比湿 (虚线,单位:10-3 kg·kg-1) 经向剖面 (阴影代表地形)(a) 及2007年7月14—17日新疆乌鲁木齐所在位置 (43.5°N,87.4°E) 水平风场和相对湿度 (单位:%) 的时间-高度演变 (b)
Fig. 3 Meridional cross section along 87°E of the pseudo-potential temperature (solid lines, unit: K) and specific humidity (dashed lines, unit: 10-3 kg·kg-1) at 20:00 16 July 2007(the shaded denotes the topography) (a), time-height evolution of the horizontal wind field and the relative humidity (unit:%) over Urumqi (43.5°N, 87.4°E) during 14—17 July 2007 (b)
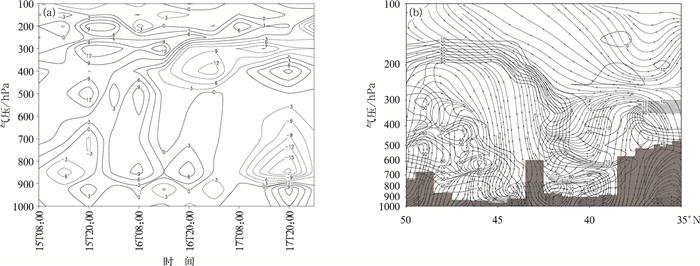
图 4 2007年7月15—17日乌鲁木齐所在位置 (43.5°N,87.4°E) 温度平流 (单位:10-5 K·s-1)(a), 7月16日20:00沿87.4°E的相对湿度 (等值线,单位:%) 和v-ω风场垂直剖面 (流线) (阴影代表地形)(b)
Fig. 4 Temperature advection (unit: 10-5 K·s-1) over Urumqi (43.5°N, 87.4°E) during 15—17 July 2007(a) and vertical cross section of the relative humidity (isolines, unit: %) and v-ω wind (streamlines) fields along 87.4°E at 20:00 16 July 2007 (the shaded denotes the topography) (b)
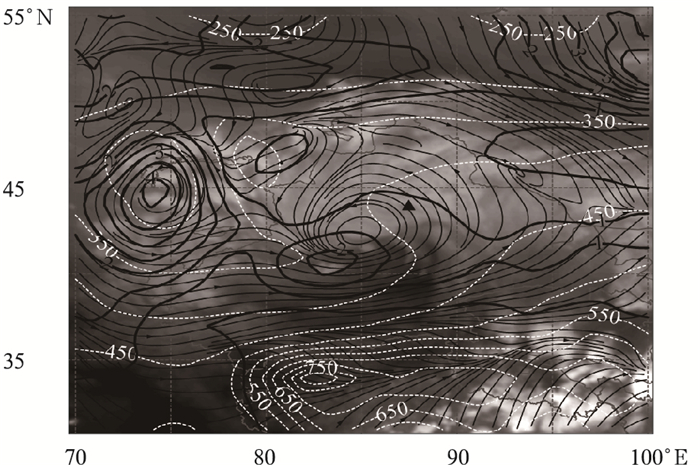
图 5 2007年7月16日18:00 FY-2C水汽图像与20:00 330 K等熵面流线、等压线 (点线, 单位:hPa) 和位涡 (黑色实线,单位:PVU) 分布 (▲为乌鲁木齐)
Fig. 5 FY-2C water vapor image at 18:00 16 July 2007 and streamlines, the isobar (dot lines, unit: hPa) and the potential vorticity (black solid lines, unit: PVU) at 330 K isentropic surface at 20:00 16 July 2007(▲ denotes Urumqi)
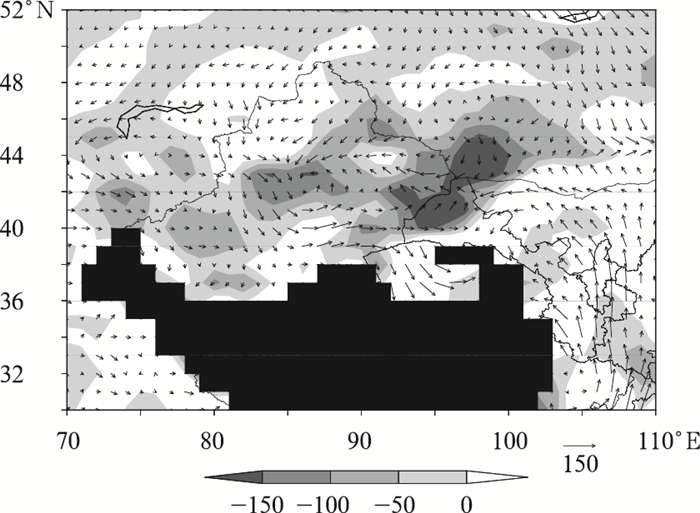
图 6 2007年7月16日20:00 700 hPa水平水汽通量 (单位:g·cm-1·s-1·hPa-1) 和整层水汽通量散度 (灰色阴影,单位:10-2 g·cm-2·s-1)
(黑色阴影为高度大于3000 m区域)
Fig. 6 Distribution of the horizontal moisture flux at 700 hPa (unit:g·cm-1·s-1·hPa-1) and divergence of moisture flux in the whole layer (gray area, unit: 10-2 g·cm-2·s-1) at 20:00 16 July 2007
(the black area shows topography more than 3000 m)
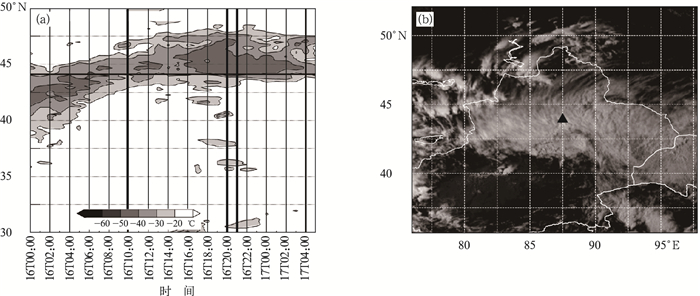
图 7 2007年7月FY-2C TBB沿87.5°E经向-时间演变与增强可见光云图
(a)16—17日FY-2C TBB沿87.5°E经向-时间演变 (单位:℃;黑色粗横线为乌鲁木齐位置,黑色粗竖线为4个乌鲁木齐每小时降水超过5 mm的时次),(b)16日18:00增强可见光云图 (▲为乌鲁木齐)
Fig. 7 FY-2C TBB evolution and visible satellite image in July 2007
(a) FY-2C TBB evolution during 16—17 July (unit: ℃; the black horizontal line denotes the position of Urumqi, the four black vertical lines denote the time that the precipitation per hour exceeding 5 mm) along 87.5°E, (b) enhanced visible satellite image at 18:00 16 July 2007 (▲ denotes Urumqi)
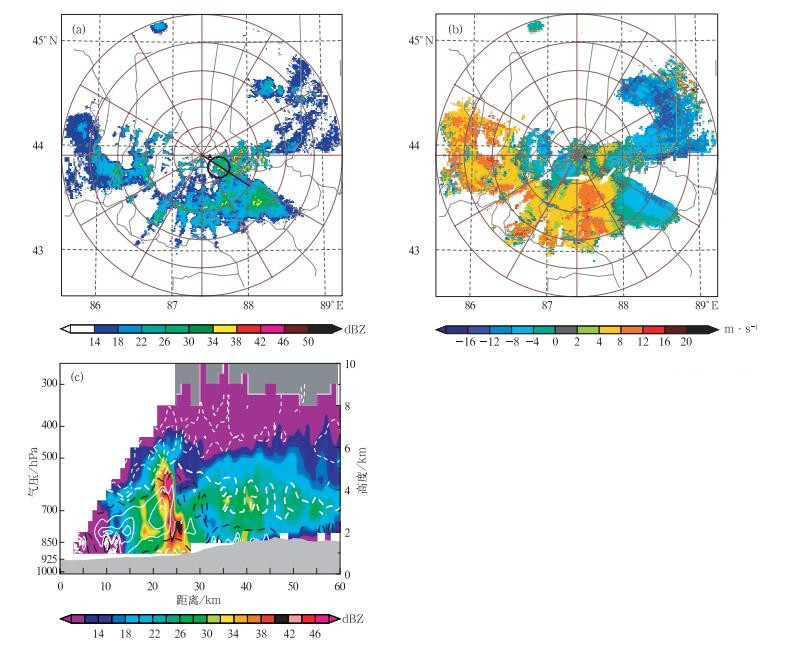
图 8 2007年7月16日18:46—18:51乌鲁木齐雷达观测图像 (a)1.5°仰角反射率因子, (b)1.5°仰角径向速度 (白色箭头表示风向), (c) 沿122°方位角 (图a中黑色实线) 反射率因子 (彩色填充区) 与径向速度 (等值线,单位:m·s-1) 垂直剖面 (填充灰度为地形高度)
Fig. 8 Radar images observed at Urumqi for 18:46—18:51 16 July 2007 (a) reflectivity at 1.5° elevation, (b) radial base velocity at 1.5° elevation (the white arrows denote the wind directions), (c) vertical section of reflectivity and radial base velocity (isolines, unit:m·s-1) along the black solid line in Fig. 8a (azimuth: 122°; the shaded denotes topography)
-
[1] 张家宝, 邓子风.新疆降水概论.北京:气象出版社, 1987: 4-7;89-117. [2] 史玉光, 孙照渤, 杨青.新疆区域面雨量分布特征及其变化规律.应用气象学报, 2008, 19(3): 326-332. http://qikan.camscma.cn/jams/ch/reader/view_abstract.aspx?file_no=20080354&flag=1 [3] 蒋军, 谭艳梅, 李如琦. 2004年7月新疆特大暴雨过程的诊断分析.新疆气象, 2005, 28(4): 4-6. http://www.cnki.com.cn/Article/CJFDTOTAL-XJQX200504002.htm [4] 李霞, 白慧星, 汤浩.新疆"96.7"大暴雨过程中主要天气系统结构的天气动力学分析.新疆气象, 1997, 20(5): 10-12. http://www.cnki.com.cn/Article/CJFDTOTAL-XJQX199705003.htm [5] 王旭, 马禹, 赵兵科, 等.新疆"96.7"特大暴雨水汽输送通道研究.新疆气象, 1999, 22(5): 5-8. http://www.cnki.com.cn/Article/CJFDTOTAL-XJQX199905001.htm [6] 陈永林, 杨引明, 曹晓刚, 等.上海"0185"特大暴雨的中尺度强对流系统活动特征及其环流背景的分析研究.应用气象学报, 2007, 18(1): 29-35. http://qikan.camscma.cn/jams/ch/reader/view_abstract.aspx?file_no=20070106&flag=1 [7] 王瑾, 蒋建莹, 江吉喜. "7.18"济南突发性大暴雨特征.应用气象学报, 2009, 20(3):295-302. http://qikan.camscma.cn/jams/ch/reader/view_abstract.aspx?file_no=20090305&flag=1 [8] 郭虎, 段丽, 杨波, 等. 0679香山局地大暴雨的中小尺度天气分析.应用气象学报, 2008, 19(3):265-275. http://qikan.camscma.cn/jams/ch/reader/view_abstract.aspx?file_no=20080346&flag=1 [9] 何立富, 陈涛, 周庆亮, 等.北京"7.10"暴雨β-中尺度对流系统分析.应用气象学报, 2007, 18(5): 655-665. http://qikan.camscma.cn/jams/ch/reader/view_abstract.aspx?file_no=200705100&flag=1 [10] 祁秀香, 郑永光. 2007年夏季我国深对流活动时空分布特征.应用气象学报, 2009, 20(3): 286-294. http://qikan.camscma.cn/jams/ch/reader/view_abstract.aspx?file_no=20090304&flag=1 [11] 陶诗言.中国之暴雨.北京:科学出版社, 1980: 7-8. [12] 丁一汇.暴雨和中尺度气象学问题.气象学报, 1994, 52(3):274-284. doi: 10.11676/qxxb1994.036 [13] 方宗义, 覃丹宇.暴雨云团的卫星监测和研究进展.应用气象学报, 2006, 17(5): 583-593. http://qikan.camscma.cn/jams/ch/reader/view_abstract.aspx?file_no=200605100&flag=1 [14] 庄薇, 刘黎平, 王楠.新疆地区一次对流性降水的三维中尺度风场研究.应用气象学报, 2006, 17(4): 444-451. http://qikan.camscma.cn/jams/ch/reader/view_abstract.aspx?file_no=20060475&flag=1 [15] 郑永光, 王洪庆, 陶祖钰, 等. Windows下二维气象绘图软件——客观分析诊断图形系统.气象, 2002, 28(3): 42-45. doi: 10.7519/j.issn.1000-0526.2002.03.009 [16] 郑永光, 陈炯, 王洪庆, 等.一个气象数据分析绘图软件的设计与开发.应用气象学报, 2004, 15(4): 506-509. http://qikan.camscma.cn/jams/ch/reader/view_abstract.aspx?file_no=20040462&flag=1 [17] Kalnay E, Kanamitsu M, Kistler R, et al. The NCAR/NCEP 40-year reanalysis project. Bull Amer Meteor Soc, 1996, 77(3):437-471. doi: 10.1175/1520-0477(1996)077<0437:TNYRP>2.0.CO;2 [18] 郑永光, 朱佩君, 白洁, 等. Windows下静止卫星云图处理软件.气象, 2003, 29(6): 16-21. doi: 10.7519/j.issn.1000-0526.2003.06.004 [19] 郑永光, 陈炯, 朱佩君.改进的静止卫星云图软件处理系统.气象, 2007, 33(12): 103-109. doi: 10.7519/j.issn.1000-0526.2007.12.016 [20] 郑永光, 张春喜, 陈炯, 等.用NCEP资料分析华北暖季对流性天气的气候背景.北京大学学报 (自然科学版), 2007, 43(5): 600-608. http://www.cnki.com.cn/Article/CJFDTOTAL-BDXP200701001.htm [21] Hoskins B J, McIntyre M E, Robertson A W. On the use and significance of isentropic potential vorticity maps. Q J R Meteorol Soc, 1985, 111: 877-946. doi: 10.1002/qj.49711147002 [22] Santurette P, Georgiev C G. Weather Analysis and Forecasting: Applying Satellite Water Vapor Imagery and Potential Vorticity Analysis. Burlington: Elsevier Academic Press, 2005: 1-13. [23] 丁一汇, 马晓青. 2004/2005年冬季强寒潮事件的等熵位涡分析.气象学报, 2007, 65(5): 695-707. doi: 10.11676/qxxb2007.065 -

 下载:
下载:
计量
- 摘要浏览量: 4065
- HTML全文浏览量: 958
- PDF下载量: 1602
- 被引次数: 0
