A Circulation Index Reflecting the Monsoon Precipitation of South China
-
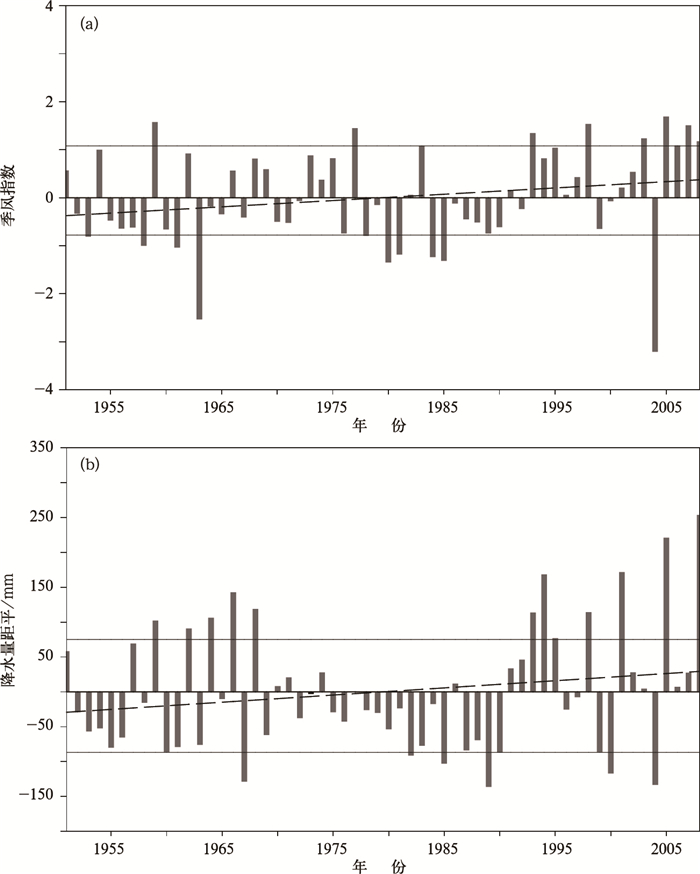
摘要: 利用NCEP再分析资料及台站和格点降水量资料分析了华南季风降水与周边大气环流的关系,并由此建立了反映6月华南降水强度的季风指数,这一季风指数利用菲律宾及其以东与华南850 hPa涡度差定义。华南季风指数具有很好的区域代表性,华南季风指数与亚洲格点日降水量的主要正相关区集中在华南。华南季风指数可以很好地描述华南降水的年际变化和极端年份,季风指数强 (弱) 的年份也是华南降水偏多 (少) 的年份,极端的华南季风指数年份对应极端的华南降水年份。华南季风指数高与低年份对应的华南降水量差值通过了0.01的显著性检验。在年代际尺度上,季风指数强 (弱) 的年代与华南降水偏多 (少) 的年代有很好的对应关系。华南季风指数包含了西南季风、副热带高压以及中高纬度西风槽等各影响系统的信息,可在业务上使用。Abstract: The South China monsoon precipitation and the monsoon over South China attract much attention. Using the NCEP reanalysis data and precipitation data of stations and grid, the relationship between the South China monsoon precipitation and atmospheric circulation are analyzed, and then a monsoon index of South China which can reflect the intensity of South China monsoon precipitation in June is established. The monsoon index of South China is defined based on the difference of 850 hPa vorticity between the subtropical Northwest Pacific near the Philippine Islands and the South China area. Then the relationship between this index and the South China monsoon precipitation are explored. The results indicate the monsoon index of South China has very good regional representative, the positive correlation coefficient between the monsoon index of South China and grid daily precipitation of Asia is mainly located in South China. The monsoon index of South China could fairly describe the inter-annual variability and extreme year of the precipitation. When the monsoon index of South China is stronger (weaker), the precipitation of South China is more (less) correspondingly, and extreme of the monsoon index of South China also means the extreme of precipitation. The difference of the precipitation over South China between high and low monsoon index of South China is significant at 0.01 level. On inter-decadal scales, the decade in which the monsoon index of South China is stronger (weaker) is also the decade in which the precipitation of South China is more (less).The relationship between the monsoon index of South China and the atmospheric circulation are also studied. The results indicate that the monsoon index of South China also includes the information of the important influencing systems such as southwest monsoon, the Pacific Subtropical High, the westerly trough over the middle-high latitudes, and so on. In the southeastern part of South China, there is abnormal anticyclonic circulation in lower and middle atmosphere, its center locates in the oceans of the east Philippines and its western end of the ridge locates in the Indo-China Peninsula. In the lower atmosphere at 850 hPa, there are abnormal depression circulations in South China. However, there is an abnormal westerly trough in the southwest China in the middle-higher atmosphere at 500 hPa. The monsoon index of South China is defined by the characteristics of circulations affecting June precipitation in South China. The changes of June precipitation in South China can better be described by the monsoon index of South China, and the characteristics of the monsoon circulation system affecting the precipitation in South China can also be expressed, demonstrating a concise objective and quantitative indicator for studying monthly scale monsoon and precipitation in South China. Therefore, the monsoon index of South China has significance of operational use.
-
Key words:
- monsoon precipitation of South China;
- monsoon index;
- summer;
- vorticity
-
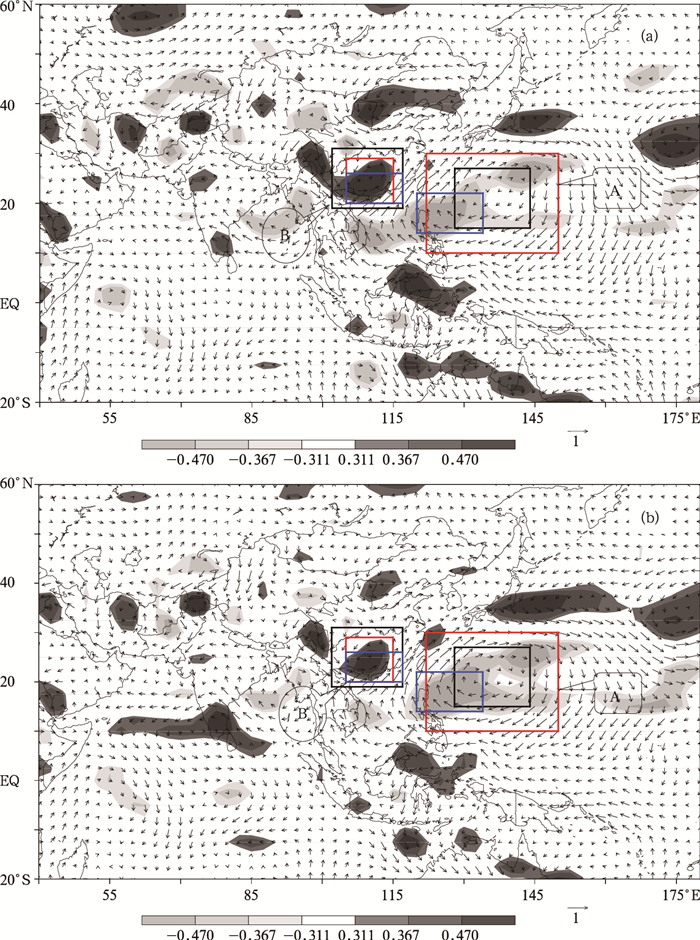
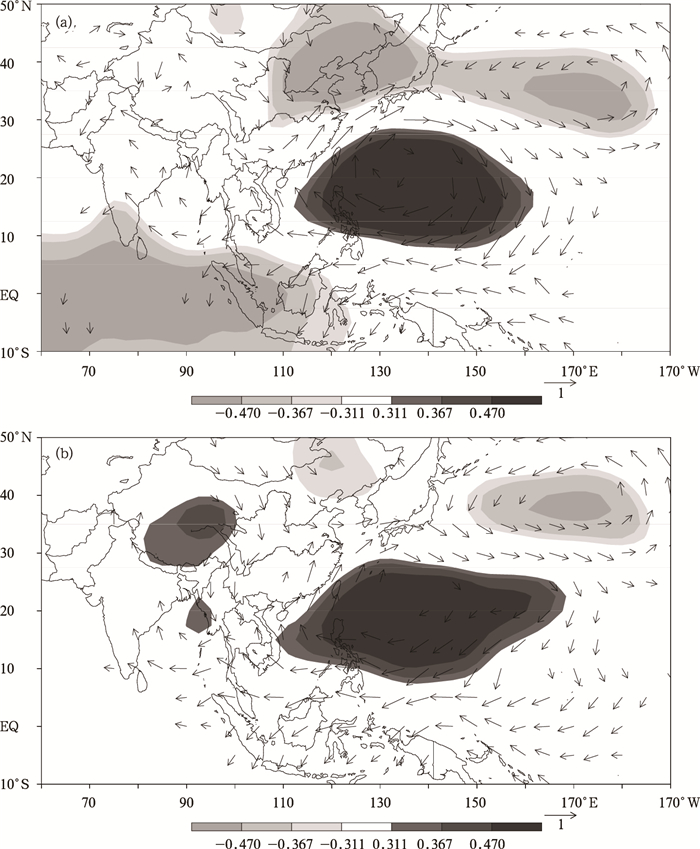
图 2 1978—2006年6月华南区域降水量 (a) 和暴雨以上降水量 (b) 与850 hPa涡度 (阴影) 相关及与经向风、纬向风的相关矢量分布
(纬向风相关系数>0( < 0) 取x方向的正 (负) 值,经向风相关系数>0( < 0) 取y方向的正 (负) 值;相关系数的绝对值为0.311, 0.367和0.470分别通过了0.01, 0.05和0.01的显著性检验;3个不同方框分别为计算华南季风指数的3种不同方案的区域范围,红、黑、蓝色方框分别为方案1,2,3的区域范围)
Fig. 2 Spatial distribution of correlation coefficients based on 850 hPa vorticity (shaded) and wind vector related to precipitation (a) and extreme precipitation (b) over South China in June during 1978—2006
(correlation coefficients to zonal wind >0 (<0) taking x direction positive (negative) value, the coefficients to meridional wind >0 (<0) taking y direction positive (negative) value; absolute values 0.311, 0.367, 0.470 indicate coefficients reaching 0.01, 0.05, 0.01 levels, respectively; three boxes indicate the selected 3 areas, the red, black, blue boxes are scheme 1,scheme 2, scheme 3)
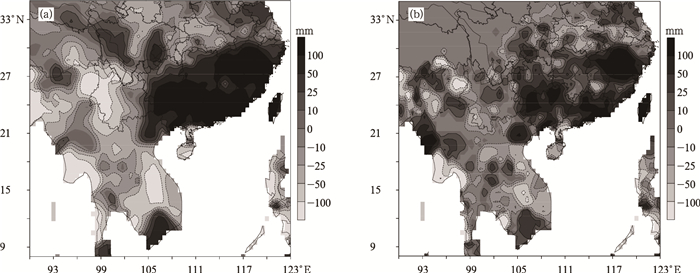
图 5 1978—2006年6月华南季风指数与降水量的相关分布
(a) 总降水量,(b) 暴雨以上量级降水量 (相关系数绝对值达到0.311, 0.367, 0.470分别表示通过了0.1, 0.05, 0.01的显著性检验)
Fig. 5 Spatial distribution of correlation coefficients of South China monsoon index to total precipitation (a) and extreme precipitation (b) in June during 1978—2006(absolute values 0.311, 0.367, 0.470 indicate correlation coefficients reaching 0.1, 0.05, 0.01 levels, respectively)
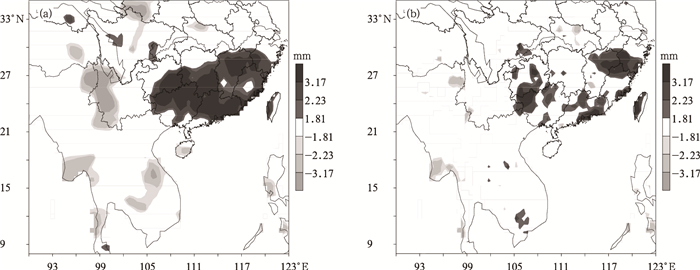
图 7 高与低季风指数对应的6月降水量的差值t检验分布 (a) 总降水量, (b) 暴雨以上量级降水量
(t检验的绝对值为1.81, 2.23, 3.17分别表示通过了0.1, 0.05, 0.01的显著性检验)
Fig. 7 Distribution of t-test of precipitation difference between high and low monsoon indexes over South China
(absolute values 1.81, 2.23, 3.17 indicate t-test reaching 0.1, 0.05, 0.01 levels, respectively)
图 8 1978—2006年6月华南季风指数与亚洲—西北太平洋地区高度场相关 (阴影) 和该月季风指数与亚洲—西北太平洋地区纬向风及经向风的相关矢量分布 (a) 850 hPa, (b) 500 hPa (纬向风相关系数> 0( < 0) 取x方向的正 (负) 值,经向风相关系数> 0( < 0) 取y方向的正 (负) 值;相关系数的绝对值为0.311, 0.367, 0.470分别表示通过了0.1, 0.05, 0.01的显著性检验)
Fig. 8 Spatial distribution of correlation coefficients of the June South China monsoon index to June height (shaded) over Asia—Northwest Pacific region, and spatial distribution of correlation coefficient vectors of June monsoon index to June zonal and meridional wind during 1978—2006 (a) 850 hPa, (b) 500 hPa
(correlation coefficients to zonal wind >0 (<0) taking x direction positive (negative) value, the coefficients to meridional wind >0 (<0) taking y direction positive (negative) value; absolute values 0.311, 0.367, 0.470, indicate correlation coefficients reaching 0.1, 0.05, 0.01 levels, respectively)
表 1 所选区域6月850 hPa涡度与华南降水量相关分析
Table 1 Correlation coefficients of regional 850 hPa vorticities and the precipitation over South China in June
降水量 涡度 (B区) 涡度 (A区) 涡度差 (B区-A区) 总降水量 0.5910 -0.5832 0.6818 暴雨以上降水量 0.5205 -0.6278 0.7052 表 2 方案2和方案3所选区域的6月850hPa涡度与华南区域降水量相关分析
Table 2 Correlation coefficients of the precipitation over South China and selected 850 hPa vorticities (Scheme 2 and Scheme 3) in June
方案 降水量 涡度 B区 A区 B区-A区 方案2 总降水量 0.6315 -0.4895 0.6548 暴雨以上降水量 0.5615 -0.6108 0.7186 方案3 总降水量 0.5287 -0.5774 0.7371 暴雨以上降水量 0.4701 -0.5984 0.7297 -
[1] Webster P J, Yang S. Monsoon and ENSO: Selectively interactive systems. Quart J Roy Meteor Soc, 1992, 118: 877-926. doi: 10.1002/(ISSN)1477-870X [2] Parthasarathy B, Kumar K R, Kothawale D R. Indian summer monsoon rainfall indices: 1871—1990. Meteor Mag, 1992, 121: 174-186. http://moeseprints.incois.gov.in/1097/ [3] 周玉孚. 中国东部地区季风进退与雨季起迄的关系//全国夏季风学术会议文集. 昆明: 云南人民出版社, 1983: 311-317. [4] 郭琪蕴.东亚季风强度指数及其变化分析.地理学报, 1983, 38(3):207-216. http://www.cnki.com.cn/Article/CJFDTOTAL-NJQX200404011.htm [5] 李崇银, 张利平.南海夏季风特征及其指数.自然科学进展, 1999, 9(6):536-541. http://www.cnki.com.cn/Article/CJFDTOTAL-RDQX201404015.htm [6] 王亚非, 张雁, 陈菊英.一个能反映梅雨现象的东亚夏季风指数.气候与环境研究, 2001, 6(2):146-152. http://www.cnki.com.cn/Article/CJFDTOTAL-QHYH200102001.htm [7] 曾琮, 胡斯团, 梁建茵, 等.东亚冬季风异常与广东前汛期旱涝关系的初步分析.应用气象学报, 2005, 16(5):645-654. doi: 10.11898/1001-7313.20050511 [8] 江滢, 翟盘茂.几种亚洲季风指数与中国夏季主要雨型的关联.应用气象学报, 2005, 16(增刊):70-76. http://kns.cnki.net/KCMS/detail/detail.aspx?dbcode=CJFQ&dbname=CJFD2005&filename=YYQX2005S1008&v=MDY0MzNvOUZiSVI4ZVgxTHV4WVM3RGgxVDNxVHJXTTFGckNVUkwyZll1ZHFGaUhnV3J2SlBEVGFkckc0SHRTdnI= [9] 何敏.热带环流强度变化与我国夏季降水异常的关系.应用气象学报, 1999, 10(2):171-180. http://qikan.camscma.cn/jams/ch/reader/view_abstract.aspx?file_no=19990256&flag=1 [10] 张庆云, 陶诗言, 陈烈庭.东亚季风指数的年际变化与东亚大气环流.气象学报, 2003, 61(5):559-568. doi: 10.11676/qxxb2003.056 [11] 周连童, 黄荣辉.关于我国夏季气候年代际变化特征及其可能成因的研究.气候与环境研究, 2003, 8(3):274-290. http://www.cnki.com.cn/Article/CJFDTOTAL-QHYH200303002.htm [12] Zhai P M, Zhang X B, Wan H, et al. Trends in total precipitation and frequency of daily precipitation extremes over China. J Climate, 2005, 18: 1096-1108. doi: 10.1175/JCLI-3318.1 [13] Qian W H, Qin A M. Precipitation division and climate shift in China from 1960 to 2000. Theoretical and Applied Climatology, 2008, doi: 10.1007/s00704-007-0330-4. [14] Yao C, Yang S, Qian W, et al. Regional summer precipitation events in Asia and their changes in the past decades. J Geophys Res, 2008, 113: D17107, doi: 10.1029/2007JD009603. [15] 谢炯光, 纪忠萍, 谷德军, 等.广东省前汛期连续暴雨的气候背景及中期环流特征.应用气象学报, 2006, 17(3):354-362. http://qikan.camscma.cn/jams/ch/reader/view_abstract.aspx?file_no=20060361&flag=1 [16] 张顺利, 陶诗言, 张庆云, 等. 1998年夏季中国暴雨洪涝灾害的气象水文特征.应用气象学报, 2001, 12(4):442-457. http://qikan.camscma.cn/jams/ch/reader/view_abstract.aspx?file_no=20010459&flag=1 [17] 史学丽, 丁一汇. 1994年中国华南大范围暴雨过程的形成与夏季风活动的研究.气象学报, 2000, 58(6):666-677. doi: 10.11676/qxxb2000.068 [18] 丁治英, 常越, 朱莉, 等. 1958~2000年6月连续性暴雨的特征分析.热带气象学报, 2008, 24(2):117-124. http://www.cnki.com.cn/Article/CJFDTOTAL-RDQX200802002.htm [19] Kistler R, Kalnay E, Collins W, et al. The NCEP-NCAR 50-year reanalysis: Monthly means CD-ROM and documentation. Bull Amer Meteor Soc, 2001, 82(2): 247-268. doi: 10.1175/1520-0477(2001)082<0247:TNNYRM>2.3.CO;2 [20] Xie P A, Yatagai M Y, Chen T, et al. A gauge-based analysis of daily precipitation over East Asia. J Hydrometeorol, 2007, 8(3): 607-626. doi: 10.1175/JHM583.1 [21] 马慧, 王谦谦, 陈桢华.华南前汛期降水异常的时空变化特征.高原气象, 2006, 25(2):325-329. http://www.cnki.com.cn/Article/CJFDTOTAL-GYQX200602019.htm [22] 吴尚森, 梁建茵.华南前汛期旱涝时空分布特征.热带气象学报, 1992, 8(1): 87-92. http://www.cnki.com.cn/Article/CJFDTOTAL-RDQX199201010.htm [23] 邓立平, 王谦谦.华南前汛期 (4~6月) 降水异常特征及其与我国近海海温的关系.热带气象学报, 2002, 18(1):45-55. http://www.cnki.com.cn/Article/CJFDTOTAL-RDQX200201005.htm [24] 梁建茵, 吴尚森.广东省汛期旱涝成因和前期影响因子探讨.热带气象学报, 2001, 17(2):97-108. http://www.cnki.com.cn/Article/CJFDTOTAL-RDQX200102000.htm [25] Wang Bin, Zhang Qin. Pacific-East Asian teleconnection. Part Ⅱ: How the Philippine Sea anomalous anticyclone is Established during El Nino development. J Climate, 2002, 15:3252-3265. doi: 10.1175/1520-0442(2002)015<3252:PEATPI>2.0.CO;2 [26] Zhang R H, Akimasa Sumi. Moisture circulation over East Asia during El Nino episode in Northern winter, spring and autumn. J Meteor Soc Japan, 2002, 80(2):213-227. doi: 10.2151/jmsj.80.213 [27] 姚才, 钱维宏.华南6月降水的十年际和极端年际差异及其环境分析.热带气象学报, 2010, 26(4):463-469. http://www.cnki.com.cn/Article/CJFDTOTAL-RDQX201004010.htm -


 设为首页
设为首页 加入收藏
加入收藏


 下载:
下载:
