Application of GRAPES Meteorological and Hydrological Coupled Model to Flood Forecast
-
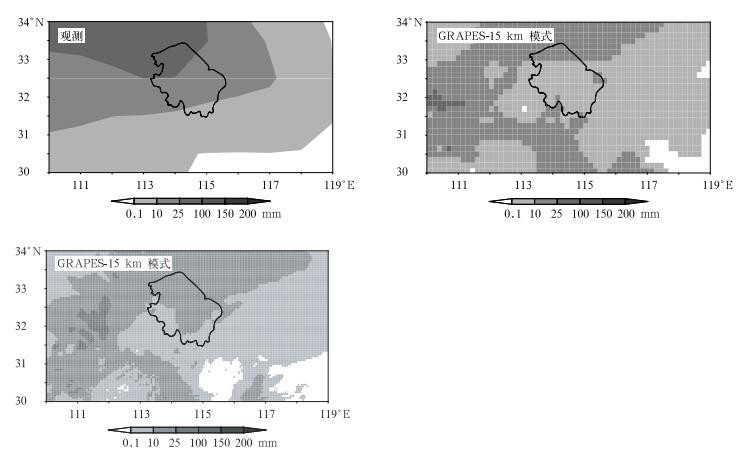
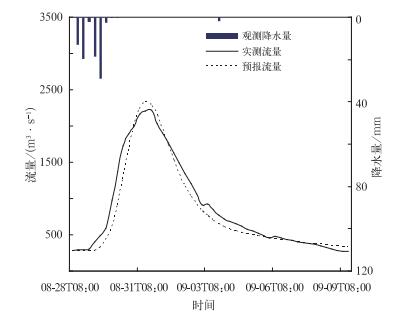
摘要: 尝试将GRAPES (Global-Regional Assimilation and PrEdiction System) 模式与水文模型结合,构建GRAPES气象-水文单向耦合模式,进行洪水预报。气象模式选取GRAPES_Meso模式,分别采用15 km×15 km和5 km×5 km水平分辨率,15 km×15 km的GRAPES模式由NCEP全球预报场提供初始场和侧边界条件;5 km×5 km的GRAPES模式由15 km×15 km GRAPES模式提供初始场和侧边界条件,将GRAPES_Meso模式的定量降水预报分辨率统一降尺度到5 km×5 km分辨率,用于驱动水文模式。水文模型选取新安江模型与分布式新安江模型。以淮河王家坝站以上流域和息县流域为试验流域,将GRAPES降水预报场驱动水文模型进行单向耦合,构建GRAPES气象-水文单向耦合模式,选择2009年8月28日08:00(北京时,下同)—9月9日14:00汛期一次洪水过程,进行实际预报试验。结果表明:15 km×15 km和5 km×5 km的GRAPES模式预报降水与实况降水分布相一致;与水文站观测降水驱动水文模型洪水模拟结果相比,GRAPES气象-水文模式对洪水预报的预见期延长效果明显,对洪水模拟精度也较高,与水文模型输入场分辨率要求相匹配的降水产品对洪水模拟的精度更高。Abstract: The GRAPES (Global-Regional Assimilation and PrEdiction System)_Meso model developed by China Meteorological Administration is coupled with a hydrological model to increase lead-time of flood forecast. GRAPES_Meso model is run in 15 km×15 km horizontal resolution and 5 km×5 km horizontal resolution. The initial fields and lateral boundaries of 15 km×15 km horizontal resolution of GRAPES is provided by global NCEP forecast datasets, and the initial fields and lateral boundaries of 5 km×5 km horizontal resolution of GRAPES is provided by 15 km×15 km horizontal resolution of GRAPES. In order to match the input scale of hydrological model, quantitative precipitation forecasts of GRAPES_Meso model is downscaled to 5 km×5 km horizontal resolution. Xin'anjiang model and grid-based distributed Xin'anjiang model are used, which have been widely applied and proven effective in flood forecasting and hydrological simulation in humid and semi-humid regions of China for a long term. Wangjiaba Station and Xixian Basin in the upper reaches of the Huai River are chosen as sensitive areas. The two hydrological models are driven by forecast datasets of GRAPES. Upstream Wangjiaba Station, the basin is divided into 10 sub-basins for the coupling experiment of Xin'anjiang model. And Xixian Basin is for the coupling experiment of grid-based distributed Xin'anjiang model. A flood which maintains from 0800 BT 28 August to 1400 BT 29 September in 2009 is forecasted by these two models. The experiment results show that compared with observed precipitation, quantitative products of GRAPES model in 15 km×15 km and 5 km×5 km horizontal resolutions are well consistent. The quantitative products of GRAPES model with 5 km×5 km are larger than the quantitative products of GRAPES model with 15 km×15 km. A promising tool is given by GRAPES meteorological and hydrological coupled hydrologic model to increase lead-time of real-time flood forecast, compared with that driven by raingauge observation. The accuracy of the flood forecasting based on the precipitation prediction of GRAPES model is approximate to the precipitation prediction. The performance may be better if the input requirements for hydrological models are exactly met.
-
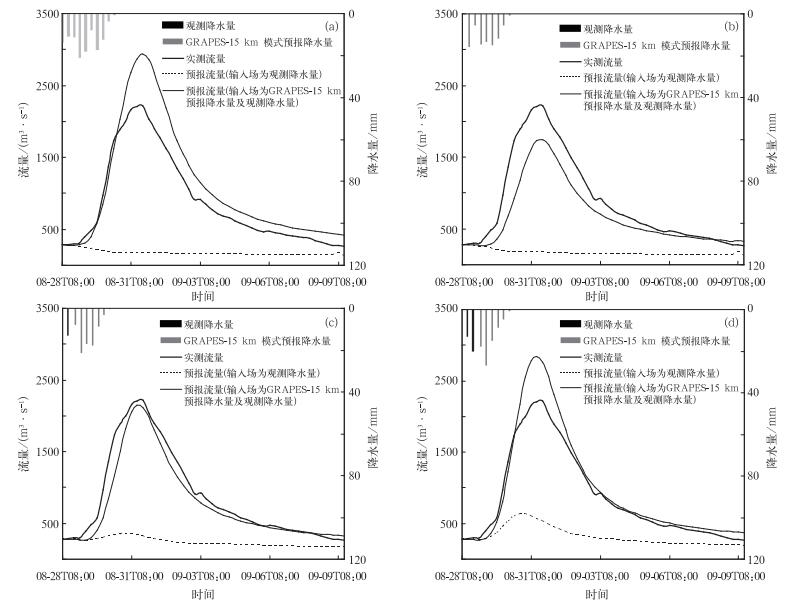
图 5 2009年8月28日—9月9日王家坝站以上流域流量与水文模型模拟流量时间演变
(a) 起始时间为2009年8月28日08:00, 预见期为84 h, (b) 起始时间为2009年8月28日14:00, 预见期为78 h, (c) 起始时间为2009年8月28日20:00, 预见期为72 h, (d) 起始时间为2009年8月29日02:00, 预见期为66 h
Fig. 5 Observed hydrographs and simulated hydrographs by hydrology model in Wangjiaba Basin from 28 Aug to 9 Sep in 2009
(a) initial time: 0800 BT 28 Aug 2009, lead-time: 84 h, (b) initial time: 1400 BT 28 Aug 2009, lead-time: 78 h, (c) initial time: 2000 BT 28 Aug 2009, lead-time: 72 h, (d) initial time: 0200 BT 29 Aug 2009, lead-time: 66 h
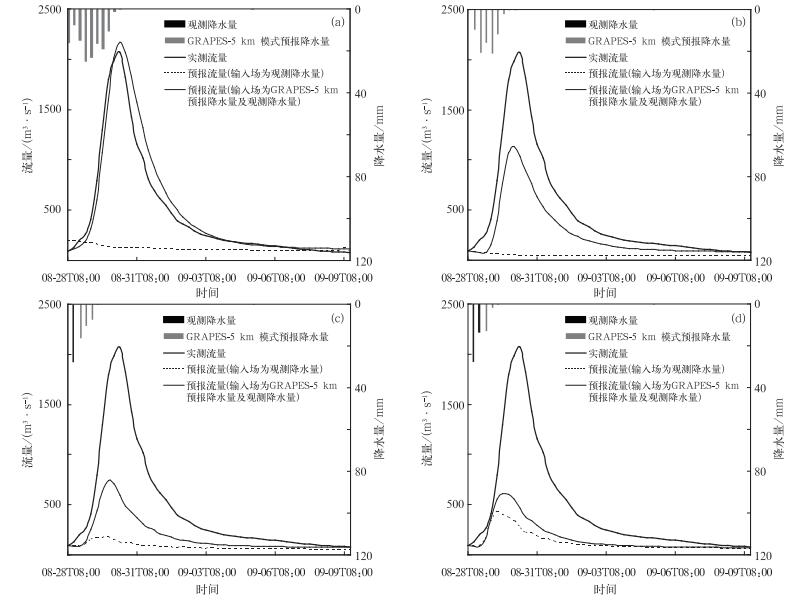
图 7 同图 5,但为GRAPES-5 km模式预报6 h累加降水量
(a) 起始时间为2009年8月28日08:00, 预见期为54 h, (b) 起始时间为2009年8月28日14:00, 预见期为48 h, (c) 起始时间为2009年8月28日20:00,预见期为42 h, (d) 起始时间为2009年8月29日02:00,预见期为36 h
Fig. 7 Same as in Fig. 5, but for 6 h accumulated precipitation by GRAPES-5 km
(a) initial time: 0800 BT 28 Aug 2009, lead-time: 54 h, (b) initial time: 1400 BT 28 Aug 2009, lead-time: 48 h, (c) initial time: 2000 BT 28 Aug 2009, lead-time: 42 h, (d) initial time: 0200 BT 29 Aug 2009, lead-time: 36 h
表 1 王家坝站以上子流域单元雨量站
Table 1 Rain stations in the upper Wangjiaba Basin
子流域 雨量站 五沟营 西平 板桥 宿鸭湖 遂平、驻马店、确山 班台 上蔡、汝南、平舆、新蔡 薄山 潢川 光山、新县 息县 桐柏、信阳、罗山、息县 南湾 鸡公山 泼河 王家坝 淮滨、正阳 表 2 王家坝站以上流域新安江模型模拟结果统计
Table 2 Statistics of the application for Xin'anjiang Model in the upper Wangjiaba Basin
预见期/h 输入场 洪量相对误差/% 洪峰相对误差/% 峰现时间误差/h 确定性系数 84 GRAPES-5 km模式 -39.50 -60.80 0 0.26 GRAPES-15 km模式 -23.90 -32.20 0 0.75 观测 81.06 87.20 -84 -1.30 78 GRAPES-5 km模式 3.39 -6.70 -6 0.94 GRAPES-15 km模式 22.31 21.40 0 0.78 观测 81.06 87.20 -84 -1.30 72 GRAPES-5 km模式 -0.26 -10.40 -6 0.95 GRAPES-15 km模式 10.95 3.00 -6 0.93 观测 73.02 84.00 -18 -0.92 66 GRAPES-5 km模式 -20.40 -41.50 -6 0.73 GRAPES-15 km模式 -11.30 -28.20 -6 0.88 观测 61.63 68.80 -24 -0.39 60 GRAPES-5 km模式 17.20 13.40 -6 0.88 GRAPES-15 km模式 23.70 23.30 -6 0.78 观测 60.30 67.60 -18 -0.30 54 GRAPES-5 km模式 26.80 27.40 0 0.72 GRAPES-15 km模式 27.00 28.00 0 0.72 观测 39.00 40.60 -12 0.46 48 GRAPES-5 km模式 26.80 27.40 0 0.72 GRAPES-15 km模式 9.51 -2.50 6 0.94 观测 9.77 -2.40 -6 0.94 42 GRAPES-5 km模式 8.00 -4.80 -6 0.95 GRAPES-15 km模式 5.50 -4.80 -6 0.95 观测 8.13 -4.80 -6 0.94 表 3 息县站以上流域分布式新安江模型模拟结果
Table 3 Statistics of the application for distributed Xin'anjiang Model in Xixian Basin
预见期/h 输入场 洪量相对误差/% 洪峰相对误差/% 峰现时间误差/h 确定性系数 54 GRAPES-5 km模式 9.31 4.85 0 0.94 GRAPES-15 km模式 1.85 -11.89 0 0.96 观测 -90.32 -95.41 -54 -0.59 48 GRAPES-5 km模式 9.31 4.85 0 0.94 GRAPES-15 km模式 -54.55 -61.04 -6 0.38 观测 -90.32 -95.41 -54 -0.59 42 GRAPES-5 km模式 9.31 4.85 0 0.94 GRAPES-15 km模式 -62.62 -69.53 -12 0.16 观测 -82.36 -91.49 -12 -0.41 36 GRAPES-5 km模式 -42.89 -45.05 -6 0.64 GRAPES-15 km模式 -65.32 -73.24 -18 0.07 观测 -72.67 -79.20 -24 -0.14 30 GRAPES-5 km模式 -42.89 -45.05 -6 0.64 GRAPES-15 km模式 -71.38 -79.15 -24 -0.10 观测 -71.39 -79.15 -24 -0.10 24 GRAPES-5 km模式 -42.89 -45.05 -6 0.64 GRAPES-15 km模式 -39.07 -44.99 0 0.67 观测 -39.09 -44.99 0 0.67 18 GRAPES-5 km模式 -59.35 -64.23 -12 0.26 GRAPES-15 km模式 -5.99 -2.25 0 0.96 观测 -6.02 -2.25 0 0.96 12 GRAPES-5 km模式 -59.35 -64.23 -12 0.26 GRAPES-15 km模式 -3.86 -0.95 0 0.96 观测 -5.21 -0.98 0 0.96 -
[1] 陈德辉, 薛纪善.数值天气预报模式现状与展望.气象学报, 2004, 62(5):623-633. doi: 10.11676/qxxb2004.061 [2] 矫梅燕.现代数值预报业务.北京:气象出版社, 2010:1-7. [3] 薛纪善, 陈德辉.数值预报系统GRAPES的科学设计与应用.北京:科学出版社, 2008:334-335. [4] Hollingsworth A. Improvements in the Skill of Numerical Weather Prediction with Global Models. WMO Bulletin, 2003, 52: 33-39. [5] Collier C G, Krzysztofowicz R. Quantitative precipitation forecasting. J Hydrol, 2000, 239:1-2. doi: 10.1016/S0022-1694(00)00389-9 [6] Damrath U, Doms G, Fruhwald D, et al. Operational quantitative precipitation forecasting at the German Weather Service. J Hydrol, 2000, 239: 260-285. doi: 10.1016/S0022-1694(00)00353-X [7] Golding B W. Quantitative precipitation forecasting in the UK. J Hydrol, 2000, 239: 286-305. doi: 10.1016/S0022-1694(00)00354-1 [8] McBride J L, Ebert E E. Verification of quantitative precipitation forecasts from operational numerical weather prediction models over Australia. Wea Forecasting, 2000, 15: 103-121. doi: 10.1175/1520-0434(2000)015<0103:VOQPFF>2.0.CO;2 [9] Mullen S L, Buizza R. Quantitative precipitation forecasts over the United States by the ECMWF Ensemble Prediction System. Mon Wea Rev, 2001, 129: 638-663. doi: 10.1175/1520-0493(2001)129<0638:QPFOTU>2.0.CO;2 [10] 谢正辉, 刘谦, 袁飞.基于全国50 km×50 km网格的大尺度陆面水文模型框架.水利学报, 2004, 5: 76-82. doi: 10.3321/j.issn:0559-9350.2004.03.013 [11] 谢正辉, 梁旭, 曾庆存.陆面过程模式中地下水位的参数化及初步应用.大气科学, 2004, 28(3): 374-384. http://www.cnki.com.cn/Article/CJFDTOTAL-DQXK200403004.htm [12] 雍斌, 张万昌, 刘传胜.水文模型与陆面模式耦合研究进展.冰川冻土, 2006, 28(6):961-970. http://www.cnki.com.cn/Article/CJFDTOTAL-BCDT200606023.htm [13] 徐精文.基于蓄水容量曲线和TOPMODEL概念的流域水文模型构建及其与NOAH LSM的耦合研究.北京:中国科学院, 2009. [14] 陆桂华.陆气耦合技术应用研究进展.2004年全国水文学术讨论会论文集, 2004:14-20. http://www.cnki.com.cn/Article/CJFDTOTAL-SCLJ201412004.htm [15] Evans J. Improving the characteristics of streamflow modeled by regional climate models.J Hydrol, 2003, 284: 211-227. doi: 10.1016/j.jhydrol.2003.08.003 [16] Anderson M L, Chen Z Q, Kavvas M L, et a1. Coupling HEC-HMS with atmospheric models for prediction of watershed runoff. J Hydrol Eng, 2002, 7(4): 312-318. doi: 10.1061/(ASCE)1084-0699(2002)7:4(312) [17] Collischonna W, Haasb R, Andreolli I, et a1.Forecasting River Uruguay flow using rainfall forecasts from a regional weather-prediction model. J Hydrol, 2005, 305: 87-98. doi: 10.1016/j.jhydrol.2004.08.028 [18] Koussis A D, Lagouvardos K, Mazi K, et a1.Flood forecasts for Urban Basin with integrated Hydro-Meteorlogical Model. J Hydrol Eng, 2003, 8(1): 1-11. doi: 10.1061/(ASCE)1084-0699(2003)8:1(1) [19] Amengual A, Romero R, Gomez M, et al. A hydrometeorological modeling study of a f1ash-flood event over Catalonia, Spain. Journal of Hydrometeorology, 2007, 8: 282-303. doi: 10.1175/JHM577.1 [20] 陈德辉, 杨学胜, 江林, 等.多尺度通用动力模式框架的设计策略.应用气象学报, 2003, 14(4): 452-461. http://www.cnki.com.cn/Article/CJFDTOTAL-YYQX200304008.htm [21] 陈德辉, 薛纪善, 杨学胜, 等.GRAPES新一代全球/区域多尺度统一数值预报模式总体设计研究.科学通报, 2008, 53(20):2396-2407 doi: 10.3321/j.issn:0023-074X.2008.20.002 [22] 陈德辉, 沈学顺.新一代数值预报系统GRAPES研究进展.应用气象学报, 2006, 17(6): 773-777 http://qikan.camscma.cn/jams/ch/reader/view_abstract.aspx?file_no=200606125&flag=1 [23] 伍湘君, 金之雁, 黄丽萍, 等. GRAPES模式软件框架与实现.应用气象学报, 2005, 16(4):539-546. http://qikan.camscma.cn/jams/ch/reader/view_abstract.aspx?file_no=20050468&flag=1 [24] 黄丽萍, 伍湘君, 金之雁. GRAPES模式标准初始化方案设计与实现.应用气象学报, 2005, 16(3):374-383. http://qikan.camscma.cn/jams/ch/reader/view_abstract.aspx?file_no=20050346&flag=1 [25] 王雨, 李莉. GRAPES_Meso V3.0模式预报效果检验.应用气象学报, 2010, 21(5): 524-533 http://qikan.camscma.cn/jams/ch/reader/view_abstract.aspx?file_no=20100502&flag=1 [26] 赵人俊.新安江模型的根据及参数与自然条件的关系.北京:水利电力出版社, 1994: 106-118. [27] Land Data Assimilation Schemes (LDAS), Mapped Vegetation Parameters. [2010-03-04]. http://ldas.gsfc.nasa.gov/LDAS8th/MAPPED.VEG/LDASmapveg.shtml. [28] Anderson R M, Koren V, Reed S. Using SSURGO data to improve Sacramento Model a priori parameter estimates. J Hydrol, 2006, 320: 103-106. doi: 10.1016/j.jhydrol.2005.07.020 [29] Koren V, Reed S, Smith M, et al. Hydrology laboratory research modeling system (HL-RMS) of the national weather service. J Hydrol, 2004, 291: 297-318. doi: 10.1016/j.jhydrol.2003.12.039 [30] 袁飞.考虑植被影响的水文过程模拟研究.南京:河海大学, 2006 [31] 姚成.基于栅格的新安江 (Grid-Xinanjiang) 模型研究.南京:河海大学, 2009. [32] 赵人俊, 王佩兰.新安江模型参数的分析.水文, 1988, 6: 2-9. http://www.cnki.com.cn/Article/CJFDTOTAL-XBSZ201205032.htm [33] 赵人俊, 王佩兰, 胡凤彬, 等.新安江模型的根据及模型参数与自然条件的关系.河海大学学报, 1992, 20(1):52-59. http://www.cnki.com.cn/Article/CJFDTOTAL-HHDX199201008.htm [34] 包红军.基于EPS的水文与水力学相结合的洪水预报模型研究.南京:河海大学, 2009. [35] University of Maryland, Department of Geography. UMD Land Cover Classification. [2010-03-04]. http://glcf.umiacs.umd.edu/data/landcover/. [36] Food and Agriculture Organization, Texture. [2010-03-04].http://www.ngdc.noaa.gov/ecosys/cdroms/reynolds/reynolds/reynolds.htm#tr. -


 设为首页
设为首页 加入收藏
加入收藏


 下载:
下载:
