
 设为首页
设为首页 加入收藏
加入收藏

The Atmospheric Circulation Features of Two Persistent Heavy Rainfalls over Southern China in the Summer of 2010
-
摘要: 通过对2010年夏季我国南方两次持续性强降水期间对流层高、中、低多个大尺度关键影响系统的时空演变特征及其影响机制的分析和比较,讨论了我国南方持续性强降水的大气环流特征。结果表明:这两次持续性强降水均出现了东亚西风带沿海低槽不断快速重建或加深,且中纬度锋区位置稳定维持,低空西南急流反复加强,且其轴线左侧的南风经向强梯度带位置相对稳定,副热带高空西风急流和南亚高压脊线及西太平洋副热带高压的纬度带位置相对稳定;相应地,在强降水带上空反复出现强烈的低层水汽辐合抬升、高层辐散抽吸及垂直上升运动发展,进而形成持续性强降水。西西伯利亚低槽的不断快速重建与加深 (东移)、马斯克林高压西侧高压及马斯克林高压的不断加强东移、副热带高空西风急流的建立和维持对南方持续性强降水具有超前指示意义。强降水带位于东亚低空西南急流轴左侧南风经向强梯度辐合带、高空西风急流南侧至南亚高压脊线北侧之间的强辐散区及中层垂直上升速度大值带中。Abstract: The large scale rainstorm flooding induced by the persistent heavy rainfall in summer is the main meteorological disaster in China. Still more efforts are needed to improve the quantitative and refined forecast ability on the characteristic quantity of the persistent heavy rainfall, such as starting and ending time, drop location and the intensity of precipitation. By using daily intensive observed precipitation data and NCEP/NCAR reanalysis data, two persistent heavy rainfalls in Southern China is analyzed and compared to investigate the spatial-temporal evolutioning features and the influencing mechanism of the large scale key influence systems, and atmospheric circulation features of the two processes are summarized as below.During the periods of persistent heavy rainfalls over Southern China in the summer of 2010, the westerly trough over coastland reformed and strengthened frequently and the mid-latitude frontal zone maintained steadily, the low level southwest jet strengthened repeatedly and the strong gradient belt of meridional wind on the left side of the low level southwest jet axis are relatively stable. Meanwhile the latitude location of the subtropical westerly jet, the ridge of South Asia high and the west Pacific subtropical high are also relatively stable in East Asia. Under the joint influences of the large scale key influence systems mentioned above, vapor convergence in the low layer and divergence in the upper layer occurs repeatedly, and the vertical ascending motion strengthens over the heavy rainfall belt, which leads to the formation of the persistent heavy rainfall over Southern China.Before the persistent heavy rainfall in Southern China, the trough in western Siberian keeps reforming and strengthening, shifting to east of Mascarene high and its western high. The subtropical upper westerly jet is also established and maintains in East Asian.The heavy rainfall belt of the persistent heavy rainfall lies in these areas: The strong gradient convergence belt of meridional wind on the left side of the low level southwest jet axis, the strong divergence zone between the south boundary of subtropical upper westerly jet and the ridge axis of South Asia high, the belt of high updraft vertical velocity in the middle layer in East Asian, the south margin of the middle-latitude frontal zone in the middle-upper troposphere, and the north boundary of the west Pacific subtropical high.
-
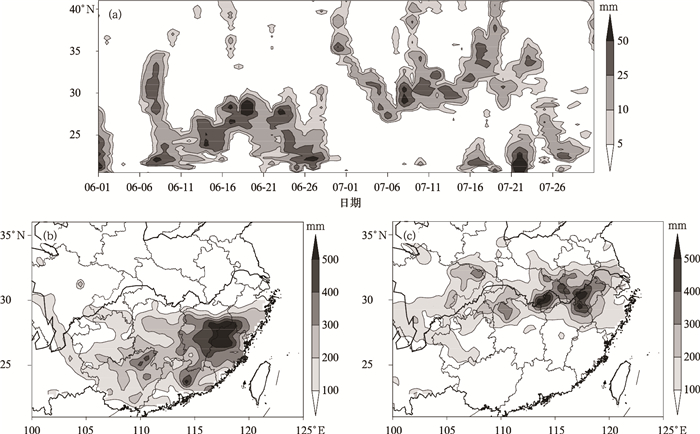
图 1 2010年夏季我国南方持续性强降水时空分布 (a)6—7月沿110°~122.5°E平均的逐日降水量间-纬度剖面图,(b)6月13—28日累积降水量,(c)7月3—16日累积降水量
Fig. 1 Spatial and temporal distribution of the persistent heavy rainfalls over Southern China in the summer of 2010 (a) altitude-time cross section of daily precipitation averaged over 110°—122.5°E from June to July, (b) accumulated precipitation from 13 June to 28 June, (c) accumulated precipitation from 3 July to 16 July
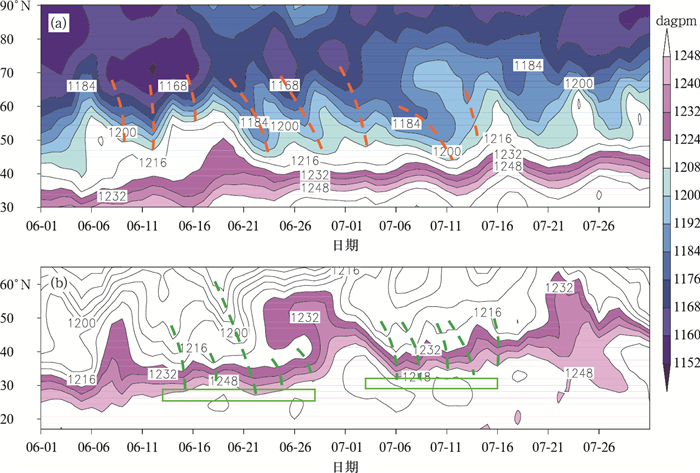
图 2 2010年6—7月沿70°~80°E平均 (a) 和沿120°E (b) 的200 hPa位势高度时间-纬度剖面 (虚线为槽线;两个方框:25.3°~28.7°N为6月江南持续性强降水期的强降水带,29°~32°N为7月长江中下游持续性强降水期的强降水带)
Fig. 2 Altitude-time cross sections of geopotential heights at 200 hPa from June to July in 2010 averaged over 70°—80°E (a) and 120°E (b)(dashed lines show the trough lines; two rectangles: 25.3°—28.7°N shows the heavy rainfall belt of the persistent heavy rainfall over the south Yangtze valley in June, 29°—32°N shows the heavy rainfall belt of the persistent heavy rainfall over the middle and lower reaches of the Yangtze)
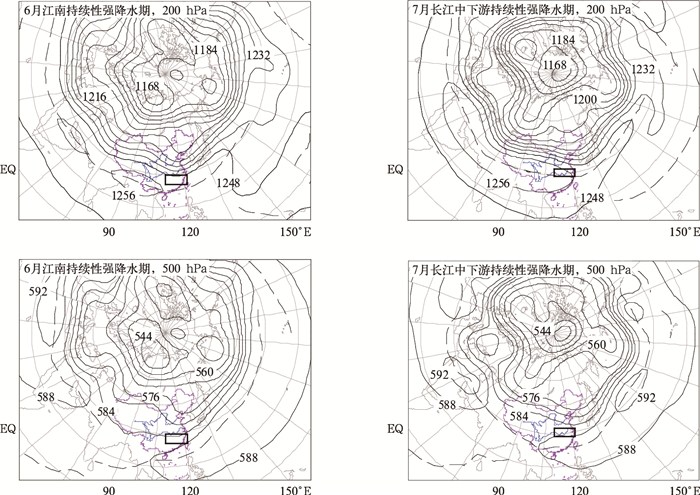
图 3 2010年夏季南方持续性强降水期200 hPa和500 hPa平均位势高度
(单位:dagpm;虚线为高压脊线;方框指示强降水带)
Fig. 3 Averaged geopotential heights at 200 hPa and 500 hPa during the persistent heavy rainfalls over Southern China in the summer of 2010
(unit: dagpm; dashed line shows the ridge of high; rectangle shows the heavy rainfall belt)
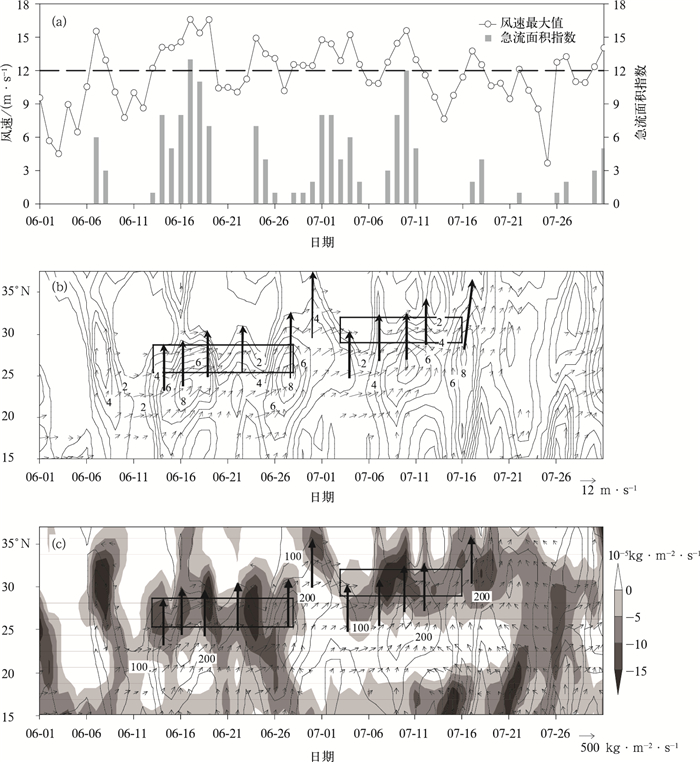
图 4 2010年6—7月南方西南急流面积指数及相同区域内850 hPa西南风速最大值逐日演变 (a),沿110°~122.5°E平均的西南风矢 (≥4 m·s-1) 和经向风 (≥1 m·s-1)(b) 及地表到700 hPa垂直积分的水汽通量 (矢量和等值线,单位:kg·m-1·s-1) 和水汽通量散度 (阴影) 时间-纬度剖面 (c)(方框同图 2)
Fig. 4 Daily variations of southwest jet area index over Southern China and the maximum of southwest wind at 850 hPa (a), time-altitude cross section of southwest wind vector above 4 m·s-1with meridional wind above 1 m·s-1 (b) and vertically integrated water vapor transport flux from surface to 700 hPa (vectors and contours, unit: kg·m-1·s-1) averaged over 110°—122.5°E and its divergence (shaded) from June to July in 2010(c)(rectangle is same as in Fig. 2)
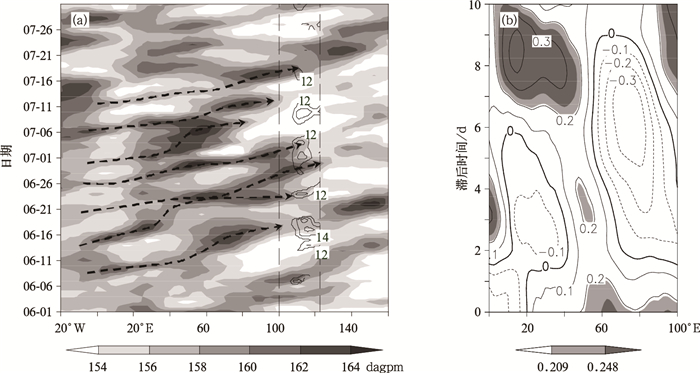
图 5 2010年6—7月850 hPa 10°~50°S之间位势高度最大值 (阴影) 和100°~122.5°E范围内20°~32.5°N之间西南风速最大值 (等值线, 单位:m·s-1) 时间-经度剖面 (a),南方西南急流面积指数滞后10°~50°S之间位势高度最大值的相关系数 (b)
(浅色和深色阴影分别表示通过0.10和0.05水平的显著性检验)
Fig. 5 Longitude-time cross section of the maximum of geopotential heights (shaded) between 10°—50°S and the maximum of southwest wind (contours, unit: m·s-1) between 20°—32.5°N in 100°—122.5°E, and the lag correlation coefficient of southwest jet area index over Southern China against the maximum of geopotential heights between 10°—50°S at 850 hPa from June to July in 2010
(light and deep shaded areas show passing the test of 0.10 and 0.05 levels, respectively)
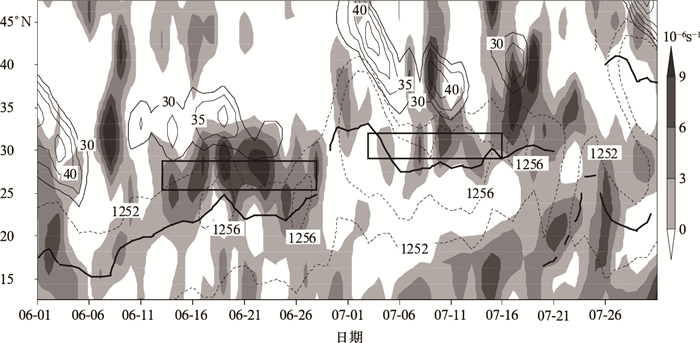
图 6 2010年6—7月沿110°~122.5°E平均的200 hPa纬向风速 (细实线,单位:m·s-1)、位势高度 (点线,单位:dagpm) 和水平散度 (阴影) 时间-纬度剖面
(粗实线为南亚高压脊线,方框同图 2)
Fig. 6 Altitude-time cross section of zonal wind (thin solid line, unit: m·s-1), geopotential heights (dotted lines, unit: dagpm) and horizontal divergence (shaded, unit: 10-6s-1) averaged over 110°—122.5°E at 200 hPa from June to July in 2010
(thick solid line is the South Asia high ridge; rectangle is same as in Fig. 2)
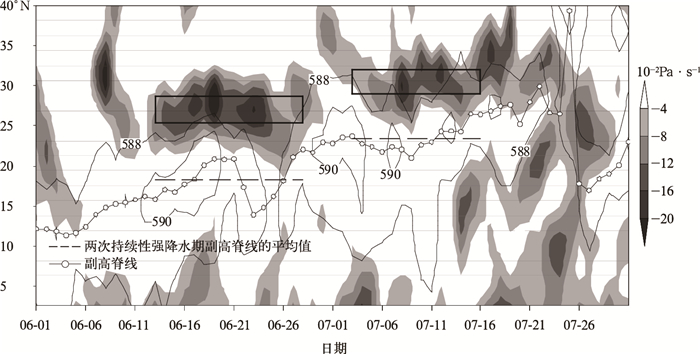
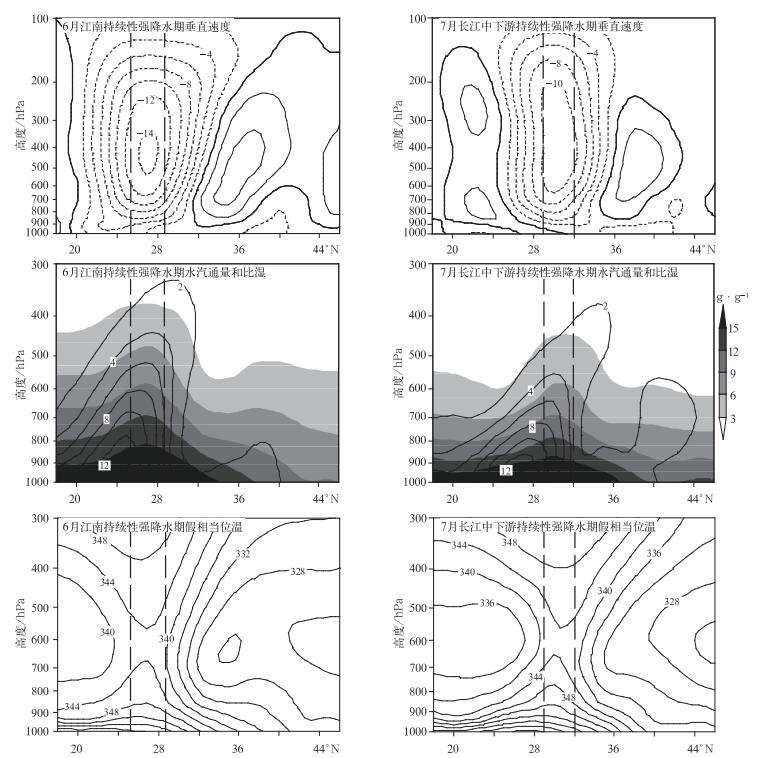
图 8 2010年南方持续性强降水期沿110°~122.5°E平均的垂直速度(单位:10-2Pa·s-1)、水汽通量(单位:g·m-1·s-1·Pa-1)和比湿(阴影)及假相当位温(单位:K)纬度-高度剖面(虚线指示强降水带)
Fig. 8 Latitude-altitude cross sections of vertical speed(unit: 10-2Pa·s-1),water vapor transport flux(unit: g·m-1·s-1·Pa-1) and specific humidity(shaded) and θse(unit: K) averaged over 110°—122.5°E in the persistent heavy rainfalls over Southern China in 2010
(dashed lines show the area of the heavy rainfall belt)
表 1 2010年夏季我国南方持续性强降水期间的强降水过程
Table 1 The strong rain processes during the persistent heavy rainfalls over Southern China in the summer of 2010
强降水期 过程编号 过程
起止日期过程强度 范围 06-13—28 A1 13—15 大到暴雨 闽、赣南、粤中东、湘南、桂、黔东南 A2 16—18 大到暴雨 浙中南、赣、闽、粤东、湘南、桂北、黔、渝西南 A3 19—22 暴雨到大暴雨 浙中南、赣、闽中北、湘北和东南、桂、粤东北 A4 23—25 大到暴雨 浙中南、赣中南、闽、湘中、粤、桂南、黔、川南 A5 27—28 中到大雨 浙北、赣北、皖南、闽西、湘中南、粤、桂、黔 07-03—16 B1 03—07 大到暴雨 苏南、浙、皖中南、赣中北、闽西北、鄂南、湘中北、渝、川东 B2 08—09 大到暴雨 浙中南、皖南、赣北、鄂、湘北、渝、川东、黔北 B3 10—14 大到暴雨 苏、浙北、皖、赣北、鄂南、湘北、渝东北、川东、黔 B4 15—16 大到暴雨 苏南、浙北、皖中南、赣北、鄂中、豫南、川东、陕南  下载: 导出CSV
-
[1] 竺可桢.东南季风与中国之雨量.地理学报, 1934, 1(1): 1-27. http://www.cnki.com.cn/Article/CJFDTOTAL-DLXB193401000.htm [2] 涂长望, 黄士松.中国夏季风之进退.气象学报, 1944, 18(1): 1220. http://www.cnki.com.cn/Article/CJFDTOTAL-KXTB201226012.htm [3] 陶诗言.中国之暴雨.北京:科学出版社, 1980. [4] 庄世宇, 赵声蓉, 姚明明. 1998年夏季西太平洋副热带高压的变异分析.应用气象学报, 2005, 15(2): 181-192. doi: 10.11898/1001-7313.20050223 [5] 孙颖, 丁一汇. 1997年东亚夏季风异常活动在汛期降水中的作用.应用气象学报, 2002, 13(3): 277-287. http://qikan.camscma.cn/jams/ch/reader/view_abstract.aspx?file_no=20020338&flag=1 [6] 徐海明, 何金海, 周兵.江淮入梅前后大气环流的演变特征和西太平洋副高北跳西伸的可能机制.应用气象学报, 2001, 12(2): 150-158. http://qikan.camscma.cn/jams/ch/reader/view_abstract.aspx?file_no=20010221&flag=1 [7] 李春晖, 梁建茵, 郑彬, 等.南海夏季风北推时间及相关环流变化特征.应用气象学报, 2007, 18(2): 202-210. doi: 10.11898/1001-7313.20070235 [8] 朱玲, 左洪超, 李强, 等.夏季南亚高压的气候变化特征及其对中国东部降水的影响.高原气象, 2010, 29(2): 671-679. http://www.cnki.com.cn/Article/CJFDTOTAL-GYQX201003016.htm [9] 陶诗言, 赵煜佳, 陈晓敏.东亚的梅雨期与亚洲上空大气环流季节变化的关系.气象学报, 1958, 29(2): 119-134. doi: 10.11676/qxxb1958.014 [10] 李崇银, 王作台, 林士哲, 等.东亚夏季风活动与东亚高空西风急流位置北跳关系的研究.大气科学, 2004, 28(5): 641-658. http://www.cnki.com.cn/Article/CJFDTOTAL-DQXK200405000.htm [11] 薛峰, 王会军, 何金海.马斯克林高压与澳大利亚高压的年际变化及其对东亚夏季风降水的影响.科学通报, 2003, 48(3): 287-291. http://www.cnki.com.cn/Article/CJFDTOTAL-KXTB200303017.htm [12] 姚秀萍, 于玉斌. 2003年梅雨期干冷空气的活动及其对梅雨降水的作用.大气科学, 2005, 29(6): 973-985. http://www.cnki.com.cn/Article/CJFDTOTAL-DQXK200506012.htm [13] 王亚非, 宋永加. 1991年夏东亚阻塞高压形成的诊断分析.气象学报, 1998, 58(2): 212-223. doi: 10.11676/qxxb1998.020 [14] 张顺利, 陶诗言, 张庆云, 等.长江中下游致洪暴雨的多尺度条件.科学通报, 2002, 47(6): 467-473. http://www.cnki.com.cn/Article/CJFDTOTAL-KXTB200206020.htm [15] 赵振国, 王永光, 陈桂英, 等.中国夏季旱涝及环境场.北京:气象出版社, 1999:10-11. [16] 黄嘉佑.气象统计分析与预报方法.北京:科学出版社, 2004:17. [17] 刘还珠, 姚明明.降水与副热带高压位置和强度变化的数值模拟.应用气象学报, 2000, 11(4): 385-391. http://qikan.camscma.cn/jams/ch/reader/view_abstract.aspx?file_no=20000458&flag=1 [18] 吴国雄, 丑纪范, 刘屹岷, 等.副热带高压研究进展及展望.大气科学, 2003, 27(4): 503-517. http://www.cnki.com.cn/Article/CJFDTOTAL-DQXK200304005.htm -

计量
- 摘要浏览量: 3202
- HTML全文浏览量: 991
- PDF下载量: 1524
- 被引次数: 0
