
 设为首页
设为首页 加入收藏
加入收藏

Simulation of the Precipitation and Its Variation During the 20th Century Using the BCC Climate Model (BCC_CSM1.0)
-
摘要: 应用国家气候中心气候系统模式 (BCC_CSM1.0),在给定温室气体、太阳常数、硫酸盐气溶胶、火山灰等外强迫数据的条件下,对19世纪末到20世纪气候进行模拟。对降水模拟结果的检验表明:BCC_CSM1.0模式能够模拟出全球降水的基本气候状态、季节变化、季节内振荡、年际变化等特征。模拟结果显示:与CMAP及CRU观测分析资料相比基本一致,全球陆地降水在过去一个多世纪中存在上升趋势。同时,模式也存在不足和需要改进之处:模拟降水的时空分布与观测不一致;我国东部地区的雨带季节转变较观测偏快;主要雨带位置较观测偏西、偏北;夏季青藏高原东北侧有虚假的降水中心;热带季节内振荡较实际偏弱;降水年际变率较观测略大,主要发生在降水较明显的热带。BCC_CSM1.0模式模拟的全球陆地降水以及欧亚、亚洲、中国大陆 (中国东部、江南、华北等地区) 平均降水与近105年由观测所得的CRU资料基本一致,但多数地区比观测略偏低。模拟的全球陆地、中国东部、江南、华北等地区的降水趋势也与CRU资料一致;模拟的全球陆地降水在过去105年中有明显的上升趋势,与CRU资料相比,上升趋势更强,但在欧亚、亚洲、中国范围内模拟的降水趋势与观测有一定的差异。Abstract: The precipitation of the late 19th and 20th century (1870—2005) is simulated using Beijing Climate Center's Climate System Model (BCC_CSM1.0) under specified external forcing of solar constant, greenhouse gases, sulfate aerosols and volcanic ashes. The simulated precipitation and its variations are validated, showing that the BCC_CSM1.0 can pretty well simulate the basic climate state of global precipitation, the seasonal transition, the intra-seasonal oscillation of tropical precipitation and the inter-annual variation. The simulation shows there is an increasing trend in global land precipitation and in the extreme precipitation events during 1901—2005. The result consists with the CMAP and CRU analysis data which is based on observations in general, but there are still some discrepancies between the simulated and observed precipitation in the spatial distribution and temporal evolution. The simulation ability of the model needs improvement in some aspects. The simulated seasonal transition of the main rain belt in east part of China is faster than the observation. And the simulated precipitation over northeast part of Tibet Plateau and nearby region is heavier than observation especially in summer. The simulated intra-seasonal oscillation of the tropical precipitation is weaker than the observation. The simulated inter-annual variability is larger than the observation, which mainly occurs in the tropical region where the precipitation is large. The mean precipitation of global land, Eurasia, Asia, east part of China, the south part of the Yangtze River and North China during 1901—2005 from BCC_CSM1.0 is consistent with corresponding CRU data. In most of the above regions the simulated precipitation is lower than the observation. The simulated precipitation trend of global land, east part of China, the south part of the Yangtze and North China from BCC_CSM1.0 is consistent with that from CRU data. The simulated precipitation of global land for 1901—2005 has obvious increasing trend which is more significant than that from CRU data. But for the other regions mentioned, the precipitation trend simulation result is unsatisfactory and needs further improvement.
-
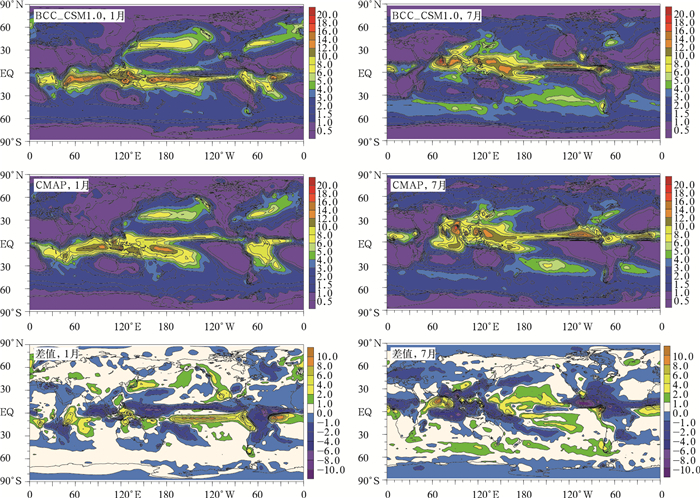
图 1 1月和7月BCC_CSM1.0模式、CMAP气候平均 (1979—2005年) 降水强度及两者差值 (单位:mm·d-1)
Fig. 1 The precipitations from BCC_CSM1.0 and CMAP (1979—2005) with their difference in January and July (unit: mm·d-1)
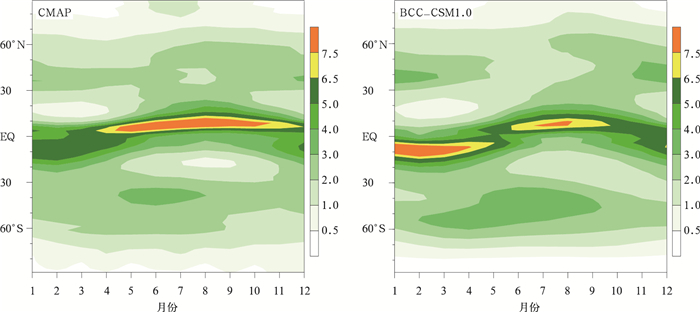
图 2 1979—2005年平均各纬度带降水变化 (单位:mm·d-1)
Fig. 2 Averaged precipitation from 1979 to 2005(unit: mm·d-1)
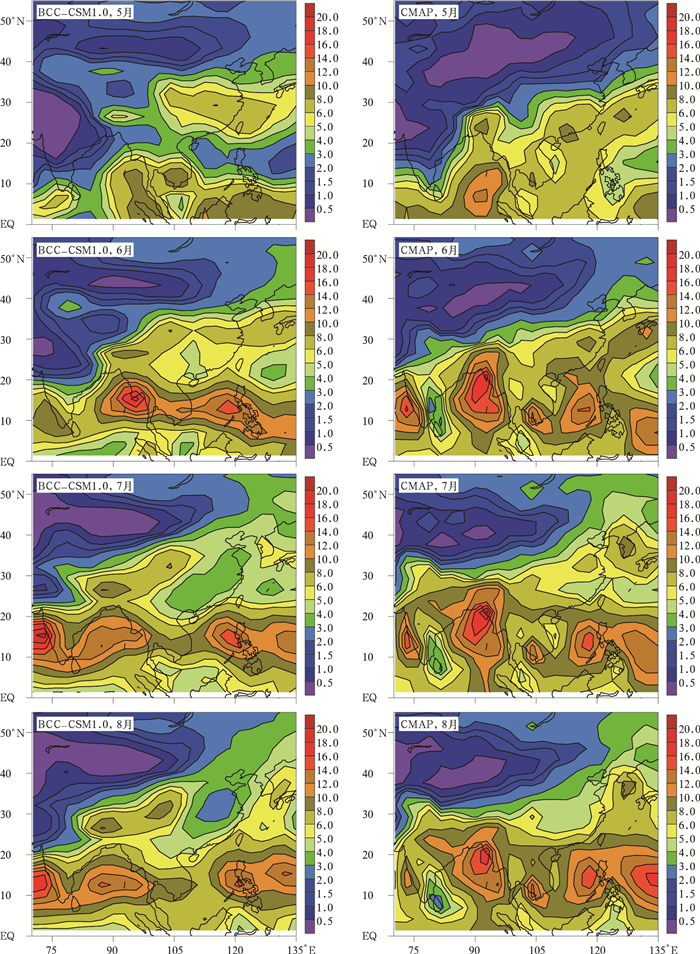
图 3 1979—2005年5—8月中国区域降水分布 (单位:mm·d-1)
Fig. 3 The precipitation over China for May—August during 1979—2005(unit: mm·d-1)

图 4 1979—2005年热带地区 (10°S~10°N平均) 降水时空谱 (单位:10-3 mm·d-1)
Fig. 4 The space-time spectrum of precipitation in the tropics (10°S~10°N)(unit: 10-3 mm·d-1)

图 5 1979—2005年1月和7月BCC_CSM1.0模拟降水、CMAP降水的均方差及两者差值 (单位:mm·d-1)
Fig. 5 The standard deviations of BCC_CSM1.0 simulated precipitation and CMAP data with their difference (unit: mm·d-1)
表 1 BCC_CSM1.0模式模拟月降水量与CMAP资料比较
Table 1 The comparison of BCC_CSM1.0 simulated precipitation to CMAP data for each month
月份 全球 热带地区 均方根误差
/(mm·d-1)平均值
/(mm·d-1)相对误差 均方根误差
/(mm·d-1)平均值
/(mm·d-1)相对误差 1 1.71 2.62 0.65 2.28 3.37 0.68 2 1.89 2.62 0.72 2.55 3.34 0.76 3 1.85 2.61 0.71 2.48 3.29 0.75 4 1.85 2.65 0.70 2.46 3.34 0.74 5 1.89 2.69 0.70 2.53 3.37 0.75 6 1.69 2.74 0.61 2.21 3.34 0.66 7 1.74 2.78 0.63 2.31 3.40 0.68 8 1.69 2.72 0.62 2.24 3.38 0.66 9 1.55 2.66 0.58 2.06 3.28 0.63 10 1.54 2.62 0.59 2.03 3.26 0.62 11 1.52 2.65 0.57 2.01 3.33 0.60 12 1.50 2.65 0.57 1.98 3.36 0.59  下载: 导出CSV
表 2 BCC_CSM1.0模拟降水与CMAP资料的均方差的均方根误差 (单位:mm·d-1)
Table 2 The standard deviations of BCC_CSM1.0 simulated precipitation and CMAP data with their differences (unit: mm·d-1)
月份 全球 30°S~30°N 1 0.797 1.067 2 0.908 1.228 3 0.908 1.229 4 0.888 1.190 5 0.870 1.176 6 0.852 1.143 7 0.840 1.117 8 0.742 0.988 9 0.799 1.064 10 0.811 1.084 11 0.758 1.017 12 0.765 1.016
下载: 导出CSV
表 3 降水的长期趋势
Table 3 The long term trends of precipitation
范围 数据 (年份) 平均降水强度
/(mm·d-1)M-K法变化趋势
/(mm/10 a)Zs 线性回归变化趋势
/(mm/10 a)R 全球陆地 BCC_CSM1.0(1870—2005) 1.83 0.80 3.57 0.69 0.276 BCC_CSM1.0(1901—2005) 1.83 1.18 3.58 1.12 0.340 CRU (1901—2005) 2.22 1.10 1.40 1.01 0.199 欧亚 BCC_CSM1.0(1870—2005) 1.54 0.80 3.12 0.73 0.233 BCC_CSM1.0(1901—2005) 1.55 0.79 1.95 0.77 0.189 CRU (1901—2005) 1.69 -0.27 -0.40 0.09 0.020 亚洲 BCC_CSM1.0(1870—2005) 1.75 1.31 3.08 1.30 0.272 BCC_CSM1.0(1901—2005) 1.76 1.57 2.40 1.46 0.232 CRU (1901—2005) 2.01 0.12 0.12 0.21 0.031 中国大陆 BCC_CSM1.0(1870—2005) 2.02 1.50 2.31 1.46 0.196 BCC_CSM1.0(1901—2005) 2.03 1.08 1.09 1.15 0.155 CRU (1901—2005) 2.12 -0.32 -0.26 -0.08 -0.009 中国东部 BCC_CSM1.0(1870—2005) 2.07 0.61 0.58 0.73 0.063 BCC_CSM1.0(1901—2005) 2.07 0.89 0.58 1.68 0.108 CRU (1901—2005) 2.38 0.49 0.35 1.08 0.082 中国江南 BCC_CSM1.0(1870—2005) 3.20 2.11 0.51 -0.02 -0.001 BCC_CSM1.0(1901—2005) 3.18 3.61 0.59 4.85 0.094 CRU (1901—2005) 3.70 1.61 0.27 2.64 0.058 中国华北 BCC_CSM1.0(1870—2005) 1.91 3.27 1.38 2.62 0.099 BCC_CSM1.0(1901—2005) 1.93 0.38 0.09 0.36 0.011 CRU (1901—2005) 1.53 2.81 0.97 2.29 0.094
下载: 导出CSV
-
[1] Randall D A, Wood R A, Bony S, et al.Climate Models and Their Evaluation//Climate Change 2007: The Physical Science Basis. Contribution of Working Group Ⅰ to the Fourth Assessment Report of the Intergovernmental Panel on Climate Change. Cambridge: Cambridge University Press, 2007. [2] Johns T C. The new Hadley Centre climate model HadGEM1:Evaluation of coupled simulations. J Clim, 2006, 19: 1327-1353. doi: 10.1175/JCLI3712.1 [3] 刘敏, 江志红.13个IPCC AR4模式对中国区域近40 a气候模拟能力的评估.南京气象学院学报, 2009, 32(2): 256-268. http://www.cnki.com.cn/Article/CJFDTOTAL-NJQX200902013.htm [4] 许崇海, 罗勇, 徐影.全球气候模式对中国降水分布时空特征的评估和预估.气候变化研究进展, 2010, 6(6): 398-404. http://www.cnki.com.cn/Article/CJFDTOTAL-QHBH201006003.htm [5] 张莉, 丁一汇.全球海气耦合模式对我国极端降水模拟检验.应用气象学报, 2008, 19(6):760-769. http://qikan.camscma.cn/jams/ch/reader/view_abstract.aspx?file_no=20080616&flag=1 [6] 董敏, 叶正青.国家气候中心大气模式的验证研究——AMIPII结果分析.应用气象学报, 2005, 16(增刊):22-29. http://kns.cnki.net/KCMS/detail/detail.aspx?dbcode=CJFQ&dbname=CJFD2005&filename=YYQX2005S1002&v=MDEyNDl1WnBGeTNnVTd6SVBEVGFkckc0SHRTdnJvOUZab1I4ZVgxTHV4WVM3RGgxVDNxVHJXTTFGckNVUkwyZlk= [7] Wu Tongwen, Yu R, Zhang F, et al. The Beijing Climate Center atmospheric generalcirculation model: Description and its performance for the present-day climate. Clim Dyn, 2010, 34:123-147. doi: 10.1007/s00382-008-0487-2 [8] Zhang L, Dong M, Wu T W. Changes in precipitation extremes over Eastern China simulated by the Beijing Climate Center Climate System Model (BCC_CSM1.0). Climate Res, 2011, 50: 227-245. doi: 10.3354/cr01066 [9] 董敏, 吴统文, 王在志, 等.北京气候中心大气环流模式对季节内振荡的模拟.气象学报, 2009, 67(6):912-922. doi: 10.11676/qxxb2009.089 [10] 陈湘雅. 东亚夏季风年际变化及BCC_CSM模拟分析. 南京: 南京信息工程大学, 2008. [11] Chen H, Yu R, Li J, et al.The coherent interdecadal changes of East Asia climate in mid-summer simulated by BCC_AGCM2.0.1.Cli Dyn, 2011, DOI10.1007/s00382-011-1154-6. doi: 10.1007/s00382-011-1154-6 [12] 颉卫华, 吴统文.全球大气环流模式BCC_AGCM2.0.1对1998年夏季江淮流域强降水的回报试验研究.大气科学, 2010, 34(5): 962-978. http://cpfd.cnki.com.cn/Article/CPFDTOTAL-ZGQX200510001625.htm [13] 李巧萍, 丁一汇, 董文杰. SRES A2情景下未来30年我国东部夏季降水变化趋势.应用气象学报, 2008, 19(6):770-780. http://qikan.camscma.cn/jams/ch/reader/view_abstract.aspx?file_no=20080617&flag=1 [14] Xie P, Arkin P A. Global precipitation: A 17-year monthly analysis based on gauge observations, satellite estimates, and numerical model outputs. Bull Amer Meteor Soc, 1997, 78:2539-2558. [15] Adler R F, Huffman G J, Chang A, et al.The Version 2 Global Precipitation Climatology Project (GPCP) monthly precipitation analysis (1979-present).J Hydrometeor, 2003, 4: 1147-1167. doi: 10.1175/1525-7541(2003)004<1147:TVGPCP>2.0.CO;2 [16] Hulme M. A 1951-80 global land precipitation climatology for the evaluation of General Circulation Models.Cli Dyn, 1992, 7:57-72. [17] Wang X L, Swail V R.Changes of extreme wave heights in Northern Hemisphere oceans and related atmospheric circulation regimes.J Clim, 2001, 14:2204-2220. doi: 10.1175/1520-0442(2001)014<2204:COEWHI>2.0.CO;2 -


计量
- 摘要浏览量: 3231
- HTML全文浏览量: 1027
- PDF下载量: 1350
- 被引次数: 0
