
 设为首页
设为首页 加入收藏
加入收藏

Quality Evaluations and Comparisons of Radiation Data at Lin'an and Longfengshan Stations
-
摘要: 采用国际通用的辐射数据质量评估方法对2005—2011年浙江临安、黑龙江龙凤山两个区域大气本底站辐射观测资料进行质量评估与比较分析。结果表明:两站辐射数据通过物理可能限制检验与极端罕见限制检验的百分比均超过99.5%,但通过相关要素比较限制检验的百分比上,临安与龙凤山站分别降至97.9%与95.9%;双轴定位追踪太阳出现偏差是造成直接辐射与散射辐射数据精度降低的主要原因。CM21表的热偏移在-5 W·m-2以内,而其进行热偏移订正可以显著提高数据的通过率。对应同一太阳天顶角,临安站晴空总辐射与直接辐射均低于龙凤山站,散射辐射则相反,其原因是临安的大气透明系数较低,大气浑浊度较高。2006—2011年,临安站的大气向下长波辐射呈下降趋势,达到了0.01的显著性水平,且其多年平均值 (363.7±59.3 W·m-2) 显著高于龙凤山站 (274.9±77.6 W·m-2);龙凤山站晴空太阳总辐射呈增加趋势,达到了0.1的显著性水平。Abstract: Solar radiation is widely used in the studies of climate change, evaluation of model simulations and assessment of solar radiation energy resources. Therefore, accurate observations of solar radiation data are absolutely needed. An international BSRN method of solar data quality assessment and quality control (QA-QC) is applied to investigate data quality of solar radiation and downward long-wave radiation (DLR) measured from 2005 to 2011 at Lin'an and Longfengshan, two regional background stations in the mainland of China. The method includes 3 steps of testing. They are the sequential limits of physically possible, extremely rare and relevant factor comparison. The results show that percentages of radiation data meeting requirements of the first two test steps of the quality test at both sites are more than 99.5%, but in the third step, the percentage dropped to 97.9% at Lin'an and 95.9% at Longfengshan. The error of the 2AP (2 axis position) in tracking sun-disk is the main cause for those direct and diffuse radiation data failing to meet the conditions of quality test, and the scenario is more frequent at the high SZA (solar zenith angle). Compared to the rate evaluated by the prevalent limit of global radiation error, the BSRN third step makes the rate of validated solar radiation data be reduced by 0.9% and 1.6% at Lin'an and Longfengshan, respectively. The thermal offset of CM21 pyrometer is from-5 W·m-2 to-2 W·m-2. With the compensation of thermal offset, the rate of radiation data meeting requirements of the BSRN quality test is obviously improved.It is well known that the most important factor affecting the surface solar radiation includes cloud, water vapor and aerosol. Therefore, variations of solar radiation with changes of SZA are analyzed with removal of cloud effect. It is identified that the global and direct radiation irradiances at Lin'an are obviously lower than those at Longfengshan with the same SZA, while the diffuse radiation is opposite. The cause for these phenomena is due to the lower atmospheric transparency and higher atmospheric turbidity at Lin'an.The annual averages of solar radiation and DLR at the sites are calculated. The annual averaged daily integrated global solar radiation and global solar radiation under clear condition at Lin'an are 12.4±7.2, 16.5±5.0 MJ·m-2, while the coincident average radiations at Longfengshan are 13.5±7.2, 15.5±6.2 MJ·m-2. Annual average DLR at Lin'an is 363.7±59.3 W·m-2, obviously higher than that at Longfengshan (274.9±77.6 W·m-2). There is an obvious decreasing trend of DLR at Lin'an, and global solar radiation takes on an increasing trend at Longfengshan under clear sky.
-
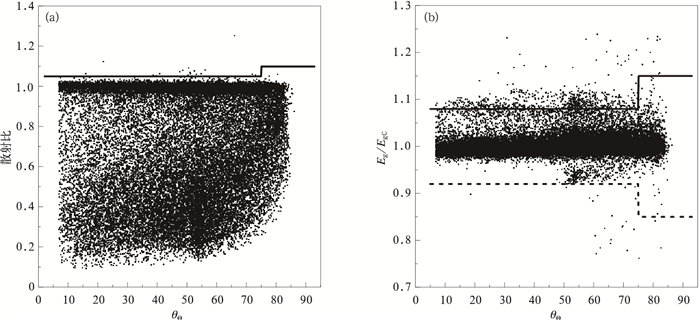
图 1 临安站第3层质量检验结果分布(实线为检验上限,虚线为检验下限)
(a) 散射比检验,(b)Eg/EgC检验
Fig. 1 Distributions of the radiation data meeting the third step of the quality test at Lin'an (solid and dotted lines denote testing maximum and minimum limits, respectively)
(a) diffuse ratio examination,(b)Eg/EgC examination

图 2 临安站三层质量控制数据
Fig. 2 Monthly rate of radiation data meeting the 3-step quality test at Lin'an
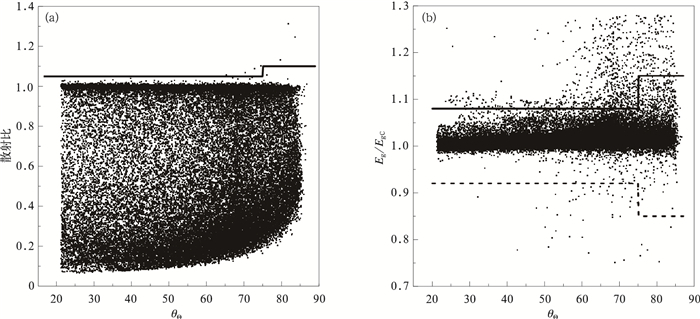
图 3 龙凤山站第3层质量检验结果分布 (实线为检验上限,虚线为检验下限)
(a) 散射比检验,(b)Eg/EgC检验
Fig. 3 Distributions of the radiation data meeting the third step of the quality test at Longfengshan (solid and dotted lines denote testing maximum and minimum limits, respectively)
(a) diffuse ratio examination, (b)Eg/EgC examination

图 4 龙凤山站三层质量控制数据通过率的逐月变化图
Fig. 4 Monthly rate of radiation data meeting the 3-step quality test at Longfengshan
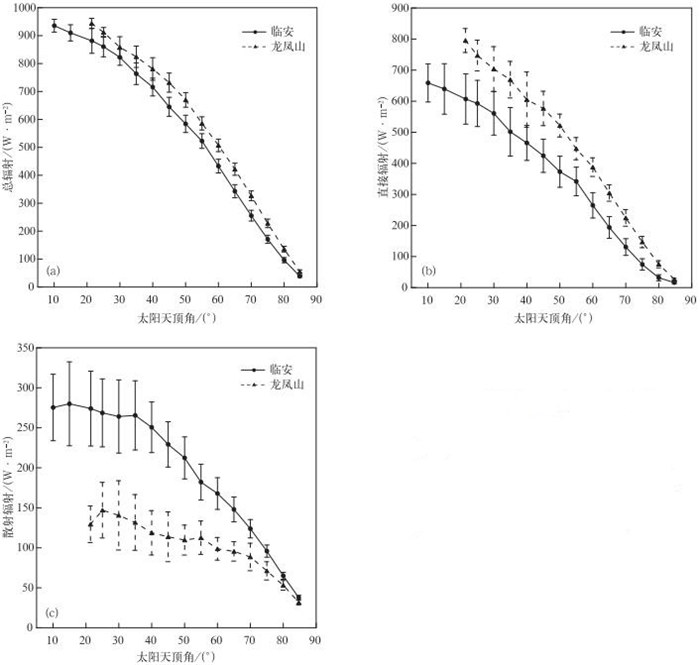
图 5 临安与龙凤山站地面太阳辐射随太阳天顶角变化
(a) 总辐射, (b) 直接辐射, (c) 散射辐射
Fig. 5 Variations of solar radiation with changes of solar zenith angle at Lin'an and Longfengshan (a) global radiation, (b) direct radiation, (c) diffuse radiation
表 1 各辐射仪器的夜间热偏移
Table 1 Thermal offsets of pyranometers at night
仪器 临安站 龙凤山站 型号 平均值/(W·m-2) 型号 平均值/(W·m-2) 总辐射表 CM21(#051465) -2.46±1.275 CM21(#051467) -3.07±1.039 散射辐射表 CM21(#051466) -2.12±0.769 CM21(#051468) -2.30±1.155 直接辐射表 CH1 (#050386) -0.19±0.218 CH1 (#050387) -0.04±0.409  下载: 导出CSV
表 2 物理可能限制检验与极端罕见限制检验参数设置 (单位:W/m2)[13]
Table 2 Parameters in the tests of physically possible and extremely rare limits (unit:W/m2)[13]
辐射量 物理可能限制检验 极端罕见限制检验 下限 上限 下限 上限 总辐射 -4 Sa×1.5×μ01.2+100 -2 Sa×1.2×μ01.2+50 散射辐射 -4 Sa×0.95×μ01.2+50 -2 Sa×0.75×μ01.2+30 直接辐射 -4 Sa -2 Sa×0.95×μ00.2+10 向下长波辐射 40 700 60 500 注:Sa为经过日地距离订正后的太阳常数,μ0为太阳天顶角的余弦值。
下载: 导出CSV
变量 下限 上限 参数范围 Ed/Eg 1.05 (Eg>50, θΘ < 75°) Ed/Eg 1.10 (Eg>50, 75° < θΘ < 93°) Eg/EgC 0.92 1.08 (EgC>50, θΘ < 75°) Eg/EgC 0.85 1.15 (EgC>50, 75° < θΘ < 93°)
下载: 导出CSV
表 4 2005—2011年临安站各辐射量通过前两层质量检验的统计结果
Table 4 Statistics of radiation data meeting the first two steps of the quality test at Lin'an from 2005 to 2011
辐射量 样本量 缺测率
/%第1层
通过率/%第2层
通过率/%总辐射 1773290 0.25 99.99 99.95 散射辐射 1773290 4.20 99.99 99.98 直接辐射 1773290 4.20 99.93 99.75 大气向下
长波辐射3347685 0.03 99.99 99.99
下载: 导出CSV
表 5 2005—2011年龙凤山站各辐射量通过前两层质量检验的统计结果
Table 5 Distribution of the radiation data meeting the first two steps of the quality test at Longfengshan from 2005 to 2011
辐射量 样本量 缺测率
/%第1层
通过率/%第2层
通过率/%总辐射 1661769 1.37 99.99 99.93 散射辐射 1661769 13.39 99.97 99.54 直接辐射 1661769 21.50 99.89 99.68 大气向下
长波辐射3068228 0.36 99.85 99.78
下载: 导出CSV
表 6 热偏移订正对数据质量评价结果的影响比例
Table 6 The rate of data meeting requirements of quality evaluation with or without thermal offset correction
站点 检验方案 总辐射 (√) 散射辐射 (√) 总辐射 (√) 散射辐射 (×) 总辐射 (×) 散射辐射 (√) θΘ < 75° θΘ>75° θΘ < 75° θΘ>75° θΘ < 75° θΘ>75° 临安 散射比检验 0.84% 4.96% 0.89% 4.93% -2.14% -0.41% Eg/EgC检验 0.77% 4.30% -0.23% -0.13% 0.36% 4.04% 第3层检验 1.03% 4.92% 0.14% 0.89% -1.73% 0.22% 龙凤山 散射比检验 0.40% 3.78% 0.42% 3.79% -1.40% -0.05% Eg/EgC检验 0.19% 3.02% -0.76% -1.62% 0.44% 3.79% 第3层检验 0.30% 3.50% -0.64% -1.09% -1.01% 1.31% 注:“√”表示进行热偏移订正处理,“×”表示未进行热偏移订正处理。
下载: 导出CSV
表 7 临安与龙凤山站总辐射与大气向下长波辐射的年平均统计
Table 7 The annual mean with standard deviations of Eg and DLR at Lin'an and Longfengshan
年份 临安站 龙凤山站 DLR/(W·m-2) Eg/(MJ·m-2) 晴空Eg/(MJ·m-2) DLR/(W·m-2) Eg/(MJ·m-2) 晴空Eg/(MJ·m-2) 年平均 标准偏差 年平均 标准偏差 年平均 标准偏差 年平均 标准偏差 年平均 标准偏差 年平均 标准偏差 2005* 368.4 62.97 11.6 6.32 14.2 2.57 281.4 78.22 11.5 6.17 14.9 5.19 2006 370.0 55.13 12.5 7.29 17.2 5.12 267.5 79.45 13.7 7.32 14.5 8.09 2007 369.9 55.85 12.8 7.21 16.5 4.97 263.0 66.99 14.1 7.67 14.4 6.11 2008 365.1 59.75 12.4 7.34 16.6 5.23 279.9 76.72 13.9 7.19 14.9 7.42 2009 361.0 58.77 11.6 7.08 17.0 5.23 277.5 82.49 12.6 6.82 14.2 4.47 2010 358.4 59.76 12.3 7.36 17.0 5.37 281.4 78.81 13.4 7.41 16.5 4.66 2011 355.9 63.19 12.5 7.01 16.0 5.10 277.0 78.43 13.9 7.12 17.2 7.17 注:*临安站观测从2005年8月5日开始;龙凤山站观测从2005年7月24日开始。
下载: 导出CSV
-
[1] 王炳忠.太阳辐射能的测量与标准.北京:科学出版社, 1988. http://www.cnki.com.cn/Article/CJFDTOTAL-SYQY201603027.htm [2] Shi G Y, Hayasaka T, Ohmura A, et al. Data quality assessment and the long-term trend of ground solar radiation in China. Journal of Applied Meterology and Climatology, 2008, 47:1006-1016. doi: 10.1175/2007JAMC1493.1 [3] Moradi Ⅰ. Quality control of global solar radiation using sunshine duration hours. Energy, 2009, 34:1-6. doi: 10.1016/j.energy.2008.09.006 [4] 李晓文, 李维亮, 周秀骥.中国近30年来太阳辐射状况研究.应用气象学报, 1998, 9(2): 24-31. http://qikan.camscma.cn/jams/ch/reader/view_abstract.aspx?file_no=19980104&flag=1 [5] Li X W, Zhou X J, Li W L, et al. The cooling of Sichuan Province in recent 40 years and its Probable Mechnisms. Acta Meteorologica Sinica, 1995, 9(1): 57-68. http://en.cnki.com.cn/Article_en/CJFDTOTAL-QXXW199501005.htm [6] 吴其重, 王自发, 崔英杰, 等.我国近20年太阳辐射时空分布状况模式评估.应用气象学报, 2010, 21(3): 343-351. http://qikan.camscma.cn/jams/ch/reader/view_abstract.aspx?file_no=20100310&flag=1 [7] 张云林, 秦伯强, 陈伟民, 等.太湖无锡地区太阳总辐射的气候计算及特征分析.应用气象学报, 2003, 14(3): 339-347. http://qikan.camscma.cn/jams/ch/reader/view_abstract.aspx?file_no=20030341&flag=1 [8] Che H Z, Shi G Y, Zhang X Y, et al. Analysis of 40 years of solar radiation data from China, 1961—2000. Geophys Res Lett, 32, 2005, L06803, doi: 10.1029/2004GL022322. [9] 郑有飞, 关福来, 蔡子颖, 等.我国南方中东部地区地面太阳总辐射变化规律.应用气象学报, 2011, 22(3): 312-320. http://qikan.camscma.cn/jams/ch/reader/view_abstract.aspx?file_no=20110307&flag=1 [10] 杨羡敏, 曾燕, 邱新法, 等. 1960—2000年黄河流域太阳总辐射气候变化规律研究.应用气象学报, 2005, 16(2): 243-248. doi: 10.11898/1001-7313.20050230 [11] 权继梅, 丁蕾, 郑向东, 等.总辐射表两种现场校准方法的比较.气象, 2010, 36(9): 116-119. doi: 10.7519/j.issn.1000-0526.2010.09.019 [12] 中国气象局监测网络司, 译.地面辐射基准站网操作手册.北京:气象出版社, 2004. [13] Long C N, Shi Y. An automated quality assessment and control algorithm for surface radiation measurements. The Open Atmospheric Science Journal, 2008, 2:23-37. doi: 10.2174/1874282300802010023 [14] Wild M, Gilgen H, Roesch A, et al. From dimming to brightening: Decadal changes in solar radiation at earth's surface. Science, 2005, 308(5723): 847-850. doi: 10.1126/science.1103215 [15] 中国气象局监测网络司, 译.全球大气本底观测指南.北京:气象出版社, 2003. [16] Kipp & Zonen Instruction Manual. CM21 Precision Pyranonmeter. 2004: 6-8. [17] 杨云, 丁蕾, 王冬.总辐射表夜间零点偏移试验与分析.气象, 2010, 36(11): 100-103. doi: 10.7519/j.issn.1000-0526.2010.11.015 [18] 程兴宏, 杨云, 宋建洋, 等.总日射表热偏移物理机制及订正方法研究进展.气象科技, 2013, 41(1): 1-7. http://www.cnki.com.cn/Article/CJFDTOTAL-QXKJ201301001.htm [19] 程兴宏, 张小玲, 郑向东, 等. PSP总日射表热偏移特征及其测量总辐射误差分析.太阳能学报, 2009, 30(1): 19-26. http://www.cnki.com.cn/Article/CJFDTOTAL-TYLX200901006.htm [20] Bush B C, Valero F P, Sabrina S A, et al. Characterization of thermal effects in pyranometers: A data correction algorithm for improved measurement of surface insolation. J Atmos and Ocean Tech, 2000, 17:165-175. doi: 10.1175/1520-0426(2000)017<0165:COTEIP>2.0.CO;2 [21] 权维俊, 陈洪斌, 高燕虎, 等.上甸子大气本底站太阳辐射观测数据的质量评价.高原气象, 2009, 28(1): 136-142. http://www.cnki.com.cn/Article/CJFDTOTAL-GYQX200901017.htm [22] Haeffelin M P, Domingues B C, Rutledge K, et al. Improved Measurements of the Diffuse and Global Solar Irradiances at the Surface of the Earth. Eleventh ARM Science Team Meeting Proceedings, 2001: 19-23. https://www.arm.gov/publications/proceedings/conf11/extended_abs/haeffelin_mp.pdf [23] Ohmura A, Dutton E G, Forgan B, et al. Baseline surface radiation network (BSRN/WCRP): New Precision Radiometry for Climate Research. Bull Am Meteor Soc, 1998, 79(10): 2115-2136. doi: 10.1175/1520-0477(1998)079<2115:BSRNBW>2.0.CO;2 [24] Long C N, Gaustad K L. The Shortwave (SW) Clear-Sky Detection and Fitting Algorithm: Algorithm Operational Details and Explanations. Atmospheric Radiation Measurement Program Technical Report, 2004. https://www.arm.gov/publications/tech_reports/arm-tr-004.pdf -

计量
- 摘要浏览量: 3270
- HTML全文浏览量: 1066
- PDF下载量: 1536
- 被引次数: 0
