
 设为首页
设为首页 加入收藏
加入收藏

An Experiment Study of All-sky Cloud Amount Observation Based on Infrared Real-time Threshold
-
摘要: 红外测温传感器在旋转平台控制下定时对全天空进行扫描,拼接全天空红外辐射亮温图像。利用天空中的云点与非云点在红外波段中表现出的不同特性,考虑不同仰角方向天空中云点与非云点的温度差异,结合地面环境参数,实时拟合天顶到水平区间内晴空时刻的温度阈值函数,利用阈值分割方式得出全天空云分布及云量信息。该方法可以有效减少地面环境参数及太阳光照对云图的影响,能够全天实时运行。将利用该方法获取的数据分别与人工观测数据及典型天气条件下可见光测云结果进行对比,结果表明该系统在云量观测方面具有一定的先进性和准确性。Abstract: The cloud typically covers about 50% of the earth surface, affecting the energy balance, water circulation of the earth, and influencing global climate. Cloud cover and cloud base height are the primary elements in the observation of clouds, wherein the cloud amount reflects the regional weather and climate characteristics. However, the operating artificial observation method for cloud amount in China lacks objectivity and costs too much workforce. Therefore, the research and development of an automatic measuring cloud device is extremely necessary.An infrared cloud detector based on the different characteristics of visible and infrared cloud images is developed in order to measure cloud amount. The infrared sensors regularly scan the whole sky under the control of the rotating platform, and stitching all-sky images of infrared brightness temperature. Based on the different characteristics of cloud images shown in infrared, different temperature at different elevation for the cloud point and non-cloud point is considered, combining with real-time infrared brightness temperature and ground environmental parameters. The temperature threshold functions are real-time determined from the zenith to the horizontal, the all-sky cloud distribution and cloud amount are derived using the method of segmentation. This method is effective in reducing the ground environmental parameters and the sunlight on the cloud images, and it can run properly throughout the day. The cloud measuring system can provide real-time analysis of the sky condition, cloud distribution and cloud amount. The system is fully automated and adaptable for all weather conditions, with high temporal resolution and accurate observation time, and it can show the cloud trajectory of the whole period and cloudiness trends.Measurements of cloud system has been performed experimental observation in the synthesize experiment base of Meteorological Observation Center of CMA since May 2011. Through the comparative data analysis with the results of artificial observations and the visible cloud images, this measurement of cloud systems are proved to be able to provide results with high accuracy.
-
Key words:
- cloud;
- cloud amount;
- infrared brightness temperature;
- rotating platform
-
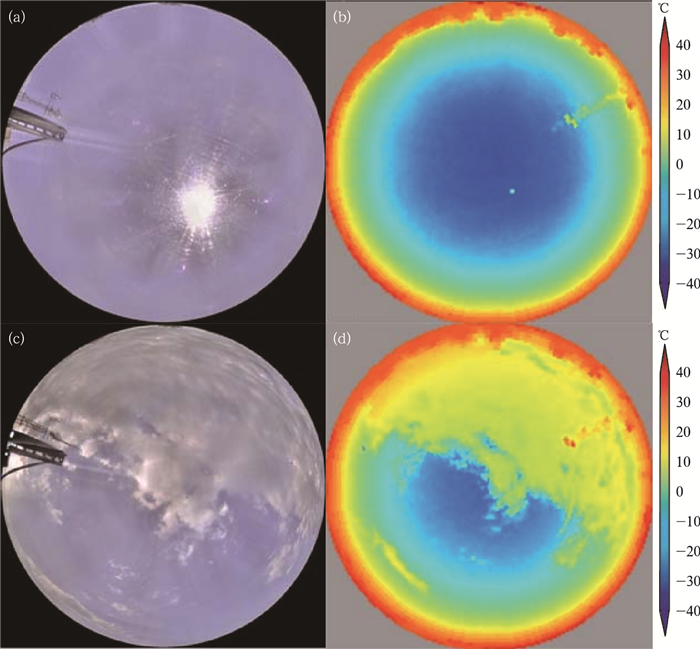
图 3 2011年7月7日可见光云图与全天空红外辐射亮温拼图
(a)11:32全天空可见光图片, (b)11:30开始扫描全天空红外辐射亮温拼图, (c)18:02全天空可见光图片, (d)18:00开始扫描全天空红外辐射亮温拼图
Fig. 3 The cloud images of visible light and the whole sky maps of brightness temperature
(a) the visible map at 1132 BT 7 July 2011, (b) the brightness map at 1130 BT 7 July 2011, (c) the visible map at 1802 BT 7 July 2011, (d) the brightness map at 1800 BT 7 July 2011

图 4 扫描时次与红外辐射亮温值之间的关系
(a) 晴空时刻天空亮温走势,(b) 有云时刻天空亮温走势
Fig. 4 Relations between scan time and infrared brightness temperature
(a) brightness temperature trends at clear sky moment, (b) cloudy brightness temperature trends at cloudy moment
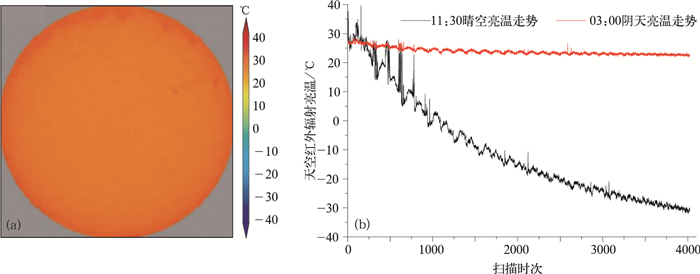
图 5 2011年7月7日全天空满云时红外辐射亮温拼图及亮温走势
(a)03:00开始扫描阴天时红外辐射亮温拼图, (b) 阴天与晴空时亮温走势
Fig. 5 Whole sky full of clouds, radiation image of brightness temperature and brightness temperature trends
(a) the brightness map at 0300 BT 7 July 2011, (b) cloudy and sunny brightness temperature trends
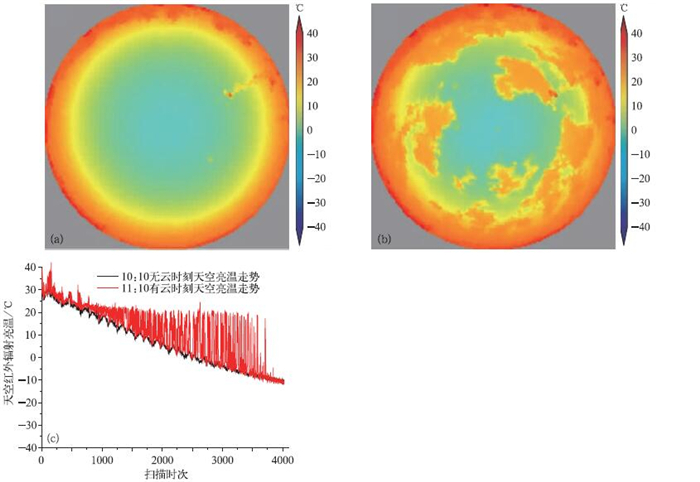
图 6 低能见度条件下扫描时次与红外辐射亮温值之间的关系
(a)2011年8月23日10:10开始扫描红外辐射亮温拼图, (b)2011年8月23日11:10开始扫描红外辐射亮温拼图, (c)图 6a与图 6b所代表天气的亮温走势
Fig. 6 Low-visibility, relations between scan time and infrared brightness temperature
(a) the brightness map at 1010 BT 23 August 2011, (b) the brightness map at 1110 BT 23 August 2011, (c) the brightness temperature trends of Fig. 6a and Fig. 6b
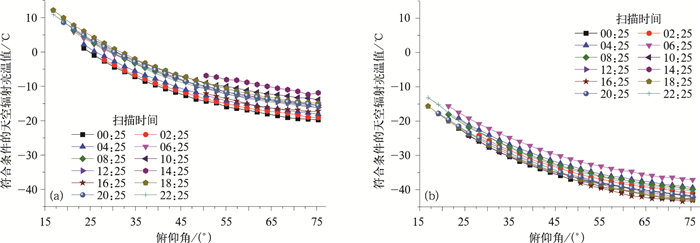
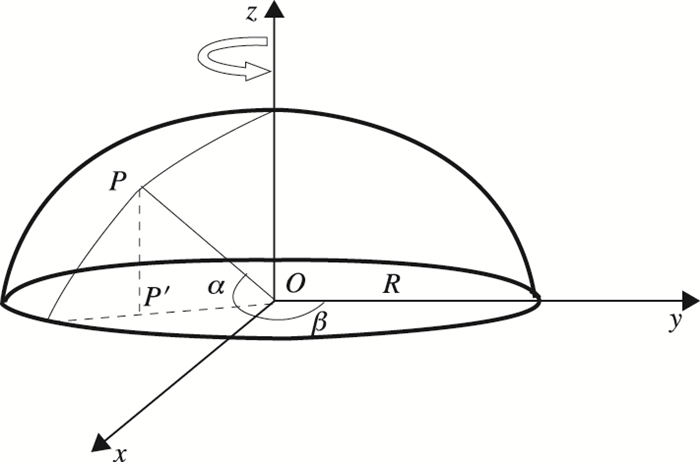
图 7 天空红外辐射亮温与俯仰角之间的关系
(a) 晴天不同时刻天空红外辐射亮温值走势,(b) 天空红外辐射亮温值减去地面温度后的走势
Fig. 7 Relations between infrared brightness temperature and pitch angle
(a) the brightness temperature trend of different time under the clear sky radiations, (b) the trend of sky brightness temperature minus the ground temperature
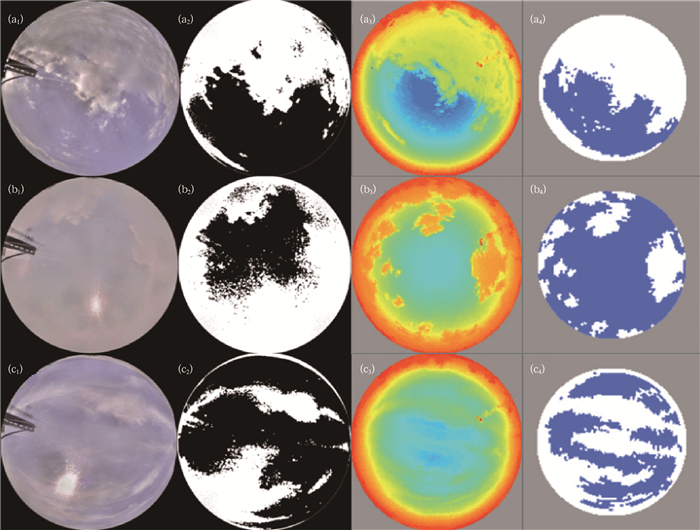
图 8 不同条件下可见光与红外云量对比
(a) 高能见度时中低云, (b) 低能见度时中低云, (c) 高能见度时卷云
Fig. 8 Comparisons of artificial observed cloud amount and infrared observed cloud amount
(a) middle and low cloud situations with high visibility, (b) middle and low cloud situations with low visibility, (c) cirrus with high visibility

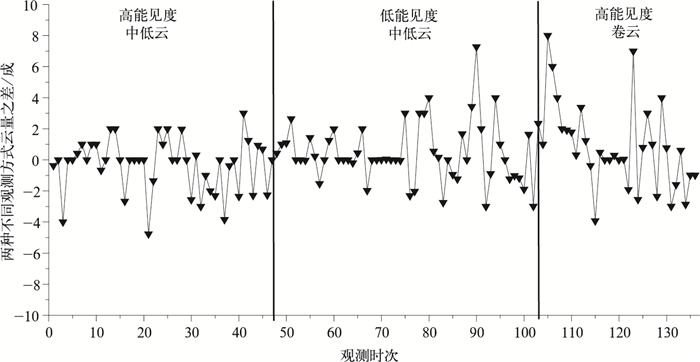
图 9 人工观测云量与地基红外测云系统反演云量分布
Fig. 9 The cloud amount distribution of manual observation and ground-based measurements of cloud systems
-
[1] 徐兴奎.中国区域总云量和低云量分布变化.气象, 2012, 38(1):90-95. doi: 10.7519/j.issn.1000-0526.2012.01.010 [2] 葛全胜, 王绍武, 方修琦.气候变化研究中若干不确定性的认识问题.地理研究, 2010, 29(2):191-203. http://www.cnki.com.cn/Article/CJFDTOTAL-DLYJ201002002.htm [3] 刘健, 张里阳.气象卫星高空间分辨率数据的云量计算与检验.应用气象学报, 2011, 22(1):35-45. doi: 10.11898/1001-7313.20110104 [4] 盛裴轩, 毛节泰, 李建国.大气物理学.北京:北京大学出版社, 2003:444-445. [5] 杨俊, 吕伟涛, 马颖.基于自适应阈值的地基云自动检测方法.应用气象学报, 2009, 20(6):713-721. doi: 10.11898/1001-7313.20090609 [6] 高太长, 刘磊, 赵世军.全天空测云技术现状及进展.应用气象学报, 2010, 21(1):101-109. doi: 10.11898/1001-7313.20100114 [7] Shields J E, Karr M E, Tooman T P, et al.The Whole Sky Imager—A Year of Progress.Eighth Atmospheric Radiation Measurement Science Team Meeting.1998. http://citeseerx.ist.psu.edu/viewdoc/summary?cid=2848244 [8] Long C N, Slater D W, Tooman T.Total Sky Imager Model 880 Status and Testing Results.ARM, TR-006, 2001. http://www.osti.gov/scitech/biblio/1020735-total-sky-imager-model-status-testing-results [9] 霍娟, 吕达仁.全天空数字相机观测云量的初步研究.南京气象学报, 2002, 25(2):242-246. http://www.cnki.com.cn/Article/CJFDTOTAL-NJQX200202014.htm [10] 朱彦良. 地基天空红外亮温的观测资料分析. 北京: 中国科学院大气物理研究所, 2005. [11] Genkova I, Long C N, Besnard T, et al.Assessing Cloud Spatial and Vertical Distribution with Infrared Cloud Analyzer.Fourteenth ARM Science Team Meeting Proceedings.2004. https://www.researchgate.net/publication/237332660_Assessing_Cloud_Spatial_and_Vertical_Distribution_with_Infrared_Cloud_Analyzer [12] 孙学金. 云的地基全天空红外遥感研究. 北京: 北京大学物理学院大气科学系, 2009. [13] Liou K N. 大气辐射导论. 郭彩丽, 周诗健, 译. 北京: 气象出版社, 2004: 122-127. [14] 章文星, 吕达仁, 常有礼.地基热红外亮温遥感云底高度可行性的模拟研究.地球物理学报, 2007, 50(2):354-363. http://www.cnki.com.cn/Article/CJFDTOTAL-DQWX200702003.htm [15] 胡树贞, 马舒庆, 陶法, 等.地基双波段测云系统及其对比试验.应用气象学报, 2012, 23(4):441-450. doi: 10.11898/1001-7313.20120407 [16] 章文星, 吕达仁, 宣越健, 等.利用扫描式红外亮温仪对天空云量的试验观测.气象学报, 2010, 68(6):808-821. doi: 10.11676/qxxb2010.077 [17] 孙学金, 刘磊, 高太长, 等.基于模糊纹理光谱的全天空红外图像云分类.应用气象学报, 2009, 20(2):157-163. doi: 10.11898/1001-7313.20090204 -

 下载:
下载:

计量
- 摘要浏览量: 3349
- HTML全文浏览量: 1203
- PDF下载量: 2675
- 被引次数: 0
