
 设为首页
设为首页 加入收藏
加入收藏

The Phase Features of a Cold Vortex over North China
-
摘要: 利用常规天气、地面危险天气报、自动站加密、NCEP/NCAR再分析资料等,对2011年7月12—20日持续9 d的华北冷涡过程阶段性特征进行分析。结果表明:冷涡过程降水主要分布在内蒙古东北部、华北和东北南部,发展阶段对流性强,多雷暴大风和冰雹,水汽来源于西南和东南气流,850 hPa上有强暖温度脊,高空急流较完整;减弱阶段以短时强降水为主,水汽来源于偏东气流;两阶段700 hPa以下为斜压,上升运动区主要位于东侧;发展阶段500 hPa为干区,南侧存在干空气侵入和θe梯度;减弱阶段整层相对湿度较大,θe锋区及不稳定度减弱。中层冷平流及中高层正涡度平流随高度增强是冷涡发展的主要因子,冷涡减弱是由低层冷平流进入冷涡中心、中层冷平流及中高层正涡度平流减弱共同影响所致。Abstract: Using the conventional weather data, disastrous weather data, hourly precipitation data observed by automatic weather station and NCEP/NCAR reanalysis data, the phase features over North China during 12—20 July in 2011 are analyzed. The result indicates that the precipitation of the vortex is located in the northeast of Mongolia, North China and the south of Northeast China. Thunderstorm, gale and hail occur in the development stage, while short-time strong rainfall occurs in the weakening stage. Strong warm ridge is located at 850 hPa, a full jet stream exists at 200 hPa, and cold-core structure is presented on the whole troposphere in the development stage. The strong warm ridge isn't obvious in the weakening stage, the east wind is enhanced at the lower layers, and the cold-core also increases. The vortex is baroclinic at 700 hPa, the ascending motion is located in the east area and becomes stronger in the weakening stage, and the southeast wind is also speeded up. The relative humidity is larger at 300 hPa and 700 hPa, but it's dry at 500 hPa, and the south of cold vortex is invaded by dry and cold air in the development stage. The relative humidity is large at the whole layer in the weakening stage, as the vapor is brought by east wind. A northeast—southwest θe frontal zone exists in both stages of the cold vortex. The gradient of θe becomes significantly strong in the development stage, and the structure is unstable with dry and cold at the upper layer while warm and wet at the lower layer in the vertical direction. The θe frontal zone and the unstable structure weakens in the weakening stage. The cold advection which is located at the low and middle layers and the vorticity advection which is located at the middle and high layers play main roles for the cold vortex in the development stage. As the cold advection at the low layer enters the cold vortex center, the cold advection becomes weak at the middle layer, the positive vorticity advection recedes at the medium-to-high level, and the cold vortex weakens.
-
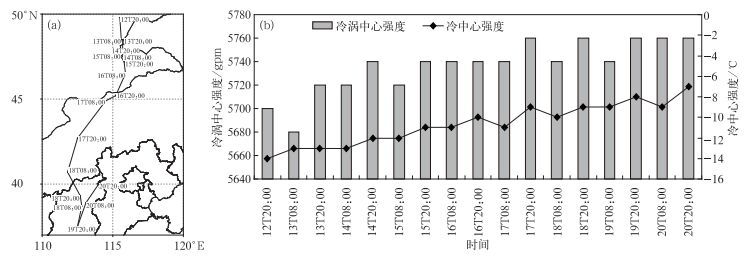
图 1 2011年7月12—20日500 hPa冷涡中心移动路径 (a) 及冷涡中心强度和冷中心强度日变化 (b)
Fig. 1 The cold vortex center moving path (a) and daily variation of cold vortex center intensity and cold center intensity (b) from 12 July to 20 July in 2011
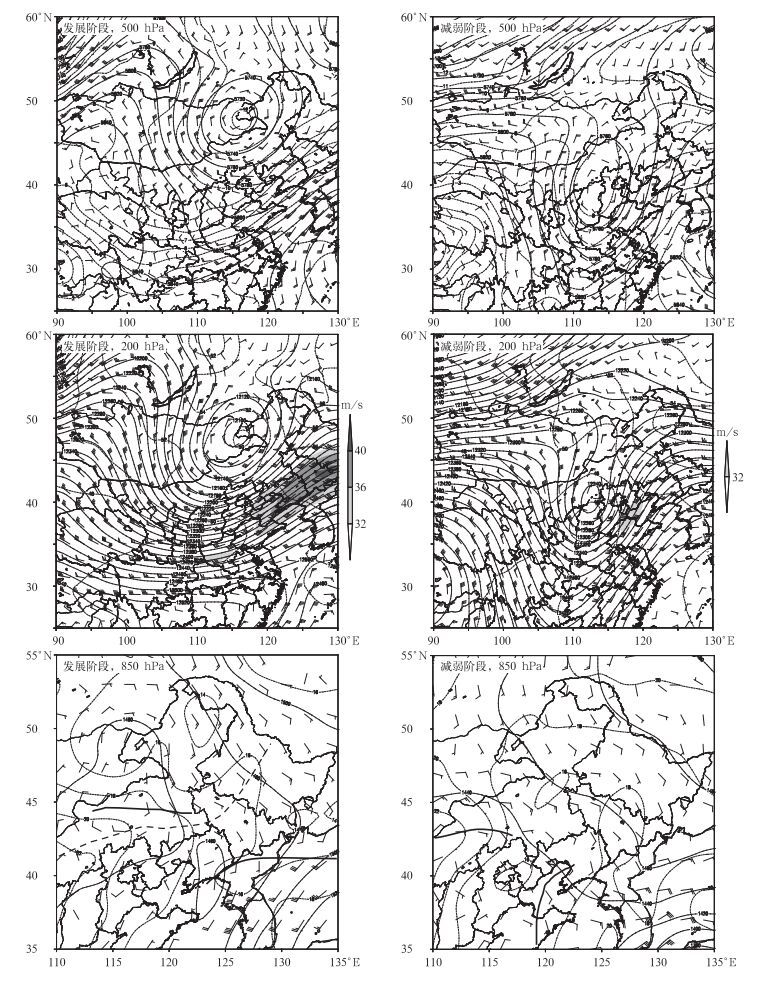
图 2 冷涡发展阶段和减弱阶段500 hPa, 200 hPa, 850 hPa环流形势 (实线为高度场,单位:gpm; 虚线为温度场,单位:℃; 阴影为200 hPa水平风;850 hPa环流场虚粗线为温度脊,粗实线为切变线)
Fig. 2 500 hPa, 200 hPa, 850 hPa geopotential height (solid line, unit:gpm), temperature (dash line, unit:℃), 200 hPa wind speed (the shaded), 850 hPa warm ridge (thick dash line), shear line (thick solid line) in the development stage and the weakening stage
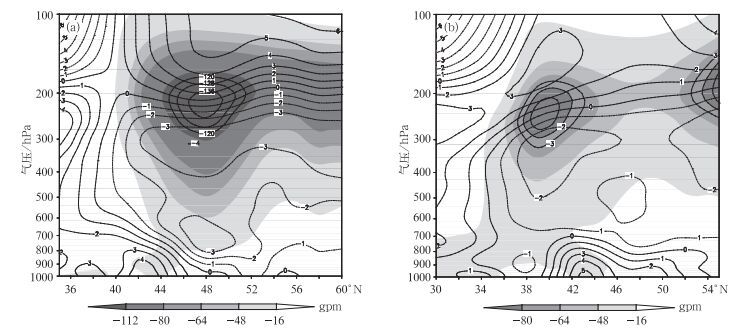
图 3 沿发展阶段 (a) 和减弱阶段 (b) 冷涡中心温度距平 (等值线,单位:℃; ) 和位势高度距平 (阴影) 的经向垂直剖面图
Fig. 3 Meridional section of temperature anomaly (contour, unit:℃) and height anomaly (the shaded, unit:gpm) along the cold vortex center in the development stage (a) and the weakening stage (b)

图 4 沿500 hPa冷涡中心发展阶段 (a) 和减弱阶段 (b) 经向风速 (等值线,单位:m/s) 垂直剖面图 (阴影为垂直上升区)
Fig. 4 Vertical cross-section of meridional wind (black line, unit:m/s) along the cold vortex center in the development stage (a) and the weakening stage (b)(the shaded denotes ascending motion)
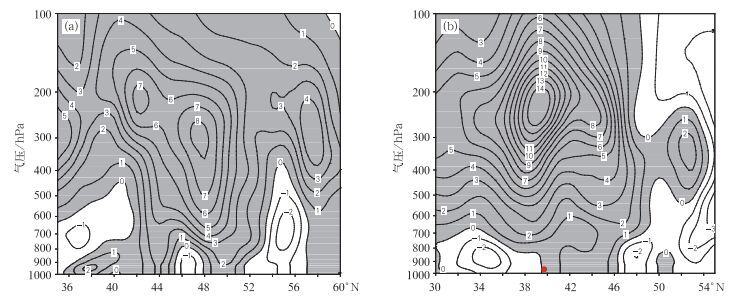
图 5 沿500 hPa冷涡中心发展阶段 (a) 和减弱阶段 (b) 相对涡度的经向垂直剖面图 (等值线为涡度,单位:10-5s-1;阴影为正涡度)
Fig. 5 Meridional cross-section of the relative vorticity (contour, unit:10-5s-1; the shaded denotes the positive value) along the cold vortex center in the development stage (a) and the weakening stage (b)

图 6 沿500 hPa冷涡中心发展阶段 (a) 与减弱阶段 (b) 相对湿度的经向垂直剖面图 (单位:%)
Fig. 6 Meridional cross-section of relative humidity (unit:%) along the cold vortex center at 500 hPa in the development stage (a) and the weakening stage (b)
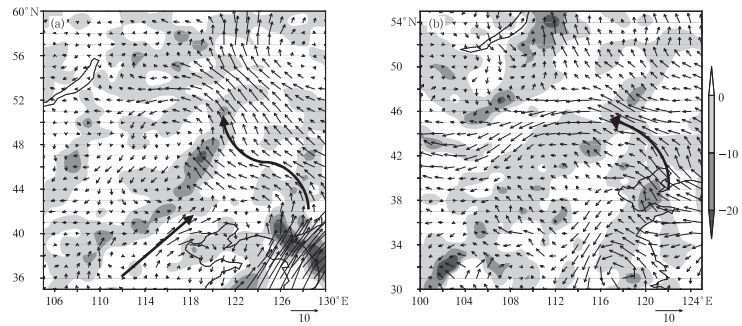
图 7 850 hPa冷涡发展阶段 (a) 和减弱阶段 (b) 水汽通量 (矢量, 单位:g/(cm·hPa·s)) 和水汽通量散度 (阴影, 单位:g/(cm·hPa2·s))
Fig. 7 The water vapor flux (vector, unit:g/(cm·hPa·s)) and the water vapor flux divergence (the shaded, unit:g/(cm·hPa2·s)) at 850 hPa in the development stage (a) and the weakening stage (b)

图 8 2011年7月13—20日冷涡发展阶段与减弱阶段相当位温分布 (单位:K)
(a) 发展阶段,850 hPa相当位温,(b) 减弱阶段,850 hPa相当位温,(c) 发展阶段过锋区40°N, 115°E相当位温时间-高度剖面图,(d) 减弱阶段过锋区39°N, 114.5°E相当位温时间-高度剖面图
Fig. 8 The potential temperature in the development stage and the weakening stage of cold vortex from 13 July to 20 July in 2011(unit:K)
(a) potential temperature at 850 hPa in the development stage, (b) potential temperature at 850 hPa in the weakening stage, (c) height-time section of potential temperature at 40°N, 115°E in the development stage, (d) height-time section of potential temperature at 39°N, 114.5°E in the weakening stage

图 9 2011年7月13—20日35°~50°N平均温度平流 (单位:10-5s-1) 和涡度平流 (单位:10-7s-2) 时间-纬向演变 (▲为冷涡中心所在位置)
(a)850 hPa温度平流, (b)500 hPa温度平流, (c)500 hPa涡度平流, (d)300 hPa涡度平流
Fig. 9 Evolution of thermal advection (unit:10-5s-1) and vorticity advection (unit:10-7s-2) averaged over 35°—50°N from 13 July to 20 July in 2011(▲ denotes the cold vortex center)
(a) thermal advection at 850 hPa, (b) thermal advection at 500 hPa, (c) vorticity advection at 500 hPa, (d) vorticity advection at 300 hPa
-
[1] 田秀霞, 邵爱梅.一次河北大暴雨的华北低涡结构和涡度收支分析.暴雨灾害, 2008, 27(4):320-325. http://www.cnki.com.cn/Article/CJFDTOTAL-HBQX200804006.htm [2] 李江波, 王宗敏, 王福侠, 等.华北冷涡连续降雹的特征与预报.高原气象, 2011, 30(4):1119-1131. http://www.cnki.com.cn/Article/CJFDTOTAL-GYQX201104030.htm [3] 刘海文, 丁一汇.华北汛期的起讫及其气候学分析.应用气象学报, 2008, 19(6):687-696. http://qikan.camscma.cn/jams/ch/reader/view_abstract.aspx?file_no=20080608&flag=1 [4] 郁珍艳, 何立富, 范广洲, 等.华北冷涡背景下强对流天气的基本特征分析.热带气象学报, 2011, 27(1):89-94. http://www.cnki.com.cn/Article/CJFDTOTAL-RDQX201101009.htm [5] 孙力, 安刚.1998年夏季嫩江和松花江流域东北冷涡暴雨的成因分析.应用气象学报, 2002, 13(2):156-162. http://qikan.camscma.cn/jams/ch/reader/view_abstract.aspx?file_no=20020220&flag=1 [6] 闵晶晶, 刘还珠, 曹晓钟, 等.天津"6.25"大冰雹过程的中尺度特征成因.应用气象学报, 2011, 22(5):525-536. doi: 10.11898/1001-7313.20110502 [7] 纪晓玲, 王式功, 穆建华, 等.宁夏雷暴天气过程划分及环流分型和环境场特征.应用气象学报, 2010, 21(3):329-334. doi: 10.11898/1001-7313.20100308 [8] 梁爱民, 张庆红, 申红喜, 等.北京地区雷暴大风预报研究.气象, 2006, 32(11):73-81. doi: 10.3969/j.issn.1000-0526.2006.11.012 [9] Ogura Y, Juang H M H.A case study of rapid cyclogensis over Canada.Part I:Diagnostic study.Mon Wea Rev, 1990, 118:655-672. doi: 10.1175/1520-0493(1990)118<0655:ACSORC>2.0.CO;2 [10] Juang H M H, Ogura Y.A case study of rapid cyclogensis over Canada.Part Ⅱ:Simulations.Mon Wea Rev, 1990, 118:674-704. doi: 10.1175/1520-0493(1990)118<0674:ACSORC>2.0.CO;2 [11] 钟水新, 王东海, 张人禾, 等.基于CloudSat资料的冷涡对流云带垂直结构特征.应用气象学报, 2011, 22(3):257-264. doi: 10.11898/1001-7313.20110301 [12] 杨红梅, 赵亚民. 冷涡暴雨的物理结构及概念模型//中尺度气象文集. 北京: 气象出版社, 1993. [13] Petterssen S, Smebye S J.On the development of extra tropical cyclones.Quart J R Meteor Soc, 1971, 97:457-482. doi: 10.1002/(ISSN)1477-870X [14] 丁一汇, 李鸿洲, 章名立, 等.我国飑线发生条件的研究.大气科学, 1982, 6(1):18-27. http://www.cnki.com.cn/Article/CJFDTOTAL-DQXK198201002.htm [15] 王欢, 寿绍文, 解以扬, 等.干侵入对2005年8月16日华北暴雨的作用.南京气象学院学报, 2008, 31(1):97-103. http://www.cnki.com.cn/Article/CJFDTOTAL-NJQX200801013.htm [16] 郁淑华, 肖玉华, 高文良.冷空气对高原低涡移出青藏高原的影响.应用气象学报, 2007, 18(6):737-747. doi: 10.11898/1001-7313.200706113 [17] Hsieh Yi-Ping.An investigation of a selected cold vortex over north America.J Atmos Sci, 1949, 6:401-410. doi: 10.1175/1520-0469%281949%29006%3C0401%3AAIOASC%3E2.0.CO%3B2 [18] 陶诗言.中国之暴雨.北京:科学出版社, 1980. http://www.cnki.com.cn/Article/CJFDTOTAL-SYQY201603027.htm [19] 刘英, 王东海, 张中锋, 等.东北冷涡的结构及其演变特征的个例综合分析.气象学报, 2012, 70(3):354-370. doi: 10.11676/qxxb2012.032 [20] 孙力, 王琪, 唐晓玲.暴雨类冷涡与非暴雨类冷涡的合成对比分析.气象, 1995, 21(3):7-10. doi: 10.7519/j.issn.1000-0526.1995.03.002 [21] 张云, 雷恒池, 钱贞成.一次东北冷涡衰退阶段暴雨成因分析.大气科学, 2008, 32(3):481-498. http://www.cnki.com.cn/Article/CJFDTOTAL-DQXK200803005.htm [22] Browning K A.The dry intrusion perspective of extra-tropical cyclone development.Meteor Appl, 1997, 4(4):317-324. doi: 10.1017/S1350482797000613 -

 下载:
下载:
计量
- 摘要浏览量: 3471
- HTML全文浏览量: 1077
- PDF下载量: 1368
- 被引次数: 0
