
 设为首页
设为首页 加入收藏
加入收藏

Multi-scale Satellite Data Sensitivity Study on Cloud Analysis of Strong Typhoon
-
摘要: 静止气象卫星的快速区域扫描是监测不同天气过程的有利手段。以获取的风云静止气象卫星快速区域扫描数据为基础,选取2011年台风梅花 (1109) 及2012年台风海葵 (1211) 的观测数据,采用Hovmöller分析图、变异系数等参数,研究不同时空分辨率观测数据对台风云系结构特征参数监测的敏感性影响。分析结果表明:可见光通道10 min观测时间间隔配以1.25 km空间分辨率可以很好地反映云系演变特征,在相同观测时间分辨率条件下,降低空间分辨率会对云系结构特征的提取有较大影响; 在相同空间分辨率条件下,观测时间分辨率的降低对云系结构及演变特征的分析影响较小; 基于变异系数的分析说明云像元特性在60 min的观测时间间隔下发生了较大变化,如果以60 min为观测时间间隔将会失去较多的云像元变化特征。水汽通道不同观测时间的变异系数差值小于红外通道1,说明云像元在红外通道1的特性演变对观测时间的敏感性高于水汽通道,提高观测频率可获取更多的云像元红外通道1的辐射特性。Abstract: The traditional obervation interval of Fengyun geostationary meteorological series satellite is 1 hour for a single satellite. During flooding season, the obervation frequency is imporived to half an hour. Double satellite observation mode can provide remote sensing data every 15 minutes. Due to the difference of observation angles and calibration error between different satellites, remote sensing data sometimes appear consistency and uniformity deviation. So improving observation frequency for a single satellite is the best way to get high quality remote sensing data. Rapid scan mode of geostationary meteorological satellites is an important method to monitor all kinds of weather processes.National Satellite Meteorological Center uses retired FY-2C satellite to carry out high frequency rapid regional scan observation trials and get continuous data with an average of 10-minute interval. Based on high frequency observations, Hovmöller diagram and coefficient of variation are used to analyze the sensitivity of multi-scale satellite data on monitoring the structure of a strong typhoon Muifa (2011).The research results show that the high frequency observations can clearly demonstrate the evolution of a strong typhoon cloud structure. Each channel with different spatial and temporal resolution has different sensitiveness in monitoring the structure feature of cloud. Reflectivity at visible channel with 1.25-kilometer spatial resolution and 10-minute temporal resoution can well show features of typhoon cloud. Under the same observation temporal resolution condition, lowering spatial resolution has great impact on monitoring the structure of cloud. If the spatial resolution keeps the same, reduced observation temporal resolution has less effect on extracting the characteristics of clouds. Using Hovmöller diagram to compare cloud brightness temperature characteristics through infrared window channel under different temporal resolution, it can be seen that there is no great difference between 10-minute and 30-minute observation modes. The cloud features are greatly reduced after the observation interval being changed to 60 minutes. The results also show that the cloud characteristics change greatly during 60 minutes based on brightness temperature coefficient of variation difference. Because the brightness temperature coefficient of variation at water vapor channel is smaller than infrared channel, the evolution of cloud characters observed by infrared window channel is more sensitive than that by water vapor channel. So improved observation temporal resolution can get more cloud information through infrared window channel.
-
Key words:
- resolution;
- satellite data;
- strong typhoon;
- cloud analysis
-
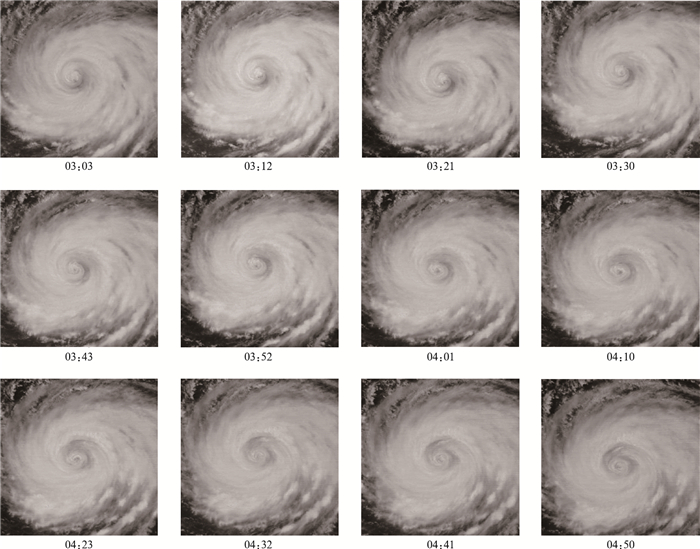
图 1 2011年8月3日03:03—04:50平均观测时间间隔为10 min的空间分辨率为1.25 km台风梅花 (1109) 中心云区可见光通道反射率图像
Fig. 1 The reflectivity image of typhoon Muifa (2011) of FY-2C visible channel during 0303 UTC—0450 UTC on 3 August 2011 with the spatial resolution of 1.25 km and the temporal resolution about 10 minutes
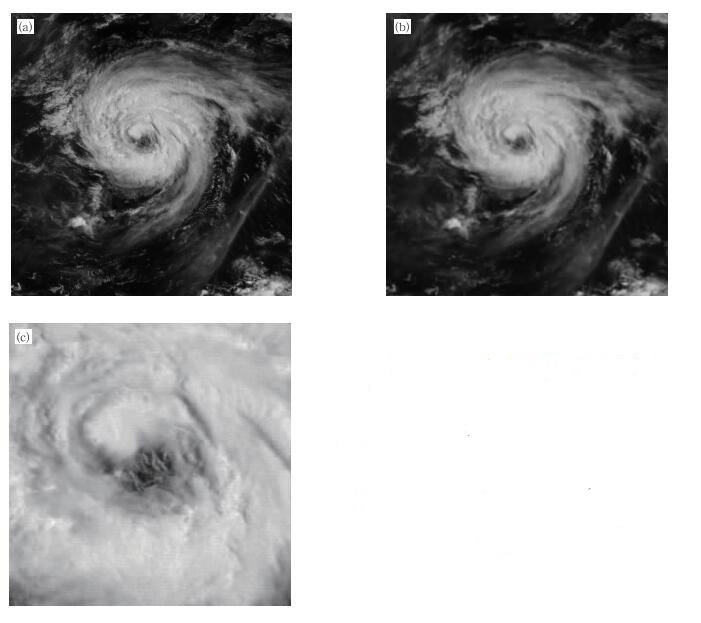
图 2 2012年8月7日01:00 FY-2F气象卫星空间分辨率1.25 km (a)、5 km (b) 台风海葵 (1211) 云系和1.25 km分辨率台风眼区 (c) 可见光通道反射率图像
Fig. 2 Reflectivity image of typhoon Haikui (2012) of FY-2F visible channel at 0100 UTC 7 Aug 2012 (a) typhoon image with the spatial resilution of 1.25 km, (b) typhoon image with the spatial resolution of 5 km, (c) typhoon eye image with the spatial resolution of 1.25 km
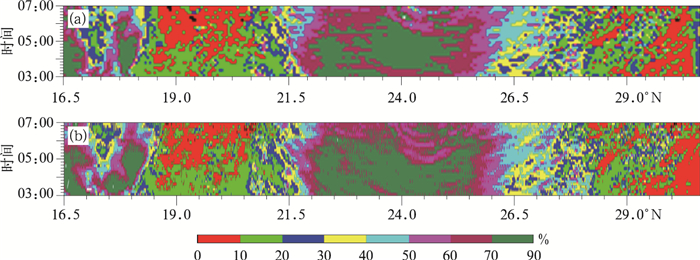
图 3 2011年8月3日03:03—07:03平均观测时间间隔10 min的空间分辨率为5 km (a) 和1.25 km (b) 台风梅花 (1109) 云系Hovmöller分析图
Fig. 3 The reflectivity Hovmöller diagram of typhoon Muifa (2011) during 0303 UTC— 0703 UTC on 3 Aug 2011 with the spatial resolution of 5 km (a) and 1.25 km (b) and the temporal resolution about 10 minutes

图 4 2011年8月3日04:10 1.25 km空间分辨率可见光通道反射率图像
(图中黑框为Hovmöller分析区范围)
Fig. 4 The reflectivity image of visible channel at 0410 UTC 3 Aug 2011 with the spatial resolution of 1.25 km
(black box in the image shows the analysis area used by Hovmöller diagram)

图 5 2011年8月3日03:03—07:03空间分辨率为1.25 km、平均观测时间间隔为30 min (a) 和10 min (b) 台风梅花 (1109) 云系Hovmöller分析图
Fig. 5 The reflectivity Hovmöller diagram of typhoon Muifa (2011) during 0303 UTC— 0703 UTC on 3 Aug 2011 with the spatial resolution of 1.25 km and the temporal resolution about 30 minutes (a) and 10 minutes (b)
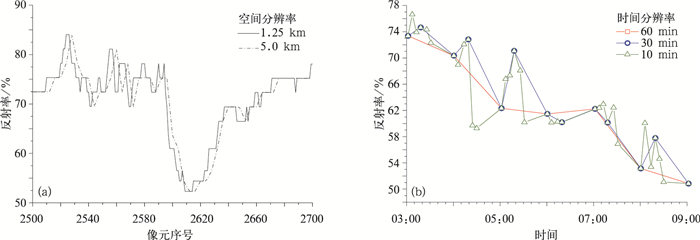
图 6 台风梅花 (1109) 眼区及眼区周边云墙2011年8月3日03:03不同空间分辨率 (a) 和2011年8月3日03:00—09:00不同时间分辨率 (b) 可见光通道反射率剖线
Fig. 6 Reflectivity profile around eye and convective wall of typhoon Muifa (2011) with different spatial resolutions at 0303 UTC 3 Aug 2011(a) and with different temperal resolutions during 0300 UTC—0900 UTC on 3 Aug 2011(b)

图 7 2011年8月3日03:03—14:50空间分辨率为5 km平均观测时间间隔为10 min (a)、30 min (b) 和60 min (c) 台风梅花 (1109) 云系红外通道1亮温的Hovmöller分析图
Fig. 7 The brightness temperature Hovmöller diagram of typhoon Muifa (2011) of infrared window channel during 0303 UTC—1450 UTC on 3 Aug 2011 with spatial resolution of 5 km and the temporal resolutions about 10 minutes (a), 30 minutes (b) and 60 minutes (c)
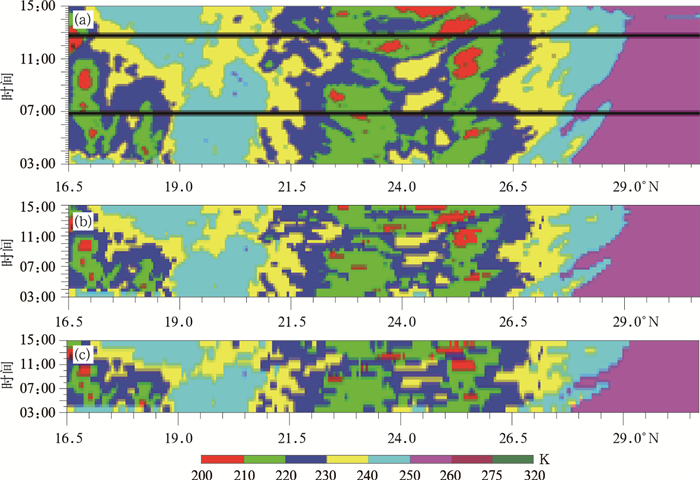
图 8 2011年8月3日03:03—14:50空间分辨率为5 km平均观测时间间隔为10 min (a)、30 min (b) 和60 min (c) 台风梅花 (1109) 云系水汽通道亮温的Hovmöller分析图
Fig. 8 The brightness temperature Hovmöller diagram of typhoon Muifa (2011) of water vapor channel during 0303 UTC—1450 UTC on 3 Aug 2011 with the spatial resolution of 5 km and the temporal resolution about 10 minutes (a), 30 minutes (b) and 60 minutes (c)
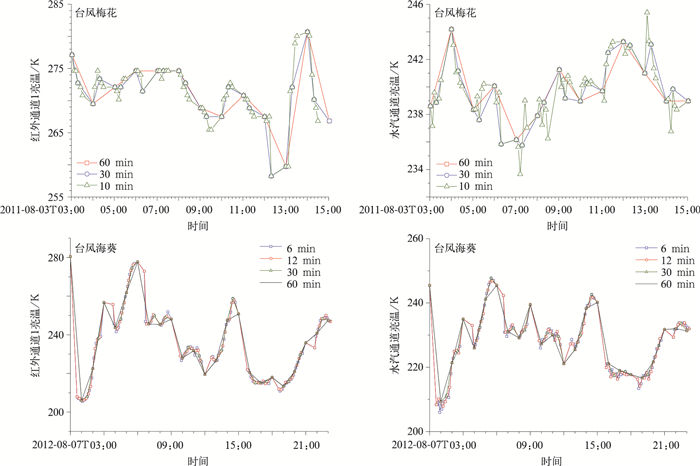
图 9 不同观测时间间隔台风梅花 (1109) 和台风海葵 (1211) 眼区红外通道1亮温和水汽通道亮温随时间的演变
Fig. 9 The change of eye area brightness temperature of typhoon Muifa (2011) and typhoon Haikui (2012) of infrared window channel and water vapor channel with different temporal resolutions
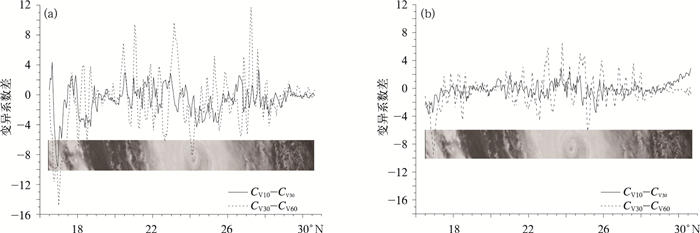
图 10 红外通道1(a) 和水汽通道 (b) 不同观测时间分辨率的变异系数差值经向分布
Fig. 10 The distribution of CV difference between different observation temporal resolutions as the function of latitude for infrared window channel (a) and water vapor channel (b)
表 1 红外通道1和水汽通道的不同观测时间间隔推算值与观测值差值等级像元百分比
Table 1 The pixel percentage of different brightness temperature level between extrapolated and observed data of infrared window channel and water vapor channel
推算值与实测值
差值分类红外通道1 水汽通道 10 min 30 min 10 min 30 min [0, 1) 58.7% 41.7% 65.2% 41.7% [1, 2) 21.7% 8.3% 19.6% 33.3% [2, 3) 10.9% 25.0% 10.9% 16.7% [3, 4) 4.3% 16.7% 4.3% 8.3% [4, 5) 2.1% 0.0% [5, 6) 0.0% 8.3% [6, 7) 2.1%  下载: 导出CSV
-
[1] 徐金霞, 刘奇俊, 宋振鑫.台风"莫拉克"降水观测与云物理特征的模拟研究.成都信息工程学院学报, 2012, 27(3):292-301. http://www.cnki.com.cn/Article/CJFDTOTAL-CDQX201203013.htm [2] 王毅, 孙佳俊, 韩永, 等.基于卫星云图的台风云系特征提取算法研究.遥感技术与应用, 2011, 26(3):287-292. doi: 10.11873/j.issn.1004-0323.2011.3.287 [3] 王艳, 郑栋, 张义军.2000—2007年登陆台风中闪电活动与降水特征.应用气象学报, 2011, 22(3):321-326. doi: 10.11898/1001-7313.20110308 [4] 詹奕哲, 王振会, 官莉, 等.卫星导风在台风路径预报中的应用进展.地球科学进展, 2011, 26(4):386-392. http://www.cnki.com.cn/Article/CJFDTOTAL-DXJZ201104005.htm [5] 赵姝慧, 周毓荃.利用多种卫星研究台风"艾云尼"宏微观结构特征.高原气象, 2010, 29(5):1254-1260. http://www.cnki.com.cn/Article/CJFDTOTAL-GYQX201005019.htm [6] 郭荣芬, 肖子牛, 陈小华, 等.两次西行热带气旋影响云南降水对比分析.应用气象学报, 2010, 21(3):317-327. doi: 10.11898/1001-7313.20100307 [7] 杜明斌, 杨引明, 杨玉华, 等.FY-3A微波资料偏差订正及台风路径预报应用.应用气象学报, 2012, 23(1):89-94. http://qikan.camscma.cn/jams/ch/reader/view_abstract.aspx?file_no=20120110&flag=1 [8] Rodgers E, Gentry R C, Shenk W, et al.The benefits of using short interval satelliteimages to derive winds for tropical cyclones.Mon Wea Rev, 1979, 107:575-584. doi: 10.1175/1520-0493(1979)107<0575:TBOUSI>2.0.CO;2 [9] Uchida H, Oshima T, Hamada T, et al.Low-level cloud motion wind field estimatedfrom GMS short interval images in typhoon vicinity.Geophys Mag, 1991, 44:37-50. [10] Takata S.Current Status of GMS Wind and Operational Low-level Wind Derivation in a Typhoon Vicinity from Short-time Interval images.Proceedings of the 2nd International Winds Workshop, Ascona, Switzerland, 1993:29-36. http://www.indjst.org/index.php/indjst/article/view/30162/0 [11] Velden C S, Stettner D, Daniels J.Wind Wector Fields Derived from GOES Rapid-scanimagery.Proceedings of the 10th Conference on Satellite Meteorology and Oceanography, American Meteorological Society, 2000:20-23. [12] Velden C, Daniels J, Stettner D, et al.Recent innovations in deriving tropospheric winds from meteorological satellites.Bull Amer Meteor Soc, 2005, 2:205-223. doi: 10.1175/BAMS-86-2-205 [13] Hamada T.On the Optimal Time-interval of Satellite Image Acquisition for Operational Cloudmotion Wind Derivation.MetCenter Technical Note, 1983, 7:79-87. [14] Shenk W E.Suggestions for improving the derivation of winds from geosynchronous satellites.Global and Planetary Change, 1991, 4:165-171. doi: 10.1016/0921-8181(91)90087-D [15] Hovmöller Ernest.The trough-and-ridge diagram.Tellus, 1949, 1(2):62-66. doi: 10.3402/tellusa.v1i2.8498 -

计量
- 摘要浏览量: 3567
- HTML全文浏览量: 1080
- PDF下载量: 1014
- 被引次数: 0
