Relationship Between Lightning and Precipitation Based on Classification of Atmospheric Stratification and Development of Thunderstorm
-
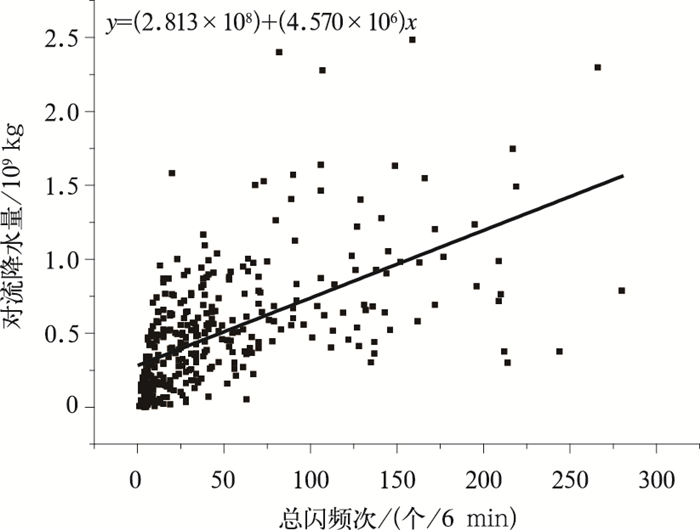
摘要: 选取2006—2008年发生在北京及其周边地区的28次雷暴过程,基于大气不稳定度参数和雷达参量对雷暴过程进行分类,分析了不同分类条件下的总闪电活动 (SAFIR3000三维闪电定位系统观测) 和对流降水 (雷达反演) 的关系。结果表明:整体而言,总闪对应降水量的平均值为1.92×10⁷ kg·fl-1。依据对流有效位能和抬升指数对雷暴进行分类的分析表明,较强的不稳定状态对应了较小的总闪对应降水量,同时总闪频次和对流降水量的相关性更好。基于雷达特征参数的分类分析表明,总闪对应降水量在对流运动较弱情况下最小,其次是对流运动较强的情况下,而对流运动适中时最大。Abstract: A total of 28 thunderstorms occurring in and around Beijing area from 2006 to 2008 are picked to investigate the relationship between total lightning (observed by SAFIR3000) and convective precipitation (by radar inversion). These cases are classified according to parameters of the atmospheric stratification where they are generated and the reflectivity of radar. The quantitative results can provide a reference for the applications of lightning data on severe weather warning and precipitation estimation. The lightning forecast can also be improved by assimilating the relationship between the hydrometeors and the lightning activities to the numerical prediction models. The analysis can extend the application field of the lightning data.The results show that the average convective rain yields per flash is 1.92×10⁷ kg·fl-1 on the whole, while the linear correlation coefficient between the total lightning frequency and convective precipitation is 0.584. Total lightning frequency (expressed by F with the time space being 6 min) can be used to calculate the amount of convective precipitation with the equation R=(2.813×10⁸)+(4.570×10⁶)F. A total of 28 thunderstorms are classified according to the convective available potential energy (ECAP) and lifting index IL of the atmospheric stratification where they are generated. It is explored that strong instability of atmospheric stratification tends to be associated with smaller precipitation and more pronounced correlation between total lightning and precipitation. Of which, the classification of ECAP no less than 1600 J·kg-1 has the correlation coefficient of 0.837, the total lightning frequency can be used to calculate the amount of convective precipitation with the equation of R=(1.620×10⁸)+(5.478×10⁶)F. While the classification of IL no less than 4 K has the correlation coefficient of 0.853, the total lightning frequency can be used to calculate the area of the amount of convective precipitation with the equation of R=(1.530×10⁸)+(6.276×10⁶)F. Another three parameters calculated from radar reflectivity, i.e., maximum height of 20 dBZ reflectivity, maximum reflectivity at 12 km level, and volume ratio of the reflectivity larger than 30 dBZ above 0℃ to the reflectivity larger than 40 dBZ above 0℃, in terms of their radar volume scans. The most pronounced relationships between lightning and precipitation occur in the classification of H20 dBZ < 11.5 km, 25 dBZ ≤f12 km < 35 dBZ, and V40/30 < 0.39, when the correlation coefficients are 0.804, 0.609 and 0.750, respectively. The linear correlation between lightning and precipitation show obvious differences in different classifications. The fitting equations in different classifications are revealed, which will provide references for the application of relationships between lightning and precipitation according to the characteristics of thunderstorm processes.
-
Key words:
- lightning;
- precipitation;
- atmospheric stratification;
- radar parameters
-
表 1 不同ECAP分类下总闪对应降水量的统计值
Table 1 Statistics of rain yields per flash based on the classification of ECAP
ECAP
/(J·kg-1)最小值
/(105 kg·fl-1)最大值
/(107 kg·fl-1)算术平均值
/(107 kg·fl-1)累积百分比分布/(106 kg·fl-1) 5% 95% 25% 75% ECAP < 1000 1.84 6.81 1.98 2.37 59.90 7.41 25.50 1000≤ECAP < 1600 6.80 11.50 2.02 3.08 66.00 5.74 23.10 ECAP≥1600 5.00 5.37 1.50 3.13 37.60 7.08 19.70 表 2 不同ECAP分类下总闪频次和对流降水量的线性拟合关系
Table 2 Linear fitting between total lightning frequency and convective precipitation based on the classification of ECAP
ECAP/(J·kg-1) 相关系数 F检验 F0.05 是否通过检验 回归方程 ECAP < 1000 0.464 42.258 3.89 是 R=(3.649×10⁸)+(3.413×10⁶)F 1000≤ECAP<1600 0.505 41.371 3.92 是 R=(2.683×10⁸)+(4.448×10⁶)F ECAP≥1600 0.837 154.929 4.00 是 R=(1.620×10⁸)+(5.478×10⁶)F 表 3 不同IL分类下总闪对应降水量的统计值
Table 3 Statistics of rain yields per flash based on the classification of IL
IL/K 最小值
/(105 kg·fl-1)最大值
/(107 kg·fl-1)算术平均值
/(107 kg·fl-1)累积百分比分布/(106 kg·fl-1) 5% 95% 25% 75% IL < 0 35.80 9.09 2.26 4.55 66.90 8.73 22.80 0≤IL<4 1.84 8.66 1.98 2.73 63.80 5.80 25.30 IL≥4 4.08 6.25 1.76 2.16 52.00 6.81 22.30 表 4 不同IL分类下总闪频次和对流降水量的线性拟合关系
Table 4 Linear fitting between total lightning frequency and convective precipitation based on the classification of IL
IL/K 相关系数 F检验 F0.05 是否通过检验 回归方程 IL < 0 0.719 44.971 4.08 是 R=(3.580×10⁸)+(3.375×10⁶)F 0≤IL < 4 0.493 57.758 3.94 是 R=(3.377×10⁸)+(4.469×10⁶)F IL≥4 0.853 328.337 3.92 是 R=(1.530×10⁸)+(6.276×10⁶)F 表 5 不同H20 dBZ分类总闪对应降水量的统计值
Table 5 Statistics of rain yields per flash based on the classification of H20 dBZ
H20 dBZ/km 最小值
/(105 kg·fl-1)最大值
/(107 kg·fl-1)算术平均值
/(107 kg·fl-1)累积百分比分布/(106 kg·fl-1) 5% 95% 25% 75% H20 dBZ < 11.5 1.84 17.30 2.09 0.94 65.20 4.74 22.30 11.5≤H20 dBZ < 13.5 17.00 10.00 2.83 4.80 78.50 10.70 38.20 H20 dBZ≥13.5 32.10 6.81 2.14 4.94 58.60 8.05 30.90 表 6 不同H20 dBZ分类总闪频次和对流降水量的线性拟合关系
Table 6 Linear fitting between total lightning frequency and convective precipitation based on the classification of H20 dBZ
H20 dBZ/km 相关系数 F检验 F0.05 是否通过检验 回归方程 H20 dBZ < 11.5 0.804 174.041 3.95 是 R=(1.168×10⁸)+(6.133×10⁶)F 11.5≤H20 dBZ < 13.5 0.588 43.830 3.97 是 R=(2.522×10⁸)+(6.572×10⁶)F H20 dBZ≥ 13.5 0.663 71.500 3.95 是 R=(3.377×10⁸)+(4.893×10⁶)F 表 7 不同f12 km分类总闪对应降水量的统计值
Table 7 Statistics of rain yields per flash based on the classification of f12 km
f12 km/dBZ 最小值
/(105 kg·fl-1)最大值
/(107 kg·fl-1)算术平均值
/(107 kg·fl-1)累积百分比分布/(106 kg·fl-1) 5% 95% 25% 75% f12 km < 25 1.84 4.81 1.43 1.29 45.20 5.89 39.40 25≤f12 km < 35 37.00 7.85 2.26 4.65 60.60 9.05 30.80 f12 km≥35 14.10 9.36 1.91 2.28 65.70 6.11 21.40 表 8 不同f12 km分类下总闪频次和对流降水量的线性拟合关系
Table 8 Linear fitting between total lightning frequency and convective precipitation based on the classification of f12 km
f12 km/dBZ 相关系数 F检验 F0.05 是否通过检验 回归方程 f12 km < 25 0.597 54.879 3.95 是 R=(1.302×10⁸)+(5.988×10⁶)F 25≤f12 km < 35 0.609 66.011 3.93 是 R=(2.749×10⁸)+(5.704×10⁶)F f12 km≥35 0.375 14.518 3.96 是 R=(5.360×10⁸)+(1.912×10⁶)F 表 9 不同V40/30分类下总闪对应降水量的统计值
Table 9 Statistics of rain yeilds per flash based on the classification of V40/30
V40/30 最小值
/(105 kg·fl-1)最大值
/(107 kg·fl-1)算术平均值
/(107 kg·fl-1)累积百分比分布/(106 kg·fl-1) 5% 95% 25% 75% V40/30 < 0.39 1.84 6.11 1.52 1.25 48.70 5.74 19.50 0.39≤V40/30 < 0.48 22.40 5.57 1.58 3.72 36.20 7.25 21.20 V40/30≥0.48 18.10 9.09 2.56 3.59 68.90 7.78 39.90 表 10 不同V40/30分类下总闪频次和对流降水量的线性拟合关系
Table 10 Linear fitting between total lightning frequency and convective precipitation based on the classification of V40/30
V40/30 相关系数 F检验 F0.05 是否通过检验 回归方程 V40/30 < 0.39 0.750 154.374 3.92 是 R=(5.889×10⁷)+(9.230×10⁶)F 0.39≤V40/30 < 0.48 0.596 54.102 3.97 是 R=(3.133×10⁸)+(4.399×10⁶)F V40/30≥0.48 0.663 71.500 3.95 是 R=(4.289×10⁸)+(3.945×10⁶)F -
[1] 张义军, 周秀骥.雷电研究的回顾和进展.应用气象学报, 2006, 17(6):829-834. doi: 10.11898/1001-7313.20060619 [2] Soriano L R, Pablo F D.Analysis of convective precipitation in the western Mediterranean Sea through the use of cloud-to-ground lightning. Atmos Res, 2003, 66:189-202. doi: 10.1016/S0169-8095(02)00160-6 [3] Alexander G D, Weinman J A, Karyampudi V M, et al.The effect of assimilating rain rates derived from satellites and lightning on forecasts of the 1993 superstorm. Mon Wea Rev, 1999, 127:1433-1457. doi: 10.1175/1520-0493(1999)127<1433:TEOARR>2.0.CO;2 [4] Williams E R, Geotis S G, Renno N, et al.A radar and electrical study of tropical "hot towers". J Atmos Sci, 1992, 49:1386-1395. doi: 10.1175/1520-0469(1992)049<1386:ARAESO>2.0.CO;2 [5] Pineda N, Rigo T, Bech J, et al.Lightning and precipitation relationship in summer thunderstorms:Case studies in the North Western Mediterranean region. Atmos Res, 2007, 85:159-170. doi: 10.1016/j.atmosres.2006.12.004 [6] Petersen W A, Rutledge S A.On the relationship between cloud-to-ground lightning and convective rainfall. J Geophys Res, 1998, 103(12):14025-14040. doi: 10.1029/97JD02064/references [7] 周筠君, 郄秀书, 王怀斌, 等.利用对地闪的观测估算对流性天气中的降水.高原气象, 2003, 22(2):168-172. http://www.cnki.com.cn/Article/CJFDTOTAL-GYQX200302011.htm [8] 郑栋, 张义军, 孟青, 等.北京地区雷暴过程闪电与地面降水的相关关系.应用气象学报, 2010, 21(3):287-297. doi: 10.11898/1001-7313.20100304 [9] Soriano L R, de Pablo F, Diez E G.Relationship between convective precipitation and cloud-to-ground lightning in the Iberian Peninsula. Mon Wea Rev, 2001, 129:2998-3003. doi: 10.1175/1520-0493(2001)129<2998:RBCPAC>2.0.CO;2 [10] 郑栋, 但建茹, 张义军, 等.我国地闪活动和降水关系的区域差异.热带气象学报, 2012, 28(4):569-576. http://www.cnki.com.cn/Article/CJFDTOTAL-RDQX201204017.htm [11] Chang D E, Weinman J A, Morales C A, et al.The effect of space borne microwave and ground-based continuous lightning measurements on forecasts of the 1998 Groundhog Day storm. Mon Wea Rev, 2001, 129:1809-1833. doi: 10.1175/1520-0493(2001)129<1809:TEOSMA>2.0.CO;2 [12] 周筠君, 郄秀书, 张义军, 等.地闪与对流性天气系统中降水关系的分析.气象学报, 1999, 57(1):103-111. doi: 10.11676/qxxb1999.009 [13] Zipser E J.Deep cumulonimbus cloud systems in the tropics with and without lightning. Mon Wea Rev, 1994, 122:1837-1851. doi: 10.1175/1520-0493(1994)122<1837:DCCSIT>2.0.CO;2 [14] Takayabu Y N.Rain-yield per flash calculated from TRMM PR and LIS data and its relationship to the contribution of tall convective rain. Geophys Res Lett, 2006, 33:L18705. https://www.researchgate.net/publication/241062481_Rain-yield_per_flash_calculated_from_TRMM_PR_and_LIS_data_and_its_relationship_to_the_contribution_of_tall_convective_rain [15] Kenneth L C, Martin J M, Edward A B, et al.A combined TOA/MDF technology upgrade of the US National Lightning Detection Network. J Geophys Res, 1998, 103:9035-9044. doi: 10.1029/98JD00153 [16] 张义军, 孟青, 马明, 等.闪电探测技术发展和资料应用.应用气象学报, 2006, 17(5):611-620. doi: 10.11898/1001-7313.20060504 [17] Steiner M, Houze R A, Yuter S E.Climatological characterization of three-dimensional storm structure from operational radar and rain gauge data. J Applied Meteor, 1995, 34:1978-2007. doi: 10.1175/1520-0450(1995)034<1978:CCOTDS>2.0.CO;2 [18] 吴量, 冯桂力, 杨仲江, 等.雷达资料在雷电临近预警中的应用研究.成都信息工程学院学报, 2011, 26(6):672-673. http://cpfd.cnki.com.cn/Article/CPFDTOTAL-ZGQX201104001001.htm [19] 王飞, 张义军, 赵均壮, 等.雷达资料在孤立单体雷电预警中的初步应用.应用气象学报, 2008, 19(2):153-160. doi: 10.11898/1001-7313.20080228 [20] Straka J M, Zrnić D S, Ryzhkov A V.Bulk hydrometeor classification and quantification using polarimetric radar data:Synthesis of relations. J Appl Meteor, 2000, 39:1341-1372. doi: 10.1175/1520-0450(2000)039<1341:BHCAQU>2.0.CO;2 [21] 郑栋, 张义军, 吕伟涛, 等.大气不稳定度参数与闪电活动的预报.高原气象, 2005, 24(2):196-205. http://www.cnki.com.cn/Article/CJFDTOTAL-GYQX200502009.htm [22] 孙明生, 汪细明, 罗阳, 等.北京地区强对流天气展望预报方法研究.应用气象学报, 1996, 7(3):336-343. http://qikan.camscma.cn/jams/ch/reader/view_abstract.aspx?file_no=19960349&flag=1 [23] 郑栋, 孟青, 吕伟涛, 等.北京及其周边地区夏季地闪活动时空特征分析.应用气象学报, 2005, 16(5):638-644. doi: 10.11898/1001-7313.20050510 [24] Buechler D E, Wright P D, Goodman S J.Lightning/Rainfall Relationships during COHMEX.Preprints, 16th Conf on Severe Local Storms, Amer Meteor Soc, 1990:710-714. http://core.ac.uk/display/10425264 [25] Pessi A, Businger S, Cummins K L, et al.On the Relationship Between Lightning and Convective Rainfall over the Central Pacific Ocean.18th International Lightning Detection Conference, 2004. http://www.soest.hawaii.edu/met/Faculty/businger/personnel/pessi/ILDC2004_Pessi.pdf -


 设为首页
设为首页 加入收藏
加入收藏


 下载:
下载:

