
 设为首页
设为首页 加入收藏
加入收藏

Comparative Analysis of Maximum and Minimum Temperatures of LTS and ASPTS
-
摘要: 利用2009年8月—2010年7月的平行观测资料,对新型自动气象站中百叶箱和通风辐射罩气温观测系统气温日最值对比差的分布、粗差率、一致率以及平均值等进行统计,对日最值的出现时间进行对比,对日最值对比差与环境风速的关系进行分析,建立并验证了百叶箱气温日最值的订正方法。结果表明:百叶箱和通风辐射罩气温日最值对比差的分布均呈右偏态,且偏斜程度较大,不服从正态分布;日最高气温与最低气温的一致率分别为90.0%和81.5%,两者存在较大差异,但其粗差率基本一致,均略高于3.0%;与通风辐射罩气温观测系统相比,百叶箱的日最值数据总体偏高0.2℃左右,同时其出现时间也存在不同程度的滞后;气温日最值的差异会随着环境风速的增强而减小,特别是当风速大于4.5 m·s-1时,其差异可缩小到0.1℃以内;以环境风速为主要参数的气温订正方法将最高气温的差异缩小到0.03℃,一致率提高到95.2%,将最低气温的差异缩小到0.01℃,一致率提高到94.1%。Abstract: In order to meet demands of comprehensive weather observation in modern meteorological service, a development and assessment program of new automatic weather station (NAWS) is sponsored and launched by Meteorological Observation Center of China Meteorological Administration. Besides the traditional louver temperature observation system (LTS), NAWS can also be equipped with aspirated radiation shield temperature observation system (ASPTS), which borrows the design experience of US Climate Reference Network, for the purpose of achieving future long term homogeneous temperature observations. NAWS has been employed in the surface meteorological station in some provinces of China. Differences between LTS and ASPTS results, influencing factors and the correction method all need investigation, therefore, a parallel experimental measurements consists of LTS and ASPTS is conducted. The experiment is carried out in Nanjing University of Information Science & Technology (32°12′N, 118°42′E, elevation is 32 m) from August 2009 to July 2010. Maximum and minimum temperature measurements derived from LTS and ASPTS are compared, and biases of extreme values and difference of the occurrence times are examined under different regimes of ambience wind speeds. A correction model based on ambient wind speed is developed and checked. Results indicate that differences of daily extreme temperature between LTS and ASPTS are not subject to the normal distributions, while they demonstrate a right skewed state and a great degree of deflection. The concordance rate of maximum temperature between LTS and ASPTS is 90.0%, while that of minimum temperature is 81.5%. The gross error rate of maximum temperatures between LTS and ASPTS is almost the same as that of minimum temperature, both of which are about 3.0%. Compared with ASPTS measurements, the extreme values derived from LTS have a positive deviation of 0.2℃ and a lag of 2.5 minutes and 3.2 minutes for maximum temperature and minimum temperature, respectively. Differences of extreme values would be reduced with the enhancement of ambience wind speeds, even reduced to 0.1℃ when the speed is stronger than 4.5 m·s-1. The deviation correction, which is developed mainly based on wind speed, reduces the difference to 0.03℃ and 0.01℃, and increases the consistent rate to 95.2% and 94.1% for the maximum temperature and minimum temperature, respectively.
-
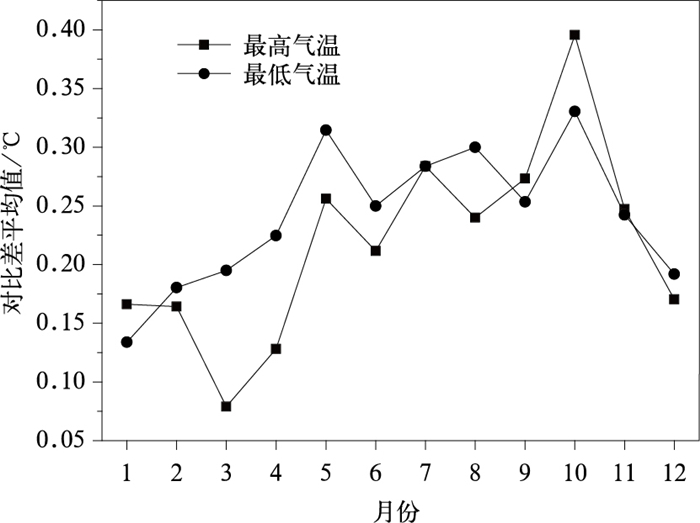
图 2 日最高气温与最低气温对比差平均值年变化
Fig. 2 Annual change of the monthly mean extreme temperature difference
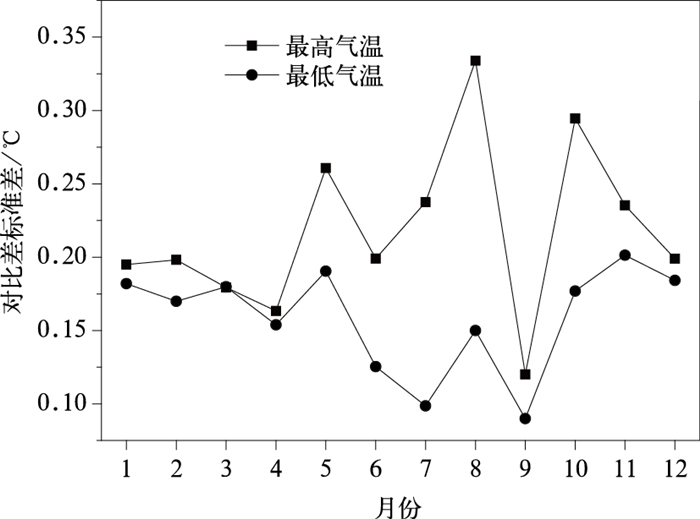
图 3 日最高气温与最低气温对比差标准差年变化
Fig. 3 Annual change of the monthly extreme temperature standard deviation average
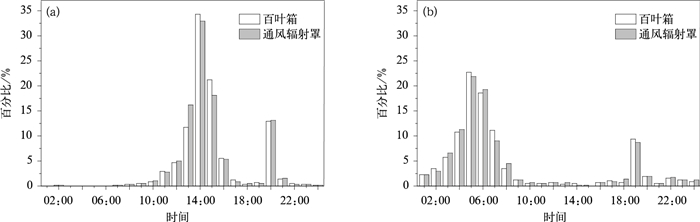
图 4 日最值在不同时次出现的概率分布 (a) 最高气温,(b) 最低气温
Fig. 4 Frequency distribution of the extreme temperature appearance time (a) maximum temperature, (b) minimum temperature
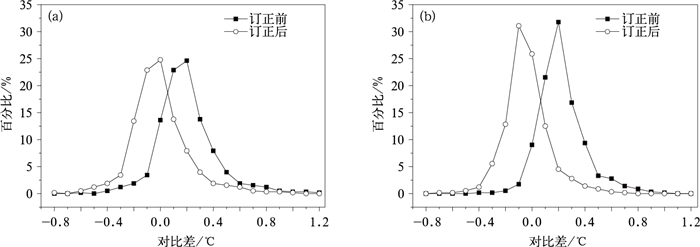
图 5 日最值数据订正前后对比 (a) 最高气温,(b) 最低气温
Fig. 5 Validation of deviation correction for maximum temperture (a) and minimum temperature (b)
表 1 日最值对比差分布特征量
Table 1 Distribution characteristics of the extreme temperature differences
统计量 对比差 最高气温 最低气温 偏度系数 0.8 0.9 峰度系数 2.7 2.1 偏度系数偏差 0.1 0.1 峰度系数偏差 0.3 0.3  下载: 导出CSV
表 2 日最值出现时间差异统计
Table 2 Statistics of extreme temperature appearance time
时间差统计区间/min 样本比例/% 最高气温 最低气温 (-∞,-60) 2.2 4.3 [-60, -30) 5.1 2.2 [-30, -10) 6.0 6.9 [-10, 0) 11.4 12.8 0 16.0 8.5 (0, 10] 32.4 40.4 (10, 30] 12.6 15.5 (30, 60] 7.2 4.3 (60,+∞) 7.1 5.2 注:时间差值大于零,表示百叶箱最值出现时间滞后;时间差值小于零,表示通风辐射罩气温观测系统最值出现的时间滞后。
下载: 导出CSV
表 3 环境风速对最值对比差的影响
Table 3 Variations of extreme temperature difference with ambient wind speed
风速范围/(m·s-1) 平均值/℃ 标准差/℃ 最高气温 最低气温 最高气温 最低气温 [0,1.5) 0.30 0.25 0.24 0.19 [1.5,3) 0.17 0.15 0.20 0.10 [3,4.5) 0.06 0.11 0.18 0.08 [4.5,+∞) 0.06 0.07 0.11 0.05
下载: 导出CSV
表 4 环境风速对最值出现时间的影响
Table 4 Variations of extreme temperature appearance time with ambient wind speed
风速范围/(m·s-1) 最值出现时间差小于平均值的样本比例/% 最高气温 最低气温 [0,1) 35.5 35.2 [1,2) 38.4 42.6 [2,3) 40.9 41.2 [3,4) 60.6 55.2 [4,+∞) 60.0 83.3
下载: 导出CSV
表 5 日最值差异订正系数
Table 5 Correction coefficients for the extreme temperature difference
订正参数 最高气温 最低气温 α 0.035 0.111 β 0.160 0.135 γ -0.119 -0.396
下载: 导出CSV
表 6 订正前后统计特征量
Table 6 Statistical features before and after correction
状态 订正对象 平均值/℃ 标准差/℃ 一致率/% 订正前 最高气温 0.20 0.22 90.0 最低气温 0.22 0.18 81.5 订正后 最高气温 0.03 0.22 95.2 最低气温 0.01 0.17 94.1
下载: 导出CSV
-
[1] 陈冬冬, 杨志彪, 施丽娟, 等.新型自动气象站结构特点及其优越性.气象水文海洋仪器, 2011(4):93-99. http://www.cnki.com.cn/Article/CJFDTOTAL-GSNY201421015.htm [2] Hubbard K G, Lin X, Baker C B.On the USCRN Temperature system.J Atmos Ocean Technol, 2005, 22(7):1095-1100. doi: 10.1175/JTECH1715.1 [3] Quayle R G, Easterling D R, Karl T R, et al. Effects of recent thermometer changes in the cooperative station network.Bull Amer Meteor Soc, 1991, 72(11):1718-1723. doi: 10.1175/1520-0477(1991)072<1718:EORTCI>2.0.CO;2 [4] Wendland W M, Armstrong W.Comparison of maximum-minimum resistance and liquid-in-glass thermometer records.J Atmos Ocean Technol, 1993, 10(2):233-237. doi: 10.1175/1520-0426(1993)010<0233:COMRAL>2.0.CO;2 [5] 刘小宁, 任芝花, 王颖.自动观测与人工观测地面温度的差异及其分析.应用气象学报, 2008, 15(5):554-563. doi: 10.11898/1001-7313.20080506 [6] 赵兵, 郑清华, 叶兴荣, 等.新旧南京国家基准气候站观测数据差异.气象科学, 2010, 30(4):559-563. http://www.cnki.com.cn/Article/CJFDTOTAL-QXKX201004023.htm [7] 陈豫英, 陈晓光, 张智, 等.宁夏自动站与人工观测气温的差异对比分析.应用气象学报, 2006, 17(增刊):118-124. http://www.cnki.com.cn/Article/CJFDTOTAL-YYQX2006S1016.htm [8] 王颖, 刘小宁, 鞠晓慧.自动观测与人工观测差异的初步分析.应用气象学报, 2007, 18(6):849-855. doi: 10.11898/1001-7313.200706128 [9] 任芝花, 余予, 邹凤玲, 等.部分地面要素历史基础气象资料质量检测.应用气象学报, 2012(6):739-747. doi: 10.11898/1001-7313.20120611 [10] 杨萍, 刘伟东, 仲跻芹, 等.北京地区自动气象站气温观测资料的质量评估.应用气象学报, 2011(6):706-715. doi: 10.11898/1001-7313.20110608 [11] 胡玉峰.自动与人工观测数据的差异.应用气象学报, 2004, 15(6):719-726. http://qikan.camscma.cn/jams/ch/reader/view_abstract.aspx?file_no=20040689&flag=1 [12] 王颖, 刘小宁.自动站与人工观测气温的对比分析.应用气象学报, 2002, 13(6):741-748. http://qikan.camscma.cn/jams/ch/reader/view_abstract.aspx?file_no=20020697&flag=1 [13] 任芝花, 涂满红, 陈永清, 等.玻璃钢百叶箱与木制百叶箱内温湿度测量的对比分析.气象, 2006, 32(5):35-40. doi: 10.7519/j.issn.1000-0526.2006.05.006 [14] 王立, 冯海霞, 胡宪林, 等.自动气象站与人工观测数据差异的原因分析.成都信息工程学院学报, 2006, 21(4):567-570. http://www.cnki.com.cn/Article/CJFDTOTAL-KEJI201314125.htm [15] 连志鸾.自动站与人工站观测记录的差异分析.气象, 2005, 31(3):48-52. doi: 10.7519/j.issn.1000-0526.2005.03.011 [16] Sun B, Baker C B, Karl T R, et al.A comparative study of ASOS and USCRN temperature measurements.J Atmos Ocean Technol, 2005, 22(6):679-686. doi: 10.1175/JTECH1752.1 [17] Hubbard K G, Lin X, Walter-Shea E A.The effectiveness of the ASOS, MMTS, Gill, and CRS air temperature radiation shields.J Atmos Ocean Technol, 2001, 18(6):851-864. https://www.researchgate.net/profile/Kenneth_Hubbard/publication/249604644_The_effectiveness_of_the_ASOS_MMTS_Gill_and_CRS_air_temperature_radiation_shields/links/5436b3ae0cf2bf1f1f2cff14.pdf [18] Hubbard K G, Lin X, Baker C B, et al.Air temperature comparison between the MMTS and the USCRN temperature systems.J Atmos Ocean Technol, 2004, 21(10):1590-1597. https://www.researchgate.net/publication/252980478_Air_Temperature_Comparison_between_the_MMTS_and_the_USCRN_Temperature_Systems [19] 中国气象局. 第二代自动气象站功能规格书. 2010. [20] 中国气象局.地面气象观测规范.北京:气象出版社, 2003. [21] 温华洋, 徐光清, 张虎, 等.双套自动气象站数据评估及其优势探讨.应用气象学报, 2012(6):748-754. http://qikan.camscma.cn/jams/ch/reader/view_abstract.aspx?file_no=20120612&flag=1 [22] 国家气象信息中心. 对比观测期间监测资料评估技术方法. 2003. [23] Hubbard K G, Lin X.Realtime data filtering models for air temperature measurements.Geophys Res Lett, 2002, 29(10):61-67. doi: 10.1029/2001GL014161 [24] 黄嘉佑.气象统计分析与预报方法.北京:气象出版社, 2004. [25] Lopardo G, Bertiglia F, Curci S, et al.Comparative analysis of the influence of solar radiation screen ageing on temperature measurements by means of weather stations.International Journal of Climatology, 2013, doi: 10.1002/joc.3765. [26] Lin X, Hubbard K G, Meyer G E.Airflow characteristics of commonly used temperature radiation shields.J Atmos Ocean Technol, 2001, 18(3):329-339. doi: 10.1175/1520-0426(2001)018<0329:ACOCUT>2.0.CO;2 [27] Fritschen L J, Gay L W.Environmental Instrumentation.New York:Springer-Verlag, 1979:216. -

计量
- 摘要浏览量: 3479
- HTML全文浏览量: 1031
- PDF下载量: 1204
- 被引次数: 0
