Evaluation of ASCAT Coastal Wind Product Using Nearshore Buoy Data
-
摘要: 利用美国西海岸7个近岸浮标2012年全年和中国近岸8个气象浮标2012年1—6月的风场观测数据,检验了卫星散射计ASCAT近岸风场产品中的风速和风向在近岸海域的精度。检验结果表明:在美国西海岸近岸海域,ASCAT近岸风场产品中的风速与浮标的风速一致性高,但ASCAT近岸风场产品中风向的精度受离岸距离、风速和风向等因素的影响,在离岸近的海域ASCAT近岸风场产品与浮标观测风场的一致性较差。统计发现,将低风速 (不超过3 m·s-1) 剔除可明显提高ASCAT近岸风场产品在近岸海域的精度。另外,ASCAT近岸风场产品的风向精度在不同风向上存在差异,表现为从陆地吹向海洋风向精度较小,而从海洋吹向陆地风向精度较高。在中国近岸海域,受地形影响,渤海海域ASCAT近岸风场产品与气象浮标观测的风向差异大,在其他近岸海域的ASCAT近岸风场产品和气象浮标的观测风场的对比结果与美国西海岸风场的对比结果特征相似。Abstract:
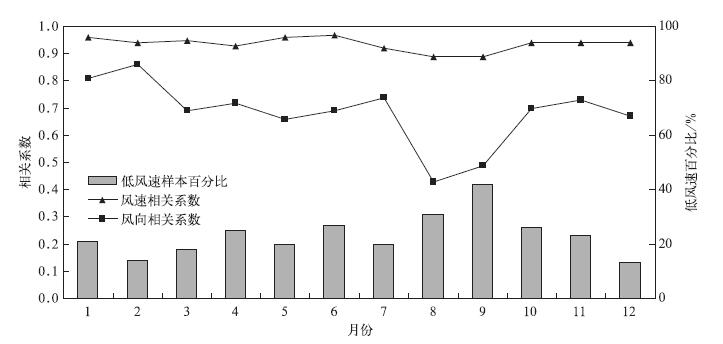
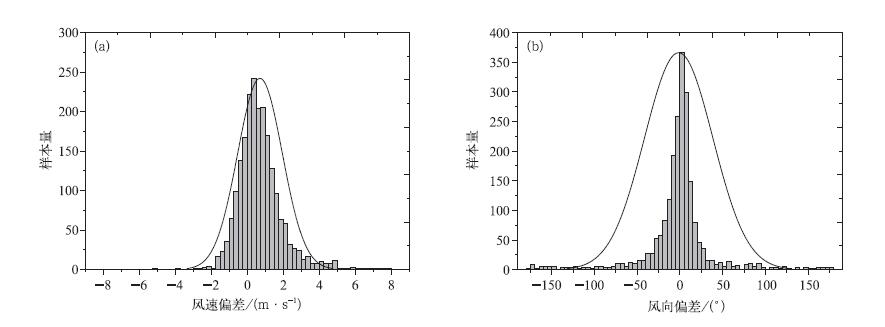
The new scatterometer advanced scatterometer (ASCAT) on board MetOp-A satellite provides surface wind speed and direction over global ocean. Providing accurate nearshore wind data from satellites is challenging because satellite data are unavailable very close to shore due to the contaminating effect of the land. Besides, land-sea breezes and shore topography produce small space scale and time-scale wind variations that can be smoothed by the satellite's space averaging and aliased by the satellite's twice-a-day sampling. The complexity of nearshore winds is one of the prime causes that the regions are so important. For example, over one-third of the total marine fish catch occurs within nearshore zone.The accuracy of ASCAT coastal wind product is determined through various comparisons with buoys. The nearshore buoys used in the comparisons locate in US West Coast and China Coast. As the time interval of US West Coast buoy wind is 10-minute interval and the spatial resolution of ASCAT wind product is 12.5 km, a scatterometer wind and a buoy wind measurement are considered to be collocated if the distance between the wind vector cell center and the buoy location is less than 12.5 km and if the acquisition time difference is less than 5 minutes in US West Coast. As the time interval of China Coast buoy wind is 1 hour, the acquisition time difference is less than 30 minutes in China Coast. The buoy winds at a given anemometer height are converted to 10 m neutral winds in order to enable a good comparison with the 10 m scatteromter winds. The time ranges of wind data used for comparison from US West Coast buoys and China Coast buoys are the whole year of 2012 and the first half year of 2012 individually.It shows that the accuracy of the wind speed of ASCAT product is high and the accuracy of the wind direction of ASCAT product is influenced by several factors, such as the distance from coast, wind speed and wind direction. The overall wind speed correlation coefficient between buoy data and ASCAT product is 0.94, and wind speed correlation coefficients between each buoy and ASCAT product are all above 0.9. The overall wind direction correlation coefficient between buoy and ASCAT product is 0.71, and the wind direction correlation coefficient between the nearest buoy and ASCAT product is only 0.55. Processing the satellite data by discarding observations recorded in light winds (below 3 m·s-1) can improve the accuracy of the ASCAT wind products by reducing the mean bias of wind direction from 21.89°to 11.83°, and the wind direction correlation coefficient increased from 0.71 to 0.84. In addition, the accuracy of the wind flow from land is low, while the accuracy of the wind flow from sea is higher. In most China nearshore regions, the applicability of ASCAT coastal wind product is good, but in Bohai Sea, the effect of topography on ASCAT coastal wind product is apparent.
-
Key words:
- coastal area;
- ASCAT;
- buoys
-
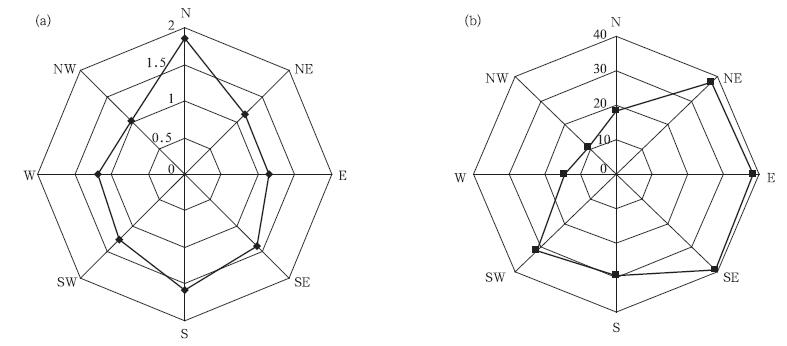
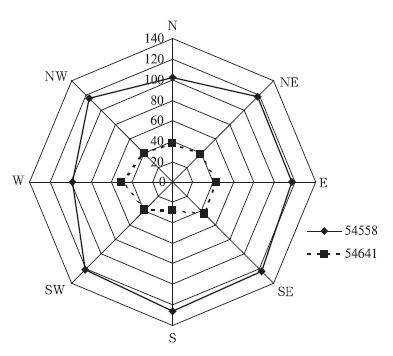
图 5 ASCAT近岸风场与美国西海岸近岸浮标风速和风向均方根误差风玫瑰图
(a) 风速均方根误差 (单位:m·s-1), (b) 风向均方根误差 (单位:(°))
Fig. 5 Wind rose diagram of root mean square error between ASCAT coastal wind products and US West Coastal buoy observations
(a) wind speed root mean square error (unit:m·s-1), (b) wind direction root mean square error (unit:(°))
表 1 NDBC浮标信息列表
Table 1 Information list of the NDBC buoys
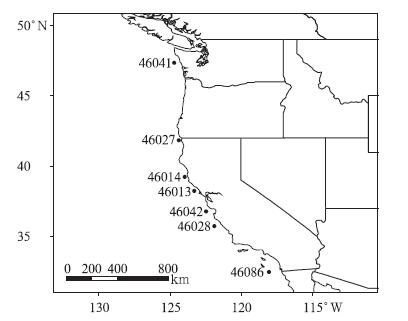
浮标号 纬度 经度 测风高度/m 离岸距离/km 46013 38.242°N 123.301°W 5 22 46014 39.235°N 123.974°W 5 17 46027 41.850°N 124.381°W 5 13 46028 35.741°N 121.884°W 5 41 46041 47.349°N 124.708°W 5 34 46042 36.785°N 122.469°W 5 35 46086 32.491°N 118.034°W 5 85 表 2 中国近岸浮标信息列表
Table 2 Information list of China nearshore buoys
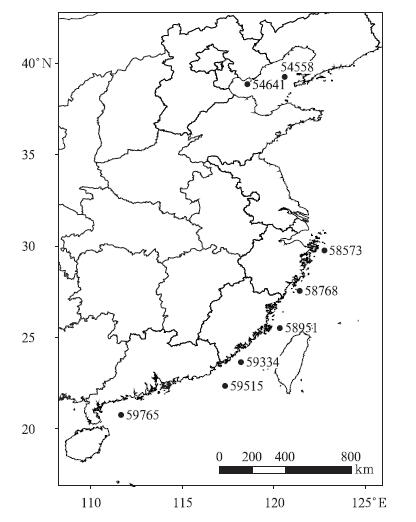
浮标号 纬度 经度 测风高度/m 离岸距离/km 54558 39.25°N 120.58°E 10 57 54641 38.85°N 118.55°E 10 8 58573 29.75°N 122.75°E 10 34 58768 27.53°N 121.40°E 10 39 58951 25.50°N 120.32°E 10 45 59334 23.64°N 118.20°E 10 54 59515 22.33°N 117.34°E 10 110 59765 20.75°N 111.66°E 10 85 表 3 ASCAT近岸风场与美国西海岸近岸浮标对比
Table 3 Comparison between ASCAT coastal wind products and US West Coastal buoy wind observations
浮标号 匹配样本量 风速平均偏差/(m·s-1) 风向平均偏差/(°) 风速相关系数 风向相关系数 46013 298 0.82 22.69 0.97 0.78 46014 282 1.59 25.11 0.93 0.57 46027 178 2.14 31.72 0.90 0.55 46028 349 0.77 15.02 0.97 0.87 46041 334 0.92 25.70 0.96 0.67 46042 328 0.74 16.52 0.96 0.78 46086 354 0.68 21.86 0.94 0.74 表 4 根据风速等级划分的ASCAT近岸风场和美国西海岸近岸浮标观测风场对比
Table 4 Comparison between ASCAT coastal wind products and US West Coastal buoy wind observations according to wind speed
类型 样本量 风速平均偏差/(m·s-1) 风向平均偏差/(°) 风速相关系数 风向相关系数 全部样本 2123 1.0 21.89 0.94 0.71 风速不大于3 m·s-1 548 1.15 50.8 0.26 0.39 风速大于3 m·s-1 1575 0.96 11.83 0.94 0.84 表 5 ASCAT近岸风场与中国近岸浮标对比
Table 5 Comparison between ASCAT coastal wind products and China nearshore buoy wind observations
浮标号 样本量 风速平均偏差/(m·s-1) 风向平均偏差/(°) 风速相关系数 风向相关系数 54558 204 1.33 136.10 0.94 0.06 54641 141 8.37 53.63 0.42 0.55 58573 274 2.48 36.27 0.87 0.77 58768 196 1.12 30.18 0.96 0.95 58951 173 1.27 38.04 0.97 0.78 59334 124 1.60 40.86 0.96 0.83 59515 137 1.15 26.92 0.98 0.93 59765 160 1.06 29.64 0.96 0.92 表 6 根据风速等级划分的ASCAT近岸风场和中国近岸浮标对比
Table 6 Comparison result between ASCAT coastal wind products and China nearshore buoy wind observations according to wind speed
分类 样本量 风速平均偏差/(m·s-1) 风向平均偏差/(°) 风速相关系数 风向相关系数 全部样本 1409 1.70 32.73 0.92 0.63 风速不大于3 m·s-1 253 2.00 65.80 0.30 0.40 风速大于3 m·s-1 1156 1.55 18.20 0.93 0.73 -
[1] Naderi F, Freilich M, Long D.Spaceborne radar measurement of wind velocity over the ocean—An overview of the NSCAT scatterometer system.Proceedings of the IEEE, 1991, 79(6):850-866. doi: 10.1109/5.90163 [2] 刘宇迪, 任景鹏, 周鑫.散射计风场的三维变分对海雾数值模拟的影响.应用气象学报, 2011, 22(4):472-481. doi: 10.11898/1001-7313.20110410 [3] Milliff R F, Large W G, Morzel J, et al.Ocean general circulation model sensitivity to forcing from scatterometer winds.J Geophys Res, 1999, 104(C5):11337-11358. doi: 10.1029/1998JC900045 [4] Liu W T.Progress in scatterometer application.Journal of Oceanography, 2002, 58(1):121-136. doi: 10.1023/A:1015832919110 [5] Chelton D B, Freilich M H, Sienkiewicz J M, et al.On the use of QuikSCAT scatterometer measurements of surface winds for marine weather prediction.Mon Wea Rev, 2006, 134(8):2055-2071. doi: 10.1175/MWR3179.1 [6] 窦芳丽, 卢乃锰, 谷松岩.星载双频风场雷达热带气旋降雨区测风模拟.应用气象学报, 2012, 23(4):467-477. doi: 10.11898/1001-7313.20120410 [7] Chelton D B, Schlax M G, Freilich M H, et al.Satellite measurements reveal persistent small-scale features in ocean winds.Science, 2004, 303(5660):978-983. doi: 10.1126/science.1091901 [8] 刘春霞, 何溪澄.QuikSCAT散射计矢量风统计特征及南海大风遥感分析.热带气象学报, 2003, 19(增刊Ⅰ):107-117. http://www.cnki.com.cn/Article/CJFDTOTAL-RDQX2003S1011.htm [9] Bentamy A, Croize-Fillon D, Perigaud C.Characterization of ASCAT measurements based on buoy and QuikSCAT wind vector observations.Ocean Science, 2008, 4(4):265-274. doi: 10.5194/os-4-265-2008 [10] Figa-Saldana J, Wilson J J W, Attema E, et al.The advanced scatterometer (ASCAT) on the meteorological operational (MetOp) platform:A follow on for European wind scatterometers.Canadian Journal of Remote Sensing, 2002, 28(3):404-412. doi: 10.5589/m02-035 [11] Verspeek J, Stoffelen A, Portabella M, et al.Validation and Calibration of ASCAT Using CMOD5.n.IEEE Transactions on Geoscience and Remote Sensing, 2010, 48(1):386-395. doi: 10.1109/TGRS.2009.2027896 [12] 张春桂, 蔡义勇, 张加春.MODIS遥感数据在我国台湾海峡海雾监测中的应用.应用气象学报, 2009, 20(1):8-16. doi: 10.11898/1001-7313.20090102 [13] 张春桂, 曾银东, 张星, 等.海洋叶绿素a浓度反演及其在赤潮监测中的应用.应用气象学报, 2007, 18(6):821-831. doi: 10.11898/1001-7313.200706124 [14] 张晓虎.卫星监测台风信息处理系统.应用气象学报, 2003, 14(4):505-509. http://qikan.camscma.cn/jams/ch/reader/view_abstract.aspx?file_no=20030464&flag=1 [15] 方宗义, 刘玉洁.卫星云参数处理方法和1991年云气候特征分析.应用气象学报, 1994, 5(2):135-142. http://qikan.camscma.cn/jams/ch/reader/view_abstract.aspx?file_no=19940227&flag=1 [16] FAO.Yearbook of Fisheries Statistics:Catches and Landings.Rome:Food and Agriculture Organization of the United Nations, 1995:713. [17] Halliwell G R, Allen J S.The large-scale coastal wind field along the west coast of North America, 1981-1982.J Geophys Res, 1987, 92(C2):1861-1884. doi: 10.1029/JC092iC02p01861 [18] Dorman C E, Winant C D.Buoy observations of the atmosphere along the west coast of the United States, 1981-1990.Journal of Geophysical Research:Oceans (1978-2012), 1995, 100(C8):16029-16044. doi: 10.1029/95JC00964 [19] Center N D B.Handbook of Automated Data Quality Control Checks and Procedures.Mississippi:NOAA, 2009:9-10. [20] 黄飞龙, 吕雪芹, 陈刚.海洋气象探测基地-浮标.海洋技术, 2012, 30(4):46-49. http://www.cnki.com.cn/Article/CJFDTOTAL-HYJS201104012.htm [21] OSI SAF.ASCAT Wind Product User Manual Version 1.11.2012 :3-7. [22] 徐天真, 徐静琦, 楼顺里.海面风垂直分布的计算方法.海洋湖沼通报, 1988(4):1-6. http://www.cnki.com.cn/Article/CJFDTOTAL-HYFB198804000.htm [23] 陈永利, 赵永平, 张必成, 等.海上不同高度风速换算关系的研究.海洋科学, 1989(3):27-31. http://www.cnki.com.cn/Article/CJFDTOTAL-HYKX198903004.htm [24] Atlas R, Busalacchi A, Ghil M, et al.Global surface wind and flux fields from model assimilation of Seasat data.J Geophys Res, 1987, 92(C6):6477-6487. doi: 10.1029/JC092iC06p06477 [25] Portabella M, Stoffelen A.Scatterometer backscatter uncertainty due to wind variability.IEEE Transactions on Geoscience and Remote Sensing, 2006, 44(11):3356-3362. doi: 10.1109/TGRS.2006.877952 -


 设为首页
设为首页 加入收藏
加入收藏


 下载:
下载:
