Comparison of the Number of Thunderstorm Days from Lightning Location System and Artificial Observations
-
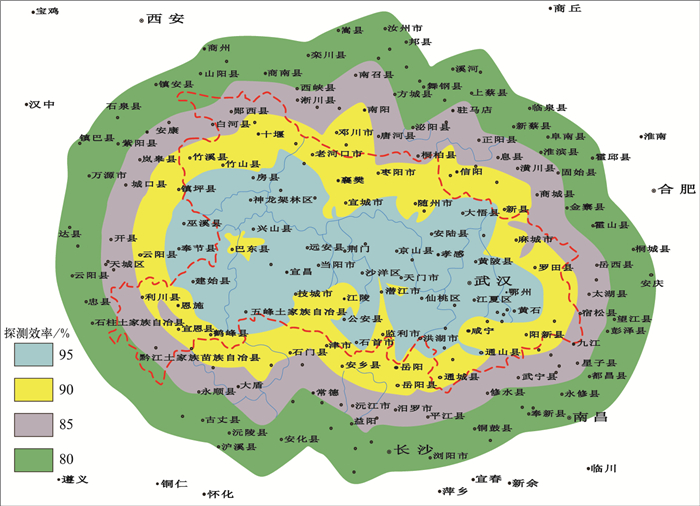
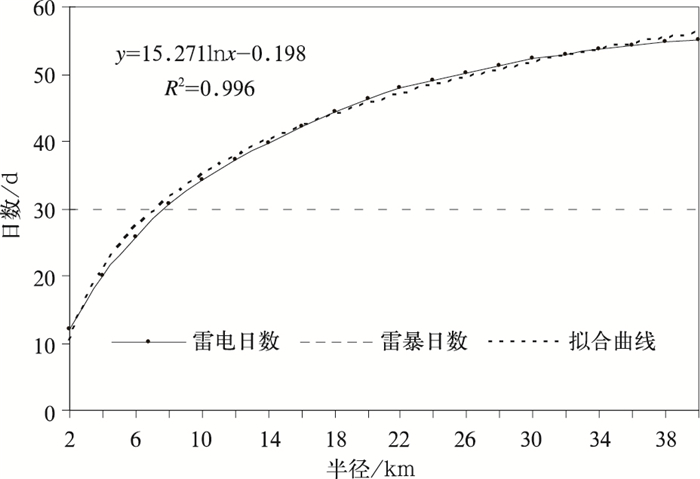
摘要: 为了利用雷电定位系统 (lightning location system,LLS) 资料统计人工观测雷暴日数,采用湖北省2007—2012年LLS监测资料,选取25个气象站为圆心,统计其不同监测半径 (r) 圆区域内LLS监测的雷电日数,并与人工观测雷暴日数进行比较。结果表明:r≤7 km时,LLS监测平均年雷电日数小于人工观测平均年雷暴日数;r≥8 km时, LLS监测平均年雷电日数大于人工观测平均年雷暴日数;r=22 km圆区域内年平均雷电日数可替代最大年雷暴日数。根据r=7 km,r=8 km圆区域内LLS监测的年雷电日数、年平均地闪密度资料,分别采用直接替代法、地闪密度法和该文提出的二元法计算年雷暴日数,结果显示:二元法效果最好。二元法计算的2007—2012年25个站平均年雷暴日数与人工观测相等,平均差异为7.4%;二元法计算的2013年年雷暴日数与人工观测相差0.8 d,平均差异为12.3%。Abstract: Using the lightning location system (LLS) monitoring data of Hubei Province from 2007 to 2012 and 1983-2012 artificial observations, 25 meteorological stations with theoretical detection efficiency above 95% are selected to make a relative analysis on the number of thunderstorm days monitored by LLS with different monitoring radius (r) and artificial observations. Results show that annual mean thunderstorm days of artificial observations and LLS monitoring data agree mostly in the radius which range from 6.4 km to 10.2 km. In the circular area when r=7, 8, 9 km, the difference is minimum, with the average difference of about 19%. When r≤7 km, the annual mean thunderstorm days from LLS monitoring data is less than that of artificial observation, while it is more than artificial observation when r≥8 km, and it can replace the number of maximum annual mean thunderstorm days of artificial observations when r=22 km. The ground flash density do not change significantly with the monitoring radius in the range of 2-40 km, the annual mean flash density is 3.9-4.1 times/(km2 ·a) and the average value is 4 times/(km2 ·a) for each monitoring radius. According to data of LLS, 3 methods are suggested to calculate the number of annual mean thunderstorm days of artificial observations. The first method is using the number of annual mean thunderstorm days of LLS monitoring data when r=7 km to represent the artificial observations directly, called direct substitution method. The second method is to calculate the number of annual mean thunderstorm days of artificial observations by the equation with one unknown quantity on the basis of the annual mean flash density data when r=8 km, called ground flash density method. The third method is using the binary equation to calculate the number of annual mean thunderstorm days of artificial observations on the basis of the number of annual mean thunderstorm days and the annual mean flash density data when r=8 km, called binary method. The examination shows that the binary method is the best, followed by the ground flash density method and the direct substitution method. The number of annual mean thunderstorm days of 25 stations calculated by binary method from 2007 to 2012 are equal to that of artificial observations, and the average difference is 7.4%. In 2013, the gap of the number of annual mean thunderstorm days between binary method and artificial observation is 0.8 d, and the average difference is 12.3%.
-
表 1 半径r分布
Table 1 r of sample data
r/km 频数/站 3~4 2 5~6 8 7~8 4 9~10 4 11~12 3 13~14 3 15 1 表 2 25个站雷电日数与雷暴日数对比
Table 2 Comparison of the number of lightning days and the number of thunderstorm days at 25 stations
站名 Td/d Tl/Td r=6 km r=7 km r=8 km r=9 km r=10 km 安陆 27.0 0.543 0.599 0.673 0.747 0.815 房县 20.3 0.836 0.918 0.984 1.066 1.131 黄石 39.3 0.983 1.072 1.119 1.140 1.174 云梦 22.5 0.756 0.852 0.941 1.030 1.059 保康 26.2 0.605 0.688 0.777 0.809 0.885 孝感 28.2 0.651 0.769 0.822 0.876 0.923 蔡甸 26.8 0.994 1.099 1.205 1.298 1.404 新洲 29.0 0.920 0.994 1.098 1.167 1.207 长阳 35.5 0.751 0.850 0.944 1.023 1.094 广水 25.5 0.641 0.699 0.732 0.804 0.837 建始 34.7 0.793 0.938 1.077 1.178 1.284 蒲圻 37.8 1.300 1.366 1.419 1.471 1.511 汉川 23.0 0.913 1.022 1.087 1.167 1.217 江夏 31.3 1.106 1.213 1.309 1.367 1.441 五峰 32.0 1.167 1.281 1.422 1.516 1.599 大悟 26.0 0.590 0.647 0.705 0.724 0.788 宜昌 39.0 1.047 1.085 1.132 1.145 1.175 钟祥 26.0 0.679 0.750 0.795 0.846 0.885 洪湖 27.5 1.103 1.139 1.170 1.200 1.242 神农架 25.2 0.974 1.079 1.159 1.219 1.291 当阳 29.0 0.661 0.747 0.810 0.908 1.011 黄陂 29.7 0.730 0.837 0.916 1.022 1.090 应城 26.5 0.541 0.660 0.736 0.855 0.937 鄂州 38.3 1.030 1.104 1.204 1.265 1.330 黄冈 32.7 1.097 1.163 1.209 1.224 1.281 平均 29.6 0.856 0.943 1.018 1.083 1.145 表 3 不同监测半径平均年雷电日数与最大年雷暴日数对比
Table 3 Comparison of the number of annual mean lightning days and the number of average maximum annual thunderstorm days for different monitoring radius
监测半径/km Tl/d Tdmax/d Tl与Tdmax差值/d r=18 44.3 47.7 -3.4 r=20 46.3 47.7 -1.4 r=22 47.8 47.7 0.1 r=24 49.1 47.7 1.4 r=26 50.2 47.7 2.5 表 4 不同监测半径平均年雷电日数与平均年雷暴日数对比
Table 4 Comparison of the number of annual mean lightning days and the number of annual mean thunderstorm days for different monitoring radius
监测半径/km Tl/d Td/d Tl与Td平均差值/d Tl与Td平均比值 Tl与Td相关系数 Ng与Td相关系数 r=7 28.4 29.6 -1.2 0.943 0.8379 0.6442 r=8 30.6 29.6 1.0 0.018 0.8450 0.6633 r=9 32.5 29.6 2.9 1.083 0.8432 0.6519 表 5 2007—2012年25个站Td与Tl,Td1,Td2对比检验
Table 5 Comparison and verification of Td and Tl, Td1, Td2 from 2007 to 2012 at 25 stations
站名 Td/d Tl/d Td1/d Td2/d Tl/Td Td1/Td Td2/Td E1/% E2/% E3/% 安陆 27.0 16.2 27.1 24.1 0.599 1.003 0.893 40.1 0.3 10.7 房县 20.3 18.7 26.6 24.5 0.918 1.307 1.205 8.2 30.7 20.5 黄石 39.3 42.2 37.6 37.9 1.072 0.956 0.963 7.2 4.4 3.7 云梦 22.5 19.2 28.2 25.7 0.852 1.254 1.141 14.8 25.4 14.1 保康 26.2 18.0 27.6 25.1 0.688 1.054 0.958 31.2 5.4 4.2 孝感 28.2 21.7 28.7 26.6 0.769 1.018 0.943 23.1 1.8 5.7 蔡甸 26.8 29.5 29.2 30.0 1.099 1.089 1.117 9.9 8.9 11.7 新洲 29.0 28.8 31.2 30.7 0.994 1.074 1.059 0.6 7.4 5.9 长阳 35.5 30.2 32.2 31.8 0.850 0.908 0.895 15.0 9.2 10.5 广水 25.5 17.8 28.3 24.8 0.699 1.109 0.974 30.1 10.9 2.6 建始 34.7 32.5 23.9 29.2 0.938 0.689 0.843 6.2 31.1 15.7 蒲圻 37.8 51.7 32.3 38.7 1.366 0.853 1.024 36.6 14.7 2.4 汉川 23.0 23.5 28.3 27.0 1.022 1.229 1.174 2.2 22.9 17.4 江夏 31.3 38.0 31.6 34.1 1.213 1.010 1.088 21.3 1.0 8.8 五峰 32.0 41.0 25.0 32.6 1.281 0.783 1.018 28.1 21.7 1.8 大悟 26.0 16.8 27.0 24.1 0.647 1.040 0.929 35.3 4.0 7.1 宜昌 39.0 42.3 34.9 36.7 1.085 0.894 0.940 8.5 10.6 6.0 钟祥 26.0 19.5 27.8 25.3 0.750 1.068 0.972 25.0 6.8 2.8 洪湖 27.5 31.3 27.9 29.3 1.139 1.014 1.065 13.9 1.4 6.5 神农架 25.2 27.2 23.9 26.4 1.079 0.948 1.049 7.9 5.2 4.9 当阳 29.0 21.7 32.2 28.3 0.747 1.109 0.976 25.3 10.9 2.4 黄陂 29.7 24.8 29.7 28.4 0.837 1.001 0.958 16.3 0.1 4.2 应城 26.5 17.5 28.1 25.1 0.660 1.062 0.945 34.0 6.2 5.5 鄂州 38.3 42.3 34.5 37.2 1.104 0.900 0.970 10.4 10.0 3.0 黄冈 32.7 38.0 35.4 35.3 1.163 1.083 1.081 16.3 8.3 8.1 平均 29.6 28.4 29.6 29.6 0.943 1.018 1.007 18.7 10.4 7.4 表 6 2013年25个站Td与Tl,Td1,Td2对比检验
Table 6 Comparison and verification of Td and Tl, Td1, Td2 from 2007 to 2013 at 25 stations
站名 Td/d Tl/d Td1/d Td2/d Tl/Td Td1/Td Td2/Td E1/% E2/% E3/% 安陆 27 15 23.2 21.6 0.556 0.860 0.799 44.4 14.0 20.1 房县 31 32 33.5 32.6 1.032 1.082 1.050 3.2 8.2 5.0 黄石 29 33 28.8 31.4 1.138 0.994 1.083 13.8 0.6 8.3 云梦 21 18 26.0 24.3 0.857 1.240 1.155 14.3 24.0 15.5 保康 38 26 27.4 28.3 0.684 0.721 0.746 31.6 27.9 25.4 孝感 30 18 28.3 27.4 0.600 0.945 0.913 40.0 5.5 8.7 蔡甸 33 34 24.9 29.5 1.030 0.753 0.895 3.0 24.7 10.5 新洲 33 27 28.3 29.1 0.818 0.858 0.882 18.2 14.2 11.8 长阳 42 41 27.7 32.6 0.976 0.658 0.775 2.4 34.2 22.5 广水 25 19 24.7 24.3 0.760 0.987 0.972 24.0 1.3 2.8 建始 31 39 23.6 32.4 1.258 0.763 1.046 25.8 23.7 4.6 蒲圻 41 58 29.8 39.1 1.415 0.726 0.953 41.5 27.4 4.7 汉川 27 26 30.4 29.0 0.963 1.125 1.075 3.7 12.5 7.5 江夏 26 43 29.3 34.7 1.654 1.126 1.335 65.4 12.6 33.5 五峰 39 47 24.9 34.4 1.205 0.639 0.882 20.5 36.1 11.8 大悟 20 16 25.2 22.5 0.800 1.258 1.124 20.0 25.8 12.4 宜昌 45 43 34.8 36.2 0.956 0.773 0.805 4.4 22.7 19.5 钟祥 24 28 28.5 29.5 1.167 1.187 1.230 16.7 18.7 23.0 洪湖 31 31 26.5 30.0 1.000 0.854 0.967 0.0 14.6 3.3 神农架 31 37 26.9 31.2 1.194 0.867 1.006 19.4 13.3 0.6 当阳 26 29 29.6 29.0 1.115 1.138 1.115 11.5 13.8 11.5 黄陂 29 25 31.8 29.3 0.862 1.096 1.011 13.8 9.6 1.1 应城 30 20 25.0 23.7 0.667 0.832 0.792 33.3 16.8 20.8 鄂州 30 37 30.5 33.2 1.233 1.016 1.107 23.3 1.6 10.7 黄冈 31 42 31.5 34.4 1.355 1.016 1.108 35.5 1.6 10.8 平均 30.8 31.4 28.0 30.0 1.012 0.941 0.993 21.2 16.2 12.3 -
[1] 冯桂力, 陈文选, 刘诗军, 等.山东地区闪电的特征分析.应用气象学报, 2002, 13(3):347-355. http://qikan.camscma.cn/jams/ch/reader/view_abstract.aspx?file_no=20020345&flag=1 [2] 许小峰.国家雷电监测网的建设与技术分析.中国工程科学, 2002, 4(5):7-13. http://www.cnki.com.cn/Article/CJFDTOTAL-GCKX200205001.htm [3] 马明, 吕伟涛, 张义军, 等.1997—2006年我国雷电灾情特征.应用气象学报, 2008, 19(4):393-400. doi: 10.11898/1001-7313.20080402 [4] 陈家宏, 张勤, 冯万兴, 等.中国电网雷电定位系统与雷电监测网.高电压技术, 2008, 34(3):425-431. http://www.cnki.com.cn/Article/CJFDTOTAL-GDYJ200803002.htm [5] 高燚, 张义军, 张文娟, 等.我国雷击致人伤亡特征及易损度评估区划.应用气象学报, 2012, 23(3):294-303. http://qikan.camscma.cn/jams/ch/reader/view_abstract.aspx?file_no=20120305&flag=1 [6] 张义军, 周秀骥.雷电研究的回顾和进展.应用气象学报, 2006, 17(6):829-834. doi: 10.11898/1001-7313.20060619 [7] 林维勇, 黄友根, 焦兴学, 等.GB50057—2010建筑物防雷设计规范.北京:中国计划出版社, 2011:8-59. [8] 余海军, 陈水明, 朱建军, 等.雷电定位系统监测雷电日与人工记录雷电日的比较.高电压技术, 2012, 38(10):2742-2748. http://www.cnki.com.cn/Article/CJFDTOTAL-GDYJ201210037.htm [9] 蒙伟光, 易燕明, 杨兆礼, 等.广州地区雷暴过程云-地闪特征及其环境条件.应用气象学报, 2008, 19(5):611-619. doi: 10.11898/1001-7313.20080513 [10] 张义军, 孟青, 马明, 等.闪电监测技术发展和资料应用.应用气象学报, 2006, 17(5):611-620. doi: 10.11898/1001-7313.20060504 [11] 童雪芳, 王海涛, 陈家宏, 等.雷电定位系统地闪密度分布图与雷击故障相关性分析.高电压技术, 2009, 34(12):2924-2929. http://www.cnki.com.cn/Article/CJFDTOTAL-GDYJ200912008.htm [12] 秦建峰, 刘梦雨, 吴昊.ADTD雷电探测系统典型故障分析.气象科技, 2012, 40(2):180-184. http://www.cnki.com.cn/Article/CJFDTOTAL-QXKJ201202008.htm [13] 陈家宏, 冯万兴, 王海涛, 等.雷电参数统计方法.高电压技术, 2007, 33(10):6-10. doi: 10.3969/j.issn.1003-6520.2007.10.002 [14] 尹丽云, 许迎杰, 张腾飞, 等.一种新的雷电日及雷电参数统计方法.气象科技, 2009, 37(6):739-743. http://www.cnki.com.cn/Article/CJFDTOTAL-QXKJ200906020.htm [15] 李家启, 汪志辉, 任艳, 等.闪电定位系统与人工观测雷电日参数对比分析.气象科技, 2012, 40(1):132-136. http://www.cnki.com.cn/Article/CJFDTOTAL-QXKJ201201025.htm [16] 田芳, 肖稳安, 冯民学, 等.闪电定位观测结果的修订分析.华东电力, 2008, 36(6):38-42. http://www.cnki.com.cn/Article/CJFDTOTAL-HDDL200806010.htm [17] 中国科学院空间科学与应用研究中心. ADTD雷电探测仪用户手册. 北京: 中国科学院, 2004. [18] 中国气象局.地面气象观测规范.北京:气象出版社, 2011:3-111. [19] 丁士晟.多元分析方法及其应用.长春:吉林人民出版社, 1981:88-177. [20] 马开玉, 张耀存, 陈星.现代应用统计学.北京:气象出版社, 2004:57-131. [21] 张志富.国外气候资料整编方法介绍——以美国、加拿大为例.干旱气象, 2009, 27(4):395-401. http://www.cnki.com.cn/Article/CJFDTOTAL-GSQX200904019.htm [22] 钟颖颖, 冯民学, 周金奎, 等.闪电定位资料与目测雷暴日的对比分析.气象科学, 2010, 30(6):851-855. http://www.cnki.com.cn/Article/CJFDTOTAL-QXKX201006018.htm [23] 陈绿文, 张义军, 吕伟涛, 等.闪电定位资料与人工引雷观测结果的对比分析.高电压技术, 2009, 35(8):1896-1902. http://www.cnki.com.cn/Article/CJFDTOTAL-GDYJ200908023.htm [24] 樊灵梦, 李志峰, 何宏明, 等.雷电定位系统定位误差分析.高电压技术, 2004, 30(7):61-63. http://www.cnki.com.cn/Article/CJFDTOTAL-GDYJ200407024.htm -


 设为首页
设为首页 加入收藏
加入收藏


 下载:
下载:


