A Method to Suppress the Precipitation Interference on Horizontal Wind of Wind Profile Radar
-
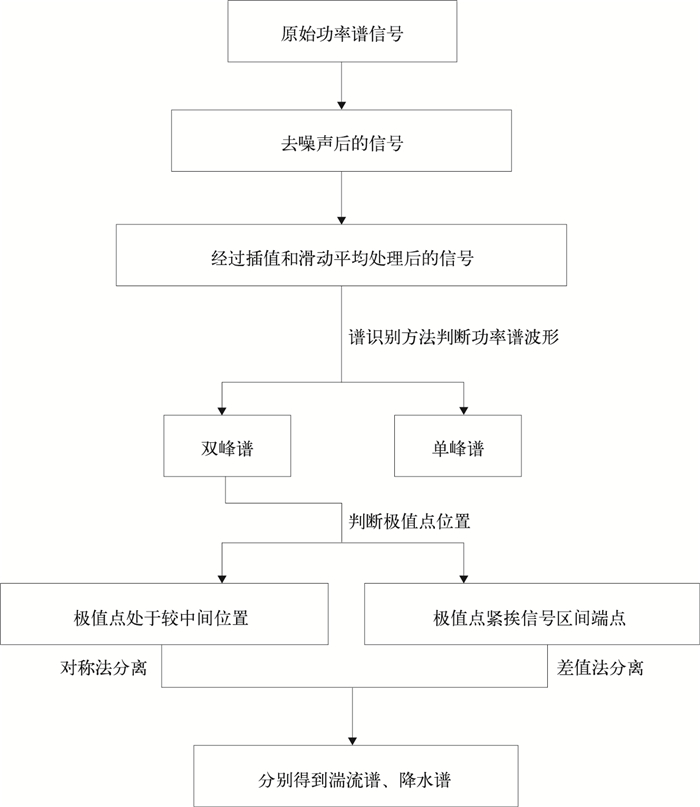
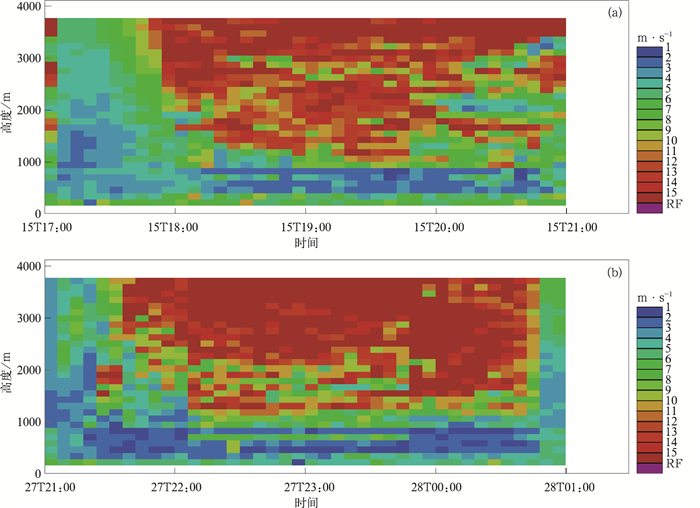
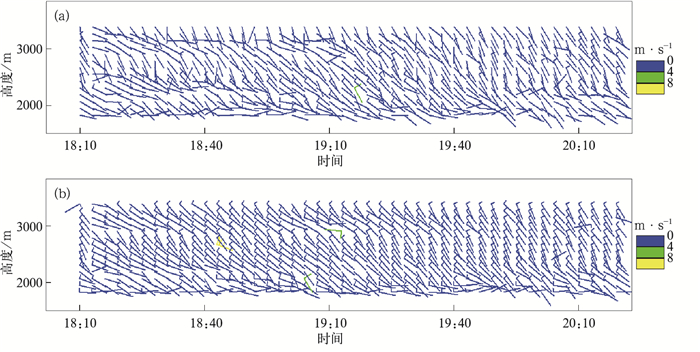
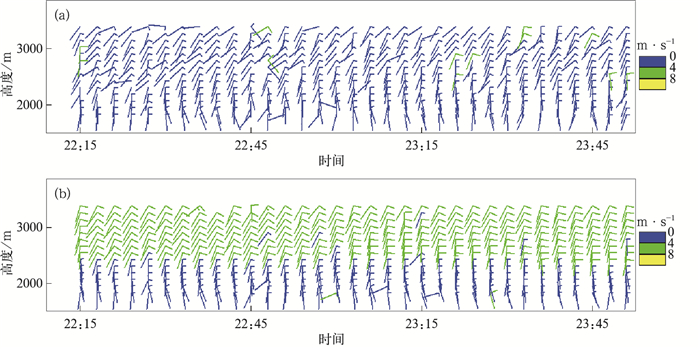
摘要: 降水条件下,风廓线雷达 (wind profiler radar,WPR) 能够同时接收到大气湍流回波和降水粒子的散射回波,降水信号谱与湍流信号谱叠加在一起。风廓线雷达计算水平风时,若采用叠加在一起的功率谱处理降水条件下的探测数据,必将导致后期水平风的合成严重失真。该文首先对原始功率谱数据进行插值和平滑处理,通过功率谱曲线极大值点的个数判断其是否受到降水影响。对于受到降水影响的功率谱,依据湍流谱和降水谱均趋于对称型的特点,用两种方法分别对不同特征的功率谱曲线进行湍流谱和降水谱的分离处理,继而利用分离出的湍流谱信号反演水平风场。研究选取广东省湛江站风廓线雷达2013年6月及7月两次实测降水过程,分析结果表明:用湍流谱代替原始功率谱反演的风场,一致性较处理前有明显提高,从而证明了该分离方法的可行性。Abstract: Wind profile radar (WPR) is a kind of clear air radar, which takes atmospheric turbulence as the main detecting object. In the past few decades, WPR spectral data processing mainly focus on the wind spectrum estimation. In recent years, with the use of WPR data expansion, there are increasingly high demands for WPR data accuracy. However, ground clutter, external noise, flying objects, presence of disturbances such as precipitation and limitations of Fourier Transform often lead multiple peaks overlapping phenomenon, which makes it difficult to judge spectral moments, resulting in large error detection products. Especially in the case of precipitation, wind speed measurement may be even completely wrong. Therefore, the radar power spectrum data need further processing under different weather conditions especially for turbulence and precipitation to establish an effective spectral extraction programs and enhance the wind profile accuracy of radar detection.WPR has a large dynamic reception range, so it can receive the echo of scattering of atmosphere turbulence and scattering of precipitation particles simultaneously during precipitation. In this case, spectrum of atmosphere turbulence and spectrum of precipitation are superimposed. It requires uniform wind-field on horizon when calculating the horizontal wind, but the spatial variability of precipitation will bring distorted horizontal wind-field if the superimposed spectrum data. To avoid this problem, the radar power spectrum data are processed with three steps. First, the original radar power spectrum is processed by interpolation and moving average, judging whether it is affected by precipitation according to the number of maximum points. Second, in the case that the radar power spectrum is affected by precipitation, spectrums of atmosphere turbulence and precipitation are separated by two methods in accordance with spectrum of atmosphere turbulence and spectrum of precipitation's tending to symmetry. And then the horizontal wind-field is derived utilizing the separated spectrum of atmosphere turbulence. Case analysis shows that the consistency of derived wind-field has significant improvement using the spectrum of atmosphere turbulence instead of the original spectrum.
-
Key words:
- WPR;
- spectrum;
- horizontal wind data
-
表 1 广东省湛江站风廓线雷达参数
Table 1 WPR parameters at Zhanjiang Station of Guangdong
参数 取值 采样频率/MHz 60 发射波长/mm 674 脉冲重复频率/Hz 20000 起始采样库的距离高度/m 150 终止采样库的距离高度/m 3630 探测模式 低 距离库长/m 120 发射功率/kW 7.7 相干累积 200 FFT点数 256 谱平均数 5 -
[1] 周旭辉.风廓线雷达功率谱密度数据处理算法研究.南京:南京信息工程大学, 2011. [2] 尹忠海, 张沛源.利用卡尔曼滤波校准方法估算区域降水量.应用气象学报, 2005, 16(2):213-219. doi: 10.11898/1001-7313.20050226 [3] 何平, 朱小燕, 阮征, 等.风廓线雷达探测降水过程的初步研究.应用气象学报, 2009, 8(4):465-470. doi: 10.11898/1001-7313.200904011 [4] 阮征, 葛润生, 吴志根.风廓线仪探测降水云体结构方法的研究.应用气象学报, 2002, 13(3):330-338. http://qikan.camscma.cn/jams/ch/reader/view_abstract.aspx?file_no=20020343&flag=1 [5] 杨馨蕊.风廓线雷达数据质量控制方法探讨及其应用.北京:中国气象科学研究院, 2009. [6] 杨新蕊, 马舒庆, 吴蕾.UHF风廓线雷达降水数据判别方法的比较与评价.大气科学学报, 2010, 33(5):576-581. http://www.cnki.com.cn/Article/CJFDTOTAL-NJQX201005009.htm [7] 腾志遥, 贺红兵.风廓线雷达数据质量控制方法.雷达与对抗, 2008(1):10-15. http://cdmd.cnki.com.cn/Article/CDMD-85101-2009109176.htm [8] Wuertz D B, WeberB L, Strauch R G, et al.Effects of precipitation on UHF wind-profiler measurements.J Atmos Oceanic Tech, 1988, 5:450-465. doi: 10.1175/1520-0426(1988)005<0450:EOPOUW>2.0.CO;2 [9] Steiner A, Richner H.Separation of clear-air echoes from precipitation echoes in UHF wind profiler measurements.Ann Geo-phys, 1994, 12:497-505. [10] Ralph F M, Neiman P J, Uffieux D.Precipitation identification from radar wind profiler spectral moment data:Vertical velocity histograms, velocity variance, and signal power-vertical velocity correlations.J Atmos Oceanic Tech, 1995, 13:545-559. https://www.researchgate.net/publication/249604150_Precipitation_Identification_from_Radar_Wind_Profiler_Spectral_Moment_Data_Vertical_Velocity_Histograms_Velocity_Variance_and_Signal_Power-Vertical_Velocity_Correlations [11] McDonald A J, Carey-Smith T K, Hooper D A, et al.The effect of precipitation on wind-profiler clear air returns.Ann Geo-phys, 2004, 22:3959-3970. https://www.researchgate.net/profile/Adrian_Mcdonald2/publication/41119483_The_effect_of_precipitation_on_wind-profiler_clear_air_returns/links/09e4151271521d0407000000.pdf?origin=publication_detail [12] 王晓蕾.风廓线雷达探测降水云体中雨滴谱的试验研究.南京:南京信息工程大学, 2009. http://www.cnki.com.cn/Article/CJFDTOTAL-GYQX201002026.htm [13] 张旭, 周秀骥.大气折射率结构系数Cn2的观测实验.应用气象学报, 1994, 5(1):19-26. http://qikan.camscma.cn/jams/ch/reader/view_abstract.aspx?file_no=19940105&flag=1 [14] 何平.相控阵风廓线雷达.北京:气象出版社, 2006. [15] 张培昌, 杜秉玉, 戴铁丕.雷达气象学.北京:气象出版社, 2006. [16] 何平, 李柏, 吴蕾, 等.确定风廓线雷达功率谱噪声功率方法.应用气象学报, 2013, 24(3):297-303. doi: 10.11898/1001-7313.20130305 [17] 钟刘军, 阮征, 葛润生, 等.风廓线雷达回波信号强度定标方法.应用气象学报, 2010, 21(5):598-605. doi: 10.11898/1001-7313.20100509 -


 设为首页
设为首页 加入收藏
加入收藏


 下载:
下载:
