Daily Total Radiation Model Based on Air Pollution Index
-
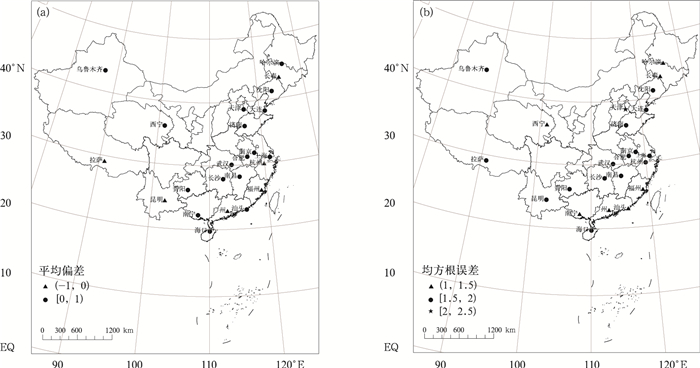
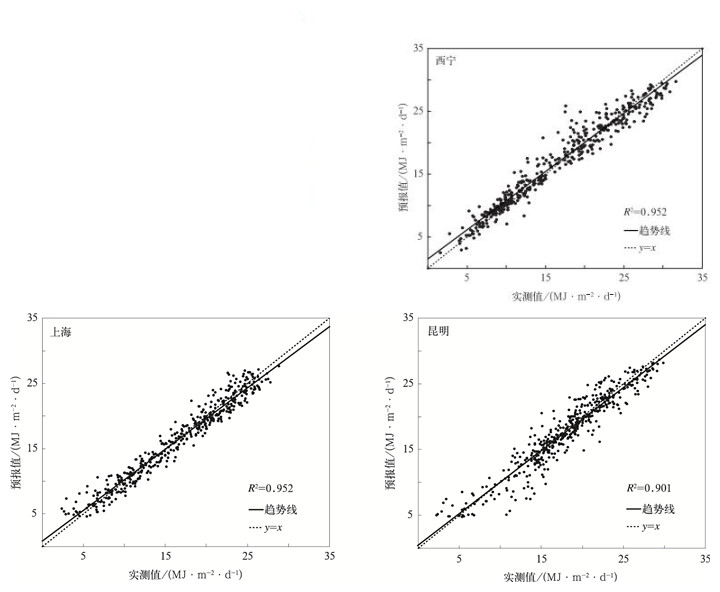
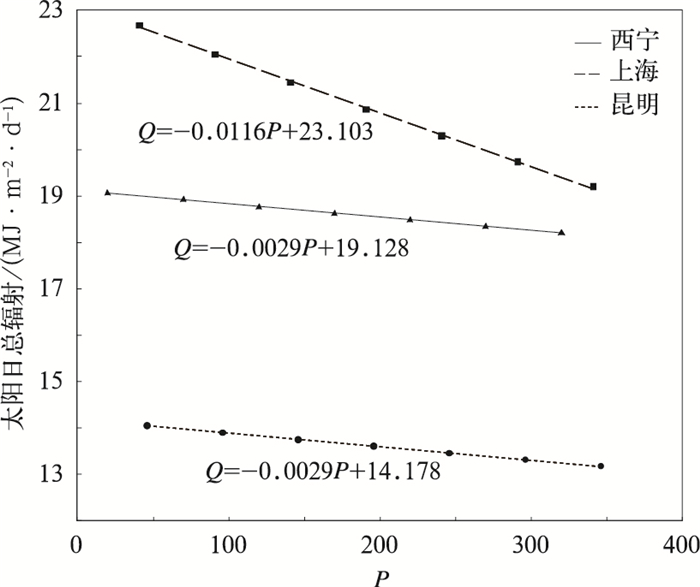
摘要: 通过对2001—2012年全国23个站实测资料的分析,利用非线性回归法建立了以气温日较差、天文日照百分率和空气污染指数为主导因子的太阳日总辐射模型,这里简称为DSRM-Y模型 (Daily Solar Radiation Model-Y),检验其效果并与已有的DSRM-C模型 (Daily Solar Radiation Model-C) 进行效果比对。结果表明:太阳日总辐射与空气污染指数呈显著负相关,DSRM-Y模型的太阳日总辐射估算值与实测值的散点图以及平均偏差、均方根误差、误差分析均表现出较好的拟合效果。将模型应用于西宁、上海、昆明3个代表站,空气污染指数上升后,3个站太阳日总辐射均呈减少趋势;23个站DSRM-Y模型的均方根误差均小于DSRM-C模型,即DSRM-Y模型的拟合效果好于DSRM-C模型。Abstract: Solar radiation is the primary energy source of various physical processes in the natural environment, the basic force of driving formation and evolution of weather and climate. It's one of the most important natural factors in many scientific fields. However, compared with temperature and precipitation, solar radiation data are rather deficient in China, and thus it is necessary to seek a new way to calculate it by using the routine meteorological variables. With the rapid development of the national economy and the continuous expansion of cities, the air quality of some large and medium-sized cities has been gradually worsening. However, these effects are often neglected in radiation model, which may cause great errors in the solar radiation calculation. Therefore, a more precise solar radiation model which regards air pollution index as a dominant factor is built to improve model simulation accuracy. By analyzing the statistical analyses about observations of 23 nationwide sites from 2001 to 2012, the model is established for assessment of daily radiation with nonlinear regression method, which is called DSRM-Y. The model includes three independent variables: Daily temperature range, astronomical percentage of sunshine and air pollution index. Meanwhile, to check the simulation effect, results of DSRM-Y are compared with those of a previous model called DSRM-C. Results show a significant negative correlation between two essential factors of air pollution index and daily solar radiation. In addition, a good fitting effect is expressed in scattering diagram, mean bias error, root mean square error and error analysis of daily total radiation between calculated and measured values. The application result of DSRM-Y at Xining, Shanghai and Kunming indicates, as the air pollution index rises, the daily solar radiation weakens in all three sites. In terms of model comparison, the root mean square error of DSRM-Y is less than that of DSRM-C for all sites, indicating DSRM-Y performs better.
-
表 1 各站DSRM-Y模型经验系数及决定系数R2
Table 1 Empirical coefficients in DSRM-Y and R2 for each station
站点 N a b c d R2 大连 2530 0.511 0.023 0.137 -0.316 0.930 福州 1815 0.424 0.049 0.168 -0.438 0.898 广州 1886 0.445 0.081 0.072 -1.059 0.838 贵阳 1387 0.560 0.074 0.165 -0.499 0.782 哈尔滨 2282 0.447 0.021 0.212 -0.241 0.952 海口 1771 0.507 0.011 0.175 -0.835 0.794 杭州 1832 0.446 0.049 0.160 -0.477 0.902 合肥 2235 0.466 0.019 0.207 -0.497 0.912 济南 2609 0.468 0.035 0.169 -0.773 0.909 昆明 2123 0.509 0.022 0.183 -0.211 0.775 拉萨 2295 0.481 0.061 0.166 -0.118 0.899 南昌 1973 0.480 0.050 0.104 -0.643 0.874 南京 2165 0.493 0.042 0.138 -0.585 0.904 南宁 1880 0.416 0.039 0.205 -0.610 0.853 汕头 2110 0.426 0.035 0.183 -0.166 0.865 上海 2163 0.436 0.032 0.211 -0.555 0.876 沈阳 2539 0.463 0.010 0.223 -0.074 0.929 天津 2820 0.495 0.010 0.209 -0.269 0.874 乌鲁木齐 2351 0.573 0.049 0.047 -0.191 0.937 武汉 2140 0.481 0.054 0.120 -0.904 0.897 西宁 2230 0.493 0.028 0.193 -0.155 0.952 长春 2423 0.528 0.031 0.140 -0.456 0.947 长沙 1727 0.429 0.052 0.102 -0.482 0.818 表 2 DSRM-Y模型估算2001—2010年太阳日总辐射的Eaa与Ear
Table 2 Eaa and Ear of daily solar radiation simulated by DSRM-Y from 2001 to 2010
站点 Eaa/(MJ·m-2·d-1) Ear/% 大连 1.19 8.31 福州 1.05 5.89 广州 1.02 6.28 贵阳 1.49 7.80 哈尔滨 1.08 7.70 海口 1.36 7.28 杭州 1.17 6.75 合肥 1.15 7.19 济南 1.31 8.81 昆明 1.34 7.22 拉萨 1.17 5.63 南昌 1.36 8.16 南京 1.18 6.92 南宁 1.08 5.91 汕头 1.11 6.10 上海 1.34 8.13 沈阳 1.19 8.21 天津 1.64 11.20 乌鲁木齐 1.31 8.23 武汉 1.24 7.72 西宁 1.02 6.02 长春 1.08 7.82 长沙 1.50 9.32 表 3 DSRM-Y模型预测2011—2012年太阳日总辐射预报值的Eaa与Ear
Table 3 Eaa and Ear of daily solar radiation predicted by DSRM-Y from 2011 to 2012
站点 Eaa/(MJ·m-2·d-1) Ear/% 大连 1.32 8.98 福州 1.63 7.59 广州 1.40 7.77 贵阳 3.23 12.65 哈尔滨 3.19 35.01 海口 1.50 7.49 杭州 1.12 5.84 合肥 1.16 6.25 济南 2.14 10.64 昆明 1.31 6.78 拉萨 1.31 6.64 南昌 1.88 8.49 南京 1.06 5.78 南宁 1.20 6.56 汕头 1.28 6.56 上海 1.17 6.03 沈阳 1.43 8.64 天津 1.35 9.01 乌鲁木齐 2.28 15.89 武汉 1.16 6.24 西宁 1.29 7.24 长春 1.08 7.02 长沙 1.46 7.90 -
[1] 汪方, 丁一汇.全球气候模式对东亚地区地表短波辐射的模拟检验.应用气象学报, 2008, 19(6):750-758. http://qikan.camscma.cn/jams/ch/reader/view_abstract.aspx?file_no=20080615&flag=1 [2] 周晋, 晏刚, 吴业正.北京地区的太阳辐射分析.太阳能学报, 2005, 26(5):712-716. http://www.cnki.com.cn/Article/CJFDTOTAL-TYLX200505022.htm [3] Stanhill G, Cohen S.Global dimming:A review of the evidence for a widespread and significant reduction in global radiation with discussion of its probable causes and possible agricultural consequences.Agri For Meteor, 2001, 107(4):255-278. doi: 10.1016/S0168-1923(00)00241-0 [4] 曹雯. 近40年来中国地面太阳总辐射状况及日总辐射模型的研究. 南京: 南京信息工程大学, 2008. [5] 王雅婕, 黄耀, 张稳.1961—2003年中国大陆地表太阳总辐射变化趋势.气候与环境研究, 2009, 14(4):405-413. http://www.cnki.com.cn/Article/CJFDTOTAL-QHYH200904011.htm [6] 宣守丽, 石春林, 金之庆. 近49年长江中下游地区地面太阳辐射的长期变化特征//浙江省气象学会, 江苏省气象学会, 上海市气象学会. 第八届长三角气象科技发展论坛论文集. 上海, 2011: 427-432. [7] 杨羡敏, 曾燕, 邱新法, 等.1960—2000年黄河流域太阳总辐射气候变化规律研究.应用气象学报, 2005, 16(2):243-248. doi: 10.11898/1001-7313.20050230 [8] 李晓文, 李维亮, 周秀骥.中国近30年太阳辐射状况研究.应用气象学报, 1998, 9(1):25-31. http://qikan.camscma.cn/jams/ch/reader/view_abstract.aspx?file_no=19980104&flag=1 [9] Lohmann S, Schillings C, Mayer B, et al.Long-term variability of solar direct and global radiation derived from ISCCP data and comparison with reanalysis data.Solar Energy, 2006, 80(11):1390-1410. doi: 10.1016/j.solener.2006.03.004 [10] 丁一汇, 孙颖.国际气候变化研究进展.气候变化研究进展, 2006, 2(4):161-167. http://www.cnki.com.cn/Article/CJFDTOTAL-QHBH200604003.htm [11] 郑有飞, 关福来, 蔡子颖, 等.我国南方中东部地区地面太阳总辐射变化规律.应用气象学报, 2011, 22(3):312-320. doi: 10.11898/1001-7313.20110307 [12] 童成立, 张文菊, 汤阳, 等.逐日太阳辐射的模拟计算.中国农业气象, 2005, 26(3):165-169. http://www.cnki.com.cn/Article/CJFDTOTAL-ZGNY200503007.htm [13] 许吟隆, Richard Jones.利用ECMWF再分析数据验证PRECIS对中国区域气候的模拟能力.中国农业气象, 2004, 25(1):5-9. http://www.cnki.com.cn/Article/CJFDTOTAL-ZGNY200401001.htm [14] Thornton P E, Steven W.An improved algorithm for estimating incident daily solar radiation from measurements of temperature, humidity and precipitation.Agricultural and Forest Meteorology, 1999, 93(4):211-228. doi: 10.1016/S0168-1923(98)00126-9 [15] 翁笃鸣. 中国辐射气候. 北京: 气象出版社, 1997: 111-116. http://www.cnki.com.cn/Article/CJFDTOTAL-SYQY201603027.htm [16] Bristow K, Campbell G S.On the relationship between incoming solar radiation and daily maximum and minimum temperature.Agric For Meteor, 1984, 31:159-166. doi: 10.1016/0168-1923(84)90017-0 [17] Richardson C W.Weather simulation for crop management models.Transactions of the ASAE, 1985, 28:1602-1606. doi: 10.13031/2013.32484 [18] Hargreaves G L, Hargreaves G H, Riley J P.Irrigation water requirement for Senegal River Basin.Journal of Irrigation and Drainage Engineering-ASCE, 1985, 111:265-275. doi: 10.1061/(ASCE)0733-9437(1985)111:3(265) [19] Liu D L, Scott B J.Estimation of solar radiation in Australia from rainfall and temperature observations. Agricultural and Forest Meteorology, 2001, 106:41-59. doi: 10.1016/S0168-1923(00)00173-8 [20] 任赛赛. 福建省太阳辐射的气候学研究. 南京: 南京信息工程大学, 2010. [21] 张运林, 秦伯强, 陈伟民, 等.太湖无锡地区太阳总辐射的气候学计算以及特征分析.应用气象学报, 2003, 14(3):340-347. http://qikan.camscma.cn/jams/ch/reader/view_abstract.aspx?file_no=20030341&flag=1 [22] 申彦波, 张顺谦, 郭鹏, 等.四川省太阳能资源气候学计算.应用气象学报, 2014, 25(4):493-498. doi: 10.11898/1001-7313.20140413 [23] 曹雯, 申双和.我国太阳日总辐射计算方法的研究.南京气象学院学报, 2008, 31(4):587-591. http://cpfd.cnki.com.cn/Article/CPFDTOTAL-ZGQX200610016073.htm [24] 赵东. 中国太阳能长期变化及计算方法研究. 南京: 南京信息工程大学, 2009. [25] 和清华, 谢云.我国太阳总辐射气候学计算方法研究.自然资源学报, 2010, 25(2):308-319. doi: 10.11849/zrzyxb.2010.02.015 [26] 中华人民共和国环境保护部. 城市空气质量日报技术规定. 2000. -


 设为首页
设为首页 加入收藏
加入收藏


 下载:
下载:


