
 设为首页
设为首页 加入收藏
加入收藏

Observational Study on the Ground-based UVI at Dangxiong of Tibet
-
摘要: 基于西藏当雄2009年9月—2011年8月地基紫外线指数 (UVI) 观测,结合TUV辐射传输模式分析, 该文检验太阳天顶角、云、臭氧、积雪和气溶胶对UVI的影响。结果显示,影响地面UVI主要因素是太阳天顶角和云。晴天地面UVI可简单用太阳天顶角拟合函数表征;地面UVI的云调制因子总体上随云量增加呈下降趋势,但间隙性、未遮蔽日面的云可增强太阳散射辐射,使云调制因子值平均增加约3%~6%,个别情形达40%。臭氧低谷使当雄UVI比同纬度平原地区增加约12%;冬季短期、浅层积雪使UVI增加16%或更低,也低于模式模拟值 (23%);气溶胶 (光学厚度为0.02~0.1) 对UVI衰减低于3%。因臭氧低谷导致青藏高原臭氧南北分布的差异,相同太阳天顶角下拉萨 (海拔为3650 m) UVI较瓦里关 (海拔为3810 m) 偏高7%~10%。与卫星产品比较表明:OMI卫星UVI产品在当雄、沱沱河、瓦里关和拉萨较地基测值总体偏高65%以上,而晴天则平均分别偏高8.6%,13%,9%和50%。云、地基与卫星像元地理位置差异应是卫星UVI产品偏高的原因。当雄地基UVI测值大于14时,卫星UVI产品反而低3%应与间隙性云有效增强了地面辐射有关。Abstract: Factors of solar zenith angle (SZA), cloud, ozone and snow cover modifying the surface ultraviolet index (UVI) in the Tibetan Plateau are presented by the TUV model simulations and the two-year continuous ground-based measurements at Dangxiong (30.48°N, 91.10°E, 4200 m a.s.l) from September 2009 to August 2011. Results show that the key factors affecting the UVI over the Tibetan region are SZA and cloud. Variations of cloud-free surface UVI can be characterized exactly as a simple empirical SZA function. The UVI cloud modification factor (CMF) generally reduces by 46% as the cloud amount increases from 0 to 100%. CMF might increase by 3%-6%, or even by 40% in individual cases if the solar disk is partly masked with broken clouds. The ozone valley enhances 12% summer surface UVI compared to plain regions of the similar latitudes. The winter short-term thin snow coverage could enhance 16% or less surface UVI, and this enhancement is lower than that from the simulations (23%). UVI attenuation caused by aerosols with optical depth of 0.02-0.1 is no more than 3%. As compared with UVI measured at Lhasa (29.67°N, 91.13°E, 3650 m a.s.l), Tuotuohe (34.22°N, 92.43°E, 4500 m a.s.l) and Waliguan (36.29°N, 100.90°E, 3810 m a.s.l), the difference of site-altitude is a key factor influencing the UVI. Under the same SZA conditions, the summer UVI at Lhasa is 7%-10% higher than that at Waliguan due to the southern thinner ozone layer, the ozone valley. Comparison with satellite-derived product shows that, averagely, the OMI-UVI is 80% higher than the ground-based values at Dangxiong but only 8.6% higher under cloud-free circumstances. The OMI-UVIs are all above 65% higher than those ground-based measurements at the other 3 sites but their cloud-free values are only 13%, 9% and 50% higher at Tuotuohe, Waliguan and Lhasa, respectively. Clouds and geographical mismatches between the satellite pixel and fixed ground-based observation site are supposed to be the main factors of higher space-based UVI values, particularly over Lhasa. As the ground-based UVI is more than 14, the coincident space-based UVI is generally 3% lower at Dangxiong owning to the broken clouds strengthening the in-situ radiation.
-
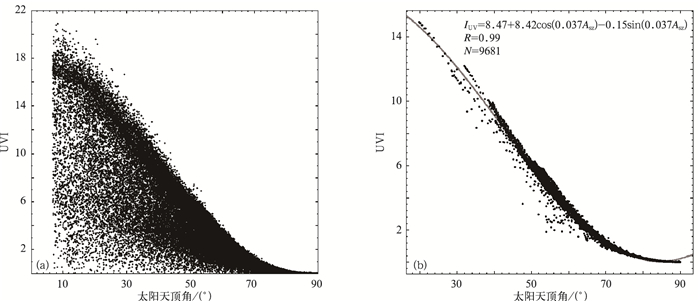
图 2 当雄UVI (10 min平均) 随太阳天顶角的变化
(a) 所有天气,(b) 晴天
Fig. 2 UVI (10 min mean) as a function of SZA observed at Dangxiong
(a) all-sky, (b) cloud-free
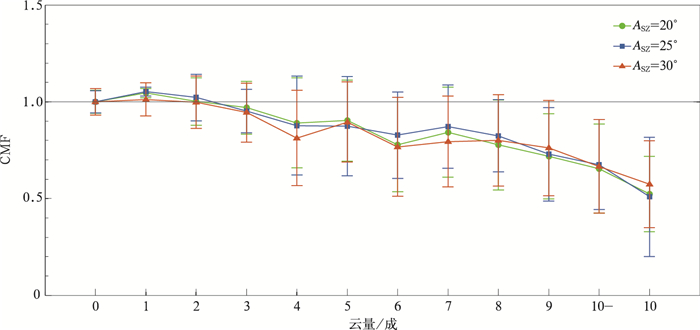
图 3 不同太阳天顶角条件下CMF值随云量变化的统计结果
Fig. 3 Variations of CMF with changes of cloud amount at different SZAs

图 4 太阳天顶角接近时但不同云况下UVI日变化比较
Fig. 4 Comparison of UVI under conditions of different cloud coverage
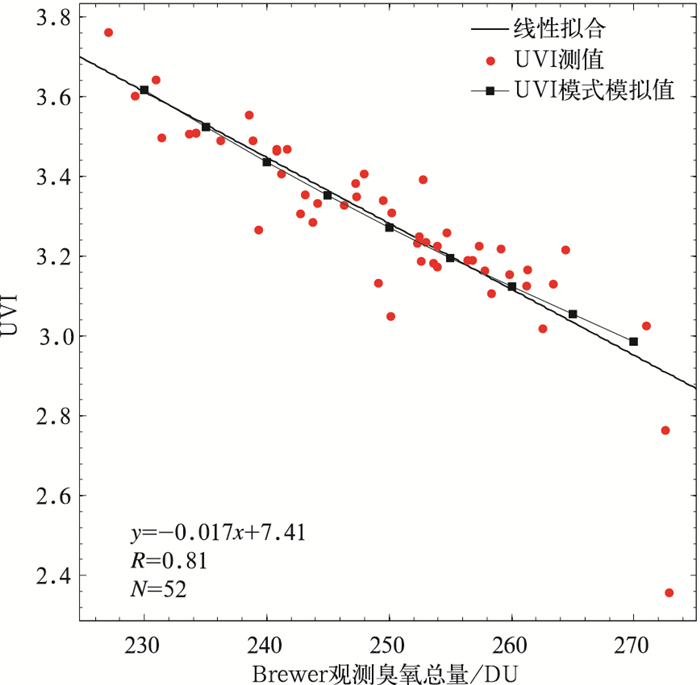
图 5 晴天条件下ASZ=60°±2.5°时臭氧总量与UVI的变化趋势
Fig. 5 UVI as a function of total ozone with SZA of 60°±2.5° under clear-sky condition
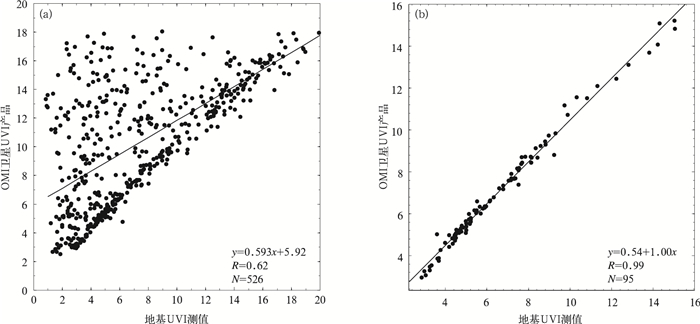
图 6 当雄卫星过境时刻地基与卫星UVI值比较
(a) 所有天气,(b) 晴天
Fig. 6 UVI Comparison between satellite-derived overpass and ground-based measurements at Dangxiong under all sky conditions (a) and clear-day only (b)
表 1 晴天积雪对UVI影响的调查
Table 1 Investigation of influences from snow coverage on UVI at Dangxiong
年份 日序 SZA=55° SZA=60° 臭氧总量/DU 积雪 反照率 实测值 模式值 实测值 模式值 2009 323 4.81 5.32 3.45 3.82 260 有 0.8 2009 325 4.64 4.38 3.31 3.14 259 无 0.05 2009 330 4.62 4.37 3.28 3.13 260 无 0.05 2009 363 4.41 4.36 3.13 3.12 260 无 0.05 2010 2 5.14 5.35 3.66 3.84 259 有 0.8 2010 11 4.83 4.76 3.42 3.41 242 无 0.05  下载: 导出CSV
表 2 当雄、沱沱河、拉萨、瓦里关地基UVI测值的比较
Table 2 Comparison of ground-based UVI at Dangxiong, Tutuhe, Lhasa, Waliguan
太阳天
顶角/(°)当雄 沱沱河 拉萨 瓦里关 UVI 样本量 UVI 样本量 UVI 样本量 UVI 样本量 60 2.46±0.85 16631 2.14±0.85 186 1.7±0.53 1162 2.13±0.69 4657 50 4.41±1.61 17047 4.25±1.60 135 3.53±1.08 1039 3.56±1.36 2576 40 6.57±2.63 12796 6.85±2.43 56 5.49±1.75 947 5.12±2.25 1966 30 8.72±3.66 9340 9.09±2.98 71 7.19±2.50 642 6.58±3.19 1601 20 11.06±4.61 7216 12.03±3.89 26 9.22±3.50 398 8.35±3.95 1171 10 12.66±5.27 4582 10.16±3.30 369
下载: 导出CSV
表 3 当雄、沱沱河、拉萨、瓦里关地基UVI测值与OMI卫星UVI产品的相对差别
Table 3 UVI relative differences between ground-based and OMI over 4 sites
天气 当雄 沱沱河 拉萨 瓦里关 相对差别/% 样本量 相对差别/% 样本量 相对差别/% 样本量 相对差别/% 样本量 总体 80.1±166.1 545 86.8±156.5 104 91.9±114.9 765 67.8±136.0 2045 云天 96.3±180.3 450 108.8±172.0 80 113.1±134.9 510 99.8±158.6 1327 晴天 8.6±5.4 95 13.3±27.3 24 49.6±23.3 255 8.7±29.0 718
下载: 导出CSV
-
[1] 汤洁, 王炳忠, 张保洲, 等.紫外红斑效应参照谱、标准红斑辐射剂量和紫外指数.北京:中国标准出版社, 2007. [2] World Health Organization.Global Solar UV Index:A Practical Guide.International Commission on Non-Ionizing Radiation Protection.2002. [3] 沈元芳, 况石.紫外线模式预报方法的研究和试验.应用气象学报, 2002, 13(增刊Ⅰ):223-231. http://www.cnki.com.cn/Article/CJFDTOTAL-YYQX2002S1024.htm [4] Ren P B C, Sigernes F, Gjessing Y.Ground-based measurements of solar ultraviolet radiation in Tibet:Preliminary results. Geophys Res Letters, 1997, 24(11):1359-1362. doi: 10.1029/97GL01319 [5] Norsang G, Kocbach L, Stamnes J, et al.Spatial distribution and temporal variation of solar UV radiation over the Tibetan Plateau. Applied Physics Research, 2011, 3(1):37-46. https://www.researchgate.net/publication/276044082_Spatial_Distribution_and_Temporal_Variation_of_Solar_UV_Radiation_over_the_Tibetan_Plateau [6] Zhou X, Luo C.Ozone valley over Tibetan plateau. Acta Meteorologica Sinica, 1994, 8(4):505-506. http://mall.cnki.net/magazine/Article/QXXW199404016.htm [7] Liley J B, McKenzie R L.Where on Earth has the Highest UV?UV Radiation and its Effects:An Update.2006:26-37.http://www.niwascience.co.nz/rc/atmos/uvconference. http://www.niwascience.co.nz/rc/atmos/uvconference [8] Estupián J G, Raman S, Crescenti G H, et al.Effects of clouds and haze on UV-B radiation. Journal of Geophysical Research:Atmospheres (1984-2012), 1996, 101(D11):16807-16816. doi: 10.1029/96JD01170 [9] Casale G, Meloni D, Miano S, et al.Solar UV-B irradiance and total ozone in Italy:Fluctuations and trends. Journal of Geophysical Research:Atmospheres (1984-2012), 2000, 105(D4):4895-4901. doi: 10.1029/1999JD900303 [10] Dahlback A, Gelsor N, Stamnes J J, et al.UV measurements in the 3000-5000 m altitude region in Tibet. J Geophys Res, 2007, 112(D9):139-155. https://www.researchgate.net/profile/Arne_Dahlback/publication/241062647_UV_Measurements_in_the_3000-5000_m_altitude_region_in_Tibet/links/0deec531a504e2b16e000000/UV-Measurements-in-the-3000-5000-m-altitude-region-in-Tibet.pdf [11] 张晓春, 汤洁, 王炳忠.用Yankee (扬基) UVB-1型紫外辐射表测量大气中的紫外B辐射.青海环境, 2003(3):100-104. http://www.cnki.com.cn/Article/CJFDTOTAL-QHHJ200303002.htm [12] Yankee Environmental Systems, Inc.UVB-1 Ultraviolet Pyranometer Installation and User Guide Version 2.0.http://www.yesinc.com/products/data/uvb1/. [13] 饶晓琴.青藏高原地区太阳紫外辐射的观测资料分析与数值模拟研究.北京:中国气象科学研究院, 2003:30-33. [14] Tanskanen A, Lindfors A, Määttä A, et al.Validation of daily erythemal doses from ozone monitoring instrument with ground-based UV measurement data. Journal of Geophysical Research:Atmospheres (1984-2012), 2007, 112(D24):177-180. http://www.academia.edu/572512/Validation_of_daily_erythemal_doses_from_Ozone_Monitoring_Instrument_with_ground-based_UV_measurement_data [15] Hofzumahaus A, Kraus A, Müller M.Solar actinic flux spectroradiometry:A technique for measuring photolysis frequencies in the atmosphere. Applied Optics, 1999, 38(21):4443-4460. doi: 10.1364/AO.38.004443 [16] Calbó J, Pagès D, González J A.Empirical studies of cloud effects on UV radiation:A review. Reviews of Geophysics, 2005, 43(2):RG2002. https://www.researchgate.net/profile/Josep_Calbo2/publication/228660510_Empirical_studies_of_cloud_effects_on_UV_radiation_A_review/links/0c96051fa266577cc9000000/Empirical-studies-of-cloud-effects-on-UV-radiation-A-review.pdf [17] Madronich S, Flocke S, Zeng J, et al.Tropospheric ultraviolet-visible model (TUV), 2011.http://www2.acd.ucar.edu/modeling/tropospheric-ultraviolet-and-visible-tuv-radiation-model. [18] Norsang G, Kocbach L, Tsoja W, et al.Ground-based measurements and modeling of solar UV-B radiation in Lhasa, Tibet. Atmospheric Environment, 2009, 43(8):1498-1502. doi: 10.1016/j.atmosenv.2008.11.048 [19] 徐祥德, 陈联寿.青藏高原大气科学试验研究进展.应用气象学报, 2007, 17(6):756-772. http://qikan.camscma.cn/jams/ch/reader/view_abstract.aspx?file_no=200606124&flag=1 [20] 卓嘎, 徐祥德, 陈联寿.青藏高原对流云团东移发展的不稳定特征.应用气象学报, 2002, 13(4):448-456. http://qikan.camscma.cn/jams/ch/reader/view_abstract.aspx?file_no=20020460&flag=1 [21] 陆龙骅, 周国贤, 张正秋.1992年夏季珠穆朗玛峰地区的太阳直接辐射和总辐射.太阳能学报, 1995, 16(3):229-233. http://www.cnki.com.cn/Article/CJFDTOTAL-TYLX503.000.htm [22] Piacentini R D, Salum G M, Fraidenraich N, et al. Extreme total solar irradiance due to cloud enhancement at sea level of the NE Atlantic coast of Brazil. Renewable Energy, 2011, 36(1):409-412. doi: 10.1016/j.renene.2010.06.009 [23] 郑向东, 汤洁, 李维亮, 等.拉萨地区1998年夏季臭氧总量及垂直廓线的观测研究.应用气象学报, 2000, 11(2):173-179. http://qikan.camscma.cn/jams/ch/reader/view_abstract.aspx?file_no=20000226&flag=1 [24] 蔡兆男, 王永, 郑向东, 等.利用探空资料验证GOME卫星臭氧数据.应用气象学报, 2009, 20(3):337-345. doi: 10.11898/1001-7313.20090310 [25] 王普才, 吴北婴, 章文星.影响地面紫外辐射的因素分析.大气科学, 1999, 23(1):1-8. http://www.cnki.com.cn/Article/CJFDTOTAL-DQXK901.000.htm [26] Kylling A, Dahlback A, Mayer B.The effect of clouds and surface albedo on UV irradiances at a high latitude site. Geophys Res Lett, 2000, 27(9):1411-1414. doi: 10.1029/1999GL011015 [27] 蒋熹.冰雪反照率研究进展.冰川与冻土, 2006, 28(5):728-738. http://www.cnki.com.cn/Article/CJFDTOTAL-BCDT200605015.htm [28] 孙治安, 翁笃鸣.青藏高原地区地表及行星反射率.应用气象学报, 1994, 5(4):394-401. http://qikan.camscma.cn/jams/ch/reader/view_abstract.aspx?file_no=19940471&flag=1 [29] 张军华, 刘莉, 毛节泰.地基多波段遥感西藏当雄地区气溶胶光学特性.大气科学, 2000, 24(4):549-558. http://www.cnki.com.cn/Article/CJFDTOTAL-DQXK200004010.htm [30] Ialongo I, Casale G R, Siani A M.Comparison of total ozone and erythemal UV data from OMI with ground-based measurements at Rome station. Atmospheric Chemistry and Physics, 2008, 8(1):3283-3289. http://www.oalib.com/paper/1366969 [31] Buchard V, Brogniez C, Auriol F, et al.Comparison of OMI ozone and UV irradiance data with ground-based measurements at two French sites. Atmospheric Chemistry and Physics, 2008, 8(16):4517-4528. doi: 10.5194/acp-8-4517-2008 [32] Krotkov N, Bhartia P, Herman J, et al.Satellite estimation of spectral surface UV irradiance in the presence of tropospheric aerosols:1.Cloud-free case. Journal of Geophysical Research:Atmospheres (1984-2012), 1998, 103(D8):8779-8793. http://www.citeulike.org/user/harish/article/1398555 [33] Torres O, Tanskanen A, Veihelmann B, et al.Aerosols and surface UV products from ozone monitoring instrument observations:An overview. Journal of Geophysical Research:Atmospheres (1984-2012), 2007, 112(D24):177-180. https://www.researchgate.net/publication/233894226_Aerosols_and_surface_UV_products_from_Ozone_Monitoring_Instrument_observations_An_overview -

计量
- 摘要浏览量: 3853
- HTML全文浏览量: 1235
- PDF下载量: 1447
- 被引次数: 0
