Quality Factors and Processing Algorithm for Wind Profiling Radar Data
-
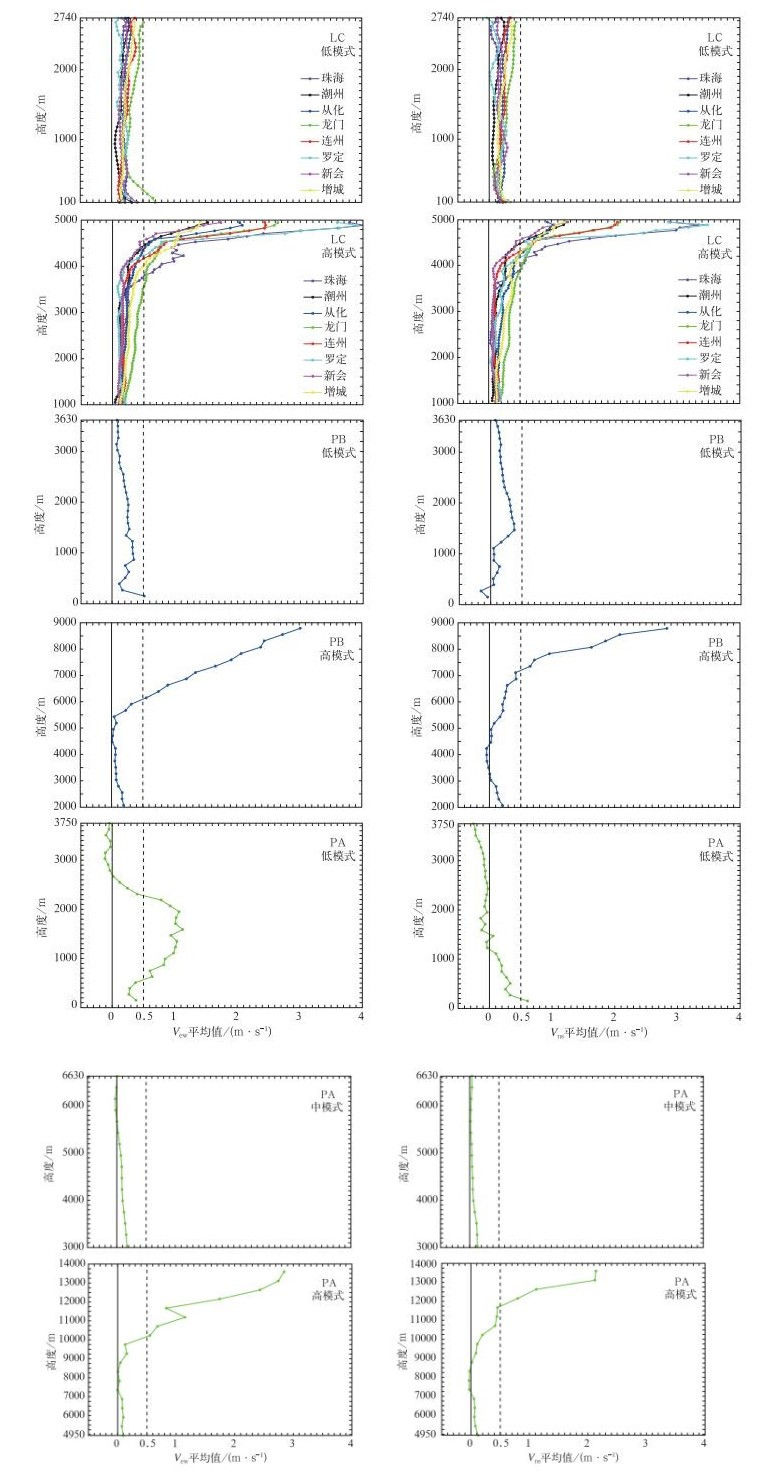
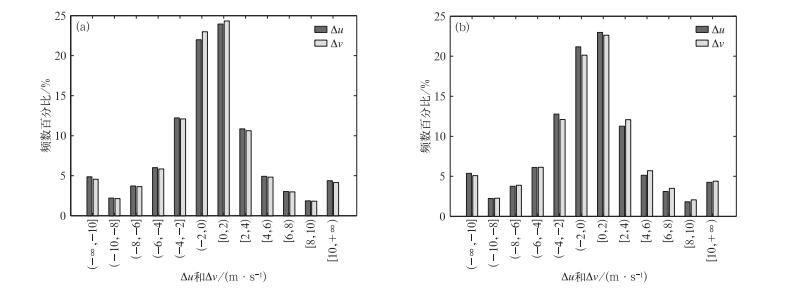
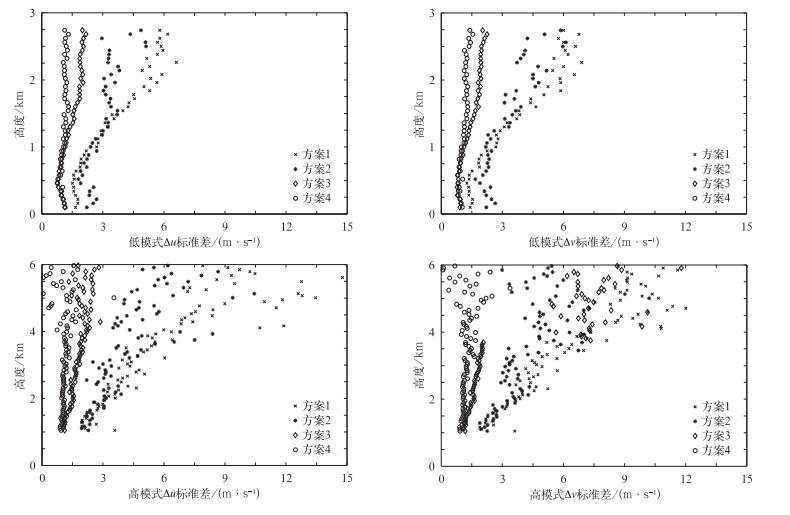
摘要: 风廓线雷达系统误差和探测数据时空代表性影响风的数据质量。针对五波束探测风廓线雷达,提出雷达系统误差检测方法并分析风的空间不均匀分布和时间代表性对风数据质量的影响。在此基础上,通过比较4组三波束计算的两组水平风u,v分量离差进行风的空间均匀性判别,并比较了一致性平均和数学平均两种时间代表性处理算法间的测风精度差异。利用广东风廓线雷达站网2014年3—5月10部雷达数据进行方法应用和评估。结果表明:稳定大气条件下,3种型号雷达 (LC,PB,PA) 的有效数据高度分别达到3,6 km和10 km的雷达系统功能设计需求。经空间均匀性检验与时间一致性平均处理的风数据在降水期间质量优于业务雷达数据,3—5月10部雷达获取的两组u,v分量离差标准差约为1 m·s-1,表明经过空间一致性检验和时间一致性平均处理后的数据质量较好。Abstract: In recent years, wind profiling radar (WPR) network in China is under rapid development. To take advantage of the network measurements in weather analysis and numerical prediction, it's of great significance to make full aware of quality factors and improve the current processing algorithm for WPR data.Many factors affect the quality of horizontal wind data detected by WPR, especially system error and meteorological background. According to five-beam WPR, a new method for examining system error from radar Doppler measurements is proposed. As for meteorological background, wind filed is assumed homogenous when it is detected by WPR, and the accuracy of horizontal wind data will decline when the assumption is not satisfied. During the period of precipitation, scattering caused by raindrops is much stronger than turbulence detected by WPR. And the assumption of homogenous wind breaks down easily for the cause that fall terminal velocity of precipitation particles changes rapidly in space when convective precipitation happens, which is a significant problem for WPR data quality control algorithm.However, two independent wind profiles can be measured with a five-beam WPR and differences between measured zonal winds and meridional winds can reflect errors caused by the inhomogeneity of wind field. In order to reduce such errors, all observations are examined to make sure data detected under circumstances where the wind filed is extremely inhomogenous are deleted. Besides, different averaging methods, such as consensus average and simple average, used to calculate hourly averaged winds also affect the accuracy of it and comparisons are conducted on two averaging methods.Combined with 10 radars of Guangdong WPR network, evaluation of the new methods for processing basic data is analyzed from March to May in 2014. Results show that 10 radars in Guangdong WPR network, including 8 boundary radars (LC), 1 troposphere radar Ⅰ(PA) and 1 troposphere radar Ⅱ(PB), meet the designed requirements respectively in terms of the maximum height of credible data in clear air, which is 3 km for LC radar, 6 km for PB radar and 10 km for PA radar. Furthermore, there are no large system errors in 10 radars except that the examining consequence is unsatisfactory during 1-2 km for PA radar. It is necessary to consider the atmospheric inhomogeneities that may cause great errors especially when it rains heavily, and consensus averaged wind is superior to simple averaged wind in median and high heights. Therefore, an improved algorithm according to examination of atmospheric inhomogeneities and consensus average is proposed to obtain hourly averaged winds. It is proved that winds obtained from the improved algorithm show better representation than the currently used data during precipitation, as the stand deviation of differences between two independent measured zonal wind values and meridional wind values are both close to 1 m·s-1.
-
表 1 风廓线雷达参数
Table 1 Parameters of wind profile radars
参数 边界层雷达 (LC) 对流层Ⅱ型雷达 (PB) 对流层Ⅰ型雷达 (PA) 低模式 高模式 低模式 高模式 低模式 中模式 高模式 波长/mm 232 232 674 674 674 674 674 探测起始高度/m 100 1050 150 2070 150 3030 4950 探测终止高度/m 2740 5970 3630 10470 3750 6630 16950 距离库数 45 83 30 36 31 16 26 距离库长/m 60 60 120 240 120 240 480 表 2 2014年3—5月晴空稳定大气条件下广东风廓线雷达站网有效探测高度 (单位:km)
Table 2 Valid height of Guangdong wind profiler network from Mar to May in 2014 of clear sky (unit:km)
站名 3月 4月 5月 珠海 3.8 4.4 3.2 潮州 4.4 4.4 3.6 从化 4.2 4.4 3.6 龙门 3.6 4.2 4.2 新会 4.6 4.6 3.6 罗定 4.2 4.5 3.6 连州 4.2 4.6 4.2 增城 4.0 4.6 3.4 湛江 6.0 7.0 8.0 萝岗 10.0 12.0 12.0 表 3 数学平均法与一致性平均法的Δu,Δv标准差
Table 3 Standard deviation of Δu and Δv using simple average and consensus average
高度/km 数学平均 一致性平均 Δu标准差/(m·s-1) Δv标准差/(m·s-1) Δu标准差/(m·s-1) Δv标准差/(m·s-1) (0,1] 1.85 1.70 2.29 2.25 (1,2] 2.52 2.72 2.46 2.59 (2,3] 3.97 4.38 3.20 3.62 (3,4] 5.06 6.52 4.68 4.65 (4,5] 8.73 9.69 4.44 5.37 表 4 算法处理结果与业务OOBS数据比对
Table 4 Comparison between improved algorithm data and OOBS data
高度/km 业务OOBS数据 算法处理结果 u离差标准差/
(m·s-1)v离差标准差/
(m·s-1)u离差标准差/
(m·s-1)v离差标准差/
(m·s-1)(0, 1] 2.2 2.4 1.6 1.6 (1, 2] 2.4 2.5 1.5 1.6 (2, 3] 2.7 2.7 1.8 1.7 (3, 4] 2.6 3.1 1.6 1.5 (4, 5] 3.7 3.3 1.4 1.5 表 5 广东风廓线雷达站网2014年3—5月Δu,Δv标准差 (单位:m·s-1)
Table 5 The standard deviation of Δu and Δv in Guangdong wind profiler network from Mar to May in 2014(unit:m·s-1)
站点 探测模式 Δu标准差 Δv标准差 3月 4月 5月 3月 4月 5月 珠海 低 1.07 1.12 1.12 1.06 1.12 1.08 高 1.04 1.05 1.14 1.11 1.08 1.15 潮州 低 1.17 1.24 1.36 1.09 1.13 1.30 高 1.16 1.27 1.38 1.14 1.25 1.35 从化 低 1.18 1.23 1.32 1.17 1.21 1.33 高 1.14 1.18 1.31 1.15 1.23 1.30 龙门 低 1.13 1.21 1.32 1.14 1.13 1.29 高 1.14 1.14 1.39 1.10 1.14 1.37 新会 低 1.12 1.09 1.23 1.15 1.29 1.21 高 1.00 1.05 1.24 1.04 1.20 1.28 罗定 低 1.10 1.19 1.24 1.15 1.19 1.24 高 1.10 1.16 1.29 1.20 1.19 1.30 连州 低 1.36 1.40 1.30 1.37 1.40 1.29 高 1.19 1.26 1.28 1.21 1.29 1.26 增城 低 1.12 1.18 1.20 1.22 1.24 1.26 高 1.12 1.19 1.29 1.22 1.27 1.29 湛江 低 0.96 0.94 0.91 1.03 0.91 0.87 高 1.24 1.10 1.11 1.17 1.09 1.10 萝岗 低 1.36 1.25 1.37 0.94 1.00 0.92 中 0.68 0.78 1.03 0.71 0.74 1.29 高 1.22 1.15 1.30 1.30 1.20 1.31 -
[1] 阮征, 葛润生, 吴志根, 等.风廓线仪探测降水云体结构方法的研究.应用气象学报, 2002, 13(3):330-338. http://qikan.camscma.cn/jams/ch/reader/view_abstract.aspx?file_no=20020343&flag=1 [2] 刘淑媛, 郑永光, 陶祖钰.利用风廓线雷达资料分析低空急流的脉动与暴雨关系.热带气象学报, 2003, 19(3):63-68. http://cpfd.cnki.com.cn/Article/CPFDTOTAL-BJQX200811001013.htm [3] 阮征, 何平, 葛润生.风廓线雷达对大气折射率结构常数的探测研究.大气科学, 2008, 32(1):133-140. http://www.cnki.com.cn/Article/CJFDTOTAL-DQXK200801012.htm [4] 孙康远, 阮征, 魏鸣, 等.风廓线雷达反演大气比湿廓线的初步试验.应用气象学报, 2013, 24(4):407-415. doi: 10.11898/1001-7313.20130403 [5] 何越, 何平, 林晓萌.基于双高斯拟合的风廓线雷达反演雨滴谱.应用气象学报, 2014, 25(5):570-580. doi: 10.11898/1001-7313.20140506 [6] 蒲维维, 赵秀娟, 张小玲.北京地区夏末秋初气象要素对PM2.5污染的影响.应用气象学报, 2011, 22(6):716-723. doi: 10.11898/1001-7313.20110609 [7] Weber B L, Wuertz D B, Strauch R G, et al.Preliminary evaluation of the first NOAA demonstration network profiler.J Atmos Oceanic Technol, 1990, 7:909-918. doi: 10.1175/1520-0426(1990)007<0909:PEOTFN>2.0.CO;2 [8] Masahito Ishihara, Yoshio Kato, Toshihiro Abo, et al.Characteristics and performance of the operational wind profiler network of the Japan meteorological agency.J Meteor Soc Japan, 2006, 86(6):1085-1096. https://www.researchgate.net/publication/228696394_Characteristics_and_performance_of_the_operational_wind_profiler_network_of_the_Japan_Meteorological_Agency [9] Benjamin S G, Schwartz B E, Szoke E J, et al.The Value of Wind Profiler Data in U.S. Weather Forecasting.Amer Meteor Soc, 2004, 85:1871-1886. doi: 10.1175/BAMS-85-12-1871 [10] Dunn L.An example of subjective interpretation of network profiler data in real-time forecasting.Wea Forecasting, 1986, 1:219-225. doi: 10.1175/1520-0434(1986)001<0219:AEOSIO>2.0.CO;2 [11] Strauch R G, Merritt D A, Moran K P, et al.The Colorado wind profiling network.J Atmos Oceanic Technol, 1984, 1:37-49. doi: 10.1175/1520-0426(1984)001<0037:TCWPN>2.0.CO;2 [12] Weber B L, Wuertz D B, Welsh D C.Quality controls for profiler measurements of winds and RASS temperatures.J Atmos Oceanic Technol, 1993, 10:452-464. doi: 10.1175/1520-0426(1993)010<0452:QCFPMO>2.0.CO;2 [13] Lambert W C, Taylor G E.Data Quality Assessment Methods for the Eastern Range 915 MHz Wind Profiler Network.NASA Contractor Report CR-1998-207906, Kennedy Space Center, 1998. https://www.researchgate.net/publication/24295330_Data_Quality_Assessment_Methods_for_the_Eastern_Range_915_MHz_Wind_Profiler_Network [14] Weber B L, Wuertz D B.Comparison of rawinsonde and wind profiler radar measurements.J Atmos Oceanic Technol, 1990, 7:157-174. doi: 10.1175/1520-0426(1990)007<0157:CORAWP>2.0.CO;2 [15] May P T.Comparison of wind-profiler and radiosonde measurements in the tropics.J Atmos Oceanic Technol, 1993, 10:122-127. doi: 10.1175/1520-0426(1993)010<0122:COWPAR>2.0.CO;2 [16] 王欣, 卞林根, 彭浩, 等.风廓线仪系统探测试验与应用.应用气象学报, 2005, 16(5):693-698. doi: 10.11898/1001-7313.20050517 [17] Strauch R G, Weber B L, Frisch A S, et al.The precision and relative accuracy of profiler wind measurements.J Atmos Oceanic Technol, 1987, 4:563-571. doi: 10.1175/1520-0426(1987)004<0563:TPARAO>2.0.CO;2 [18] Wuertz D B, Weber B L, Strauch R G.Effect of precipitation on UHF wind profiler measurements.J Atmos Oceanic Technol, 1988, 5:450-465. doi: 10.1175/1520-0426(1988)005<0450:EOPOUW>2.0.CO;2 [19] 邓闯, 阮征, 魏鸣, 等.风廓线雷达测风精度评估.应用气象学报, 2012, 23(5):523-532. doi: 10.11898/1001-7313.20120502 [20] 李晨光, 刘淑媛, 陶祖钰.华南暴雨实验期间香港风廓线雷达资料的评估.热带气象学报, 2003, 19(3):269-276. http://www.cnki.com.cn/Article/CJFDTOTAL-RDQX200303005.htm [21] 万蓉, 周志敏, 崔春光, 等.风廓线雷达资料和探空资料的对比分析.暴雨灾害, 2011, 30(2):130-136. http://www.cnki.com.cn/Article/CJFDTOTAL-HBQX201102006.htm [22] 杨馨蕊, 马舒庆, 吴蕾.UHF风廓线雷达降水数据判别方法的比较与评价.大气科学学报, 2010, 33(5):576-581. http://www.cnki.com.cn/Article/CJFDTOTAL-NJQX201005009.htm [23] 陈少应, 王凡.风廓线雷达测量精度分析.现代雷达, 2000, 22(5):11-17. http://www.cnki.com.cn/Article/CJFDTOTAL-XDLD200005002.htm -


 设为首页
设为首页 加入收藏
加入收藏


 下载:
下载:


