
 设为首页
设为首页 加入收藏
加入收藏

Thermal Characteristics over Eurasia in January-March and Its Relationship with Precipitation of China
-
摘要: 利用1979—2011年NCEP/NCAR再分析资料、我国160个站降水和气温资料,分析欧亚大陆热力变化特征,其在冬季和春季的气候变率最明显,且南北区域呈反相差异。在此基础上, 探讨1—3月欧亚大陆热力差异与中国降水异常的关系,欧亚大陆正 (负) 热力差异年,1—3月华南、西南至河套西部地区降水偏多 (少) 明显,后期夏季多雨带位于长江中下游地区 (华南地区)。大气环流异常特征显示:1—3月欧亚大陆南北热力差异与同期北极涛动 (AO)、东亚大槽、东亚高空急流等大尺度大气环流,以及后期东亚高空急流、南亚高压、低层季风风系异常的密切相关是欧亚大陆热力变化与中国降水联系的可能途径。Abstract: Seasonal changes of thermal differences between the sea and the land (land-sea thermal contrast) is a key influence factor to monsoon formation, strength change, onset and retreat. Land thermal condition significantly influences atmospheric circulation at high and low level, monsoon activities and climatic anomalies. Being the largest land of the world, effects of Eurasian continent on global climate are more complicated and important, especially considering the heat source seasonal changes of the Tibetan Plateau.Based on NCEP/NCAR reanalysis data and monthly data of 160 meteorological stations in China from 1979 to 2011, the thermal characteristics over Eurasian continent are investigated. Results show that the climatic variability of surface air temperature (SAT) displays obvious difference in different regions and seasons. The SAT variability is significantly larger in south Eurasia than that in north Eurasia, and is the biggest in winter and the weakest in summer. Temporal and spatial characteristics of SAT over Eurasian continent from January to March are emphatically investigated, and it's found thermal changes are just opposite with positive (negative) anomalies in south Eurasia and negative (positive) anomalies in south Eurasia.According to the variation characteristics of temporal coefficient of the first empirical orthogonal function (EOF-PC1), 8 positive and 8 negative thermal contrast years are chosen, and the relationship between changes of the thermal variation over Eurasian continent and precipitation in China is further studied using methods of correlation and composite analysis. Results show that this thermal contrast is not only closely connected with precipitation in China from January to March, but also connected with the precipitation in the following summer. The thermal index is shown to be positively correlated with the accumulative precipitation in South China, Southwest China and middle reaches of the Huang River from January to March, and the rainfall amount of the middle and lower reaches of the Yangtze in the late summer.Finally, possible ways of thermal anomalies from January to March associated with precipitation in China are investigated. It indicates that the thermal contrast between south Eurasia and north Eurasia is closely related with AO, the east Asian trough, and the upper level jet stream in east Asia at the same time. Besides, the south Asia high, the upper level jet stream in east Asia, and Asian monsoon are also possible linkage ways between thermal contrast and the climate of China.
-
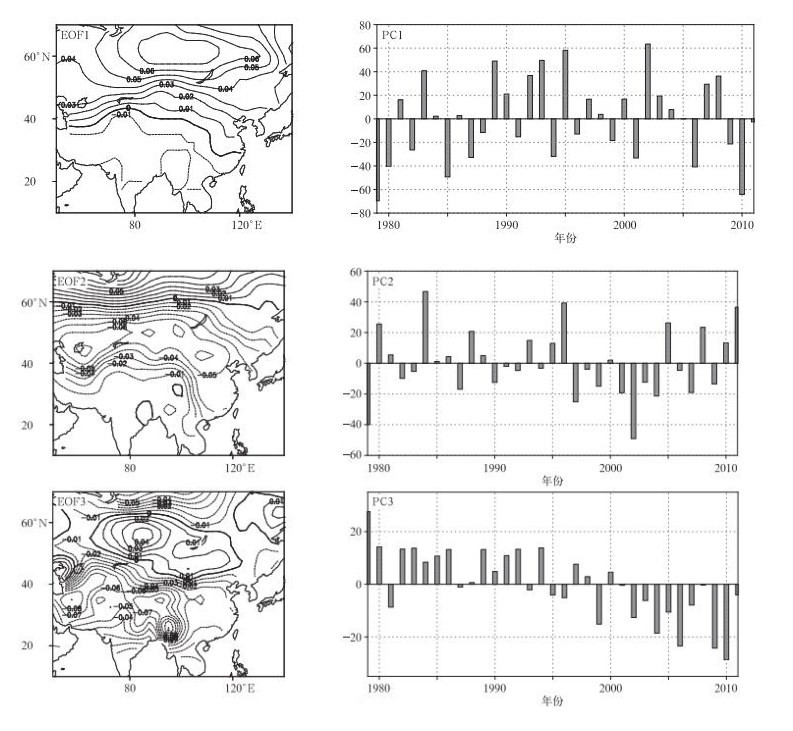
图 1 1979—2011年1—3月欧亚大陆地面气温经验正交函数分解
Fig. 1 EOF patterns of surface temperature over Eurasia and their temporal coefficient from Jan to Mar during 1979-2011
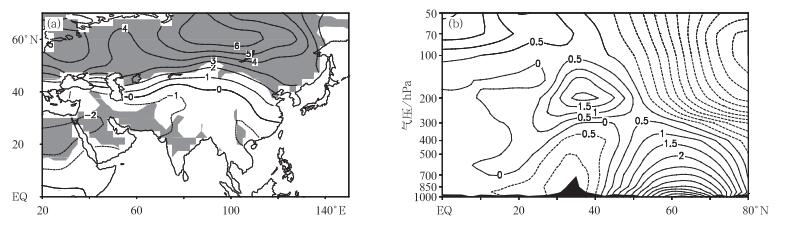
图 2 正、负位相年1—3月欧亚大陆地面气温差值 (阴影区表示达到0.05显著性水平)(a) 和沿60°~100°E的高度-纬度温度剖面差值 (b)(单位:℃)
Fig. 2 Difference distributions of surfcace air temperature (the shaded denotes passing the test of 0.05 level)(a) and high latitude temperature profile along 60°-100°E (b) between positive and negative phase years over Eurasia from Jan to Mar (unit:℃)
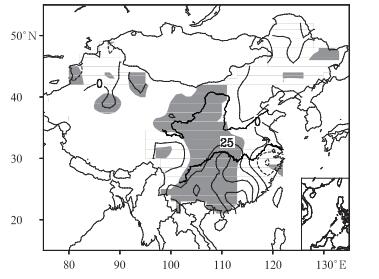
图 3 正、负位相年1—3月我国降水的差值
(单位:mm, 阴影区表示达到0.05显著性水平)
Fig. 3 The precipitation difference distribution between positive and negative phase years in China from Jan to Mar
(unit:mm, the shaded denotes passing the test of 0.05 level)

图 4 正、负位相年夏季我国降水距平及其差值分布
(单位:mm,阴影区表示达到0.05显著性水平) (a) 正位相年,(b) 负位相年,(c) 差值
Fig. 4 Precipitation anomalies respectively in positive and negative years with their difference in China from Jun to Aug
(unit:mm, the shaded denotes passing the test of 0.05 level) (a) positive years, (b) negative years, (c) difference
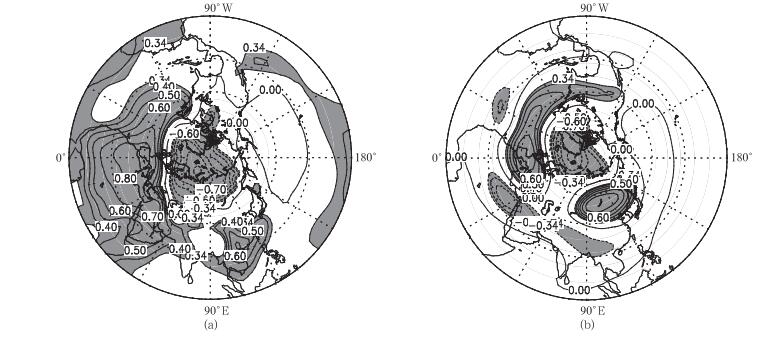
图 5 1—3月PC1与地面气压场 (a) 和500 hPa高度场 (b) 相关分布
(阴影区表示达到0.05显著性水平)
Fig. 5 Correlations of PC1 to surface level pressure and 500 hPa height from Jan to Mar
(the shaded denotes passing the test of 0.05 level) (a) surface level pressure, (b)500 hPa height

图 6 1—3月沿110°~120°E位势高度距平场的高度-纬度剖面图 (单位:dagpm)
(a) 正位相年, (b) 负位相年
Fig. 6 Height-latitude cross-section of anomalous geopotential height along 110°-120°E in positive and negative years from Jan to Mar (unit:dagpm)
(a) positive phase years, (b) negative phase years
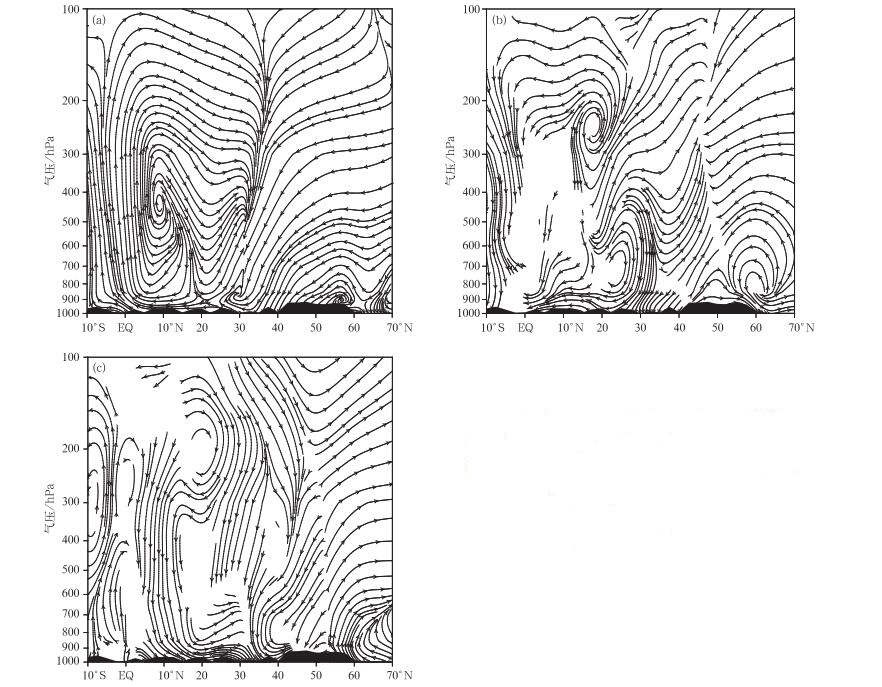
图 7 1—3月经向环流沿110°~120°E的剖面
(a) 气候平均, (b) 正位相年距平, (c) 负位相年距平
Fig. 7 Height-latitude cross-section of meridional circulation along 110°-120°E from Jan to Mar
(a) climatological mean, (b) anomaly of positive phase years, (c) anomaly of negative phase years

图 8 6—8月经向环流距平沿110°~120°E剖面
(a) 正位相年, (b) 负位相年
Fig. 8 Height-latitude cross-section of anomalous meridional circulation along 110°-120°E in positive and negative phase years from Jun to Aug
(a) positive phase years, (b) negative phase years
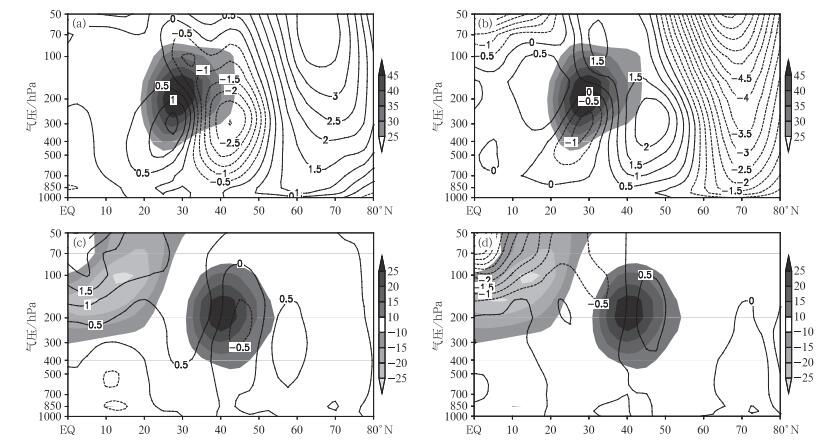
图 9 纬向风距平沿60°~120°E剖面
(单位:m·s-1, 阴影区为气候平均最大纬向风速中心位置) (a) 正位相年1—3月, (b) 负位相年1—3月, (c) 正位相年夏季, (d) 负位相年夏季
Fig. 9 Height-latitude cross-section of anomalous zonal wind along 60°-120°E
(unit:m·s-1, the shaded denotes the climatological location of the maximum zonal wind) (a) positive phase years from Jan to Mar, (b) negative phase years from Jan to Mar, (c) positive phase years from Jun to Aug, (d) negative phase years from Jun to Aug

图 10 夏季正 (实线)、负 (虚线) 位相年100 hPa南亚高压特征线 (单位:gpm) 和正、负位相年850 hPa合成风场的差值
(阴影区达到0.05显著性水平) (a)100 hPa南亚高压特征线, (b)850 hPa风场差值
Fig. 10 Characteristic lines of 100 hPa south Asia high in positive (the solid line) and negative (the dotted line) years and the difference of 850 hPa wind field between positive phase and phase negative years from Jun to Aug
(the shaded denotes passing the test of 0.05 level) (a) the characteristic line of 100 hPa south Asia high, (b) the difference of 850 hPa wind field
-
[1] 陈隆勋, 张博, 张瑛.东亚季风研究的进展.应用气象学报, 2006, 17(6):711-724. doi: 10.11898/1001-7313.20060609 [2] Liu P, Qian Y F, Huang A N.Impacts of land surface and sea surface temperature on the onset Sate of the South China Sea Summer monsoon.Adv Atmos Sci, 2009, 26(3):493-502. doi: 10.1007/s00376-009-0493-2 [3] Joshi M M, Gregory J M, Webb M J, et al.Mechanisms for the land/sea warming contrast exhibited by simulations of climate change.Climate Dyn, 2008, 30(5):455-465. doi: 10.1007/s00382-007-0306-1 [4] 陈晶华, 陈隆勋.亚洲南部的海陆分布对亚洲夏季风形成的作用.应用气象学报, 1991, 2(4):355-361. http://qikan.camscma.cn/jams/ch/reader/view_abstract.aspx?file_no=19910449&flag=1 [5] 张耀存, 钱永甫.南海季风区地面温度变化特征及其与季风爆发的联系.南京气象学院学报, 2002, 25(2):192-198. http://www.cnki.com.cn/Article/CJFDTOTAL-NJQX200202007.htm [6] 徐海明, 何金海, 温敏, 等.中南半岛影响南海夏季风建立和维持的数值研究.大气科学, 2002, 26(3):330-342. http://www.cnki.com.cn/Article/CJFDTOTAL-DQXK200203003.htm [7] 李跃凤, 丁一汇.海表温度和地表温度与中国东部夏季异常降水.气候与环境研究, 2002, 7(l):87-101. http://www.cnki.com.cn/Article/CJFDTOTAL-QHYH200201008.htm [8] 陈海山, 孙照渤, 闵锦忠.欧亚大陆冬季积雪异常与东亚冬季风及中国冬季气温的关系.南京气象学院学报, 1999, 22(4):609-615. http://www.cnki.com.cn/Article/CJFDTOTAL-NJQX199904006.htm [9] 武炳义, 苏京志, 张人禾.秋冬季节北极海冰对冬季西伯利亚高压的影响.科学通报, 2001, 56(27):2335-2343. http://www.cnki.com.cn/Article/CJFDTOTAL-KXTB201127011.htm [10] 汤懋苍, 伊建华, 蔡洁萍.冬季地温分布与春夏季降水相关的统计分析.高原气象, 1986, 5(1):40-52. http://www.cnki.com.cn/Article/CJFDTOTAL-GYQX198601004.htm [11] 汤懋苍, 王敬香, 张建.用冬季地温预报汛期降水距平的初步方法.高原气象, 1987, 6(3):244-255. http://www.cnki.com.cn/Article/CJFDTOTAL-GYQX198702005.htm [12] 汤懋苍, 赖特E R.美国低温分布与后一季降水的相关分析.高原气象, l986, 5(4):293-307. http://www.cnki.com.cn/Article/CJFDTOTAL-GYQX198604000.htm [13] Grimn A M, Paland J S, Giorgi F.Connection between spring conditions and peak summer monsoon rainfall in south America, role of soil moisture, surface temperature, and topography in Eastern Brazil.J Climate, 2007, 20:5929-5945. doi: 10.1175/2007JCLI1684.1 [14] 晏红明, 杞明辉, 肖子牛, 等.冬季亚洲大陆的热力差异对亚洲季风活动的影响.大气科学, 2005, 29(4):549-564. http://www.cnki.com.cn/Article/CJFDTOTAL-DQXK200504005.htm [15] 梁红丽, 晏红明, 肖子牛, 等.冬季亚洲大陆年际热力差异与中国气候的关系.气象科学, 2010, 30(6):754-762. http://www.cnki.com.cn/Article/CJFDTOTAL-QXKX201006003.htm [16] 金燕, 晏红明, 严华生, 等.亚欧大陆经向热力差异对亚洲季风影响的研究Ⅰ.与东亚冬季风的关系.云南大学学报:自然科学版, 2012, 34(2):177-184. http://www.cnki.com.cn/Article/CJFDTOTAL-YNDZ201202012.htm [17] 赵勇, 钱永甫.青藏高原地区地表热力异常与夏季东亚环流和江淮降水的关系.气象学报, 2009, 67(3):397-406. doi: 10.11676/qxxb2009.039 [18] Li C F, Yanai M.The onset and interannual variability of the Asian Summer Monsoon in relation to land-sea thermal contrast.J Climate, 1996, 9:358-375. doi: 10.1175/1520-0442(1996)009<0358:TOAIVO>2.0.CO;2 [19] 晏红明, 杨辉, 王灵, 等.印度半岛热力变化对亚洲季风环流异常的影响.高原气象, 2010, 29(6):1452-1463. http://cpfd.cnki.com.cn/Article/CPFDTOTAL-ZGQX201111005100.htm [20] 黄荣辉, 蔡榕硕, 陈际龙, 等.我国旱涝气候灾害的年代际变化及其与东亚气候系统变化的关系.大气科学, 2006, 30(5):730-743. http://www.cnki.com.cn/Article/CJFDTOTAL-DQXK200605001.htm [21] 唐佳, 武炳义.20世纪90年代初东亚夏季风的年代际转型.应用气象学报, 2012, 23(4):402-413. doi: 10.11898/1001-7313.20120403 [22] 袁杰, 魏凤英, 巩远发, 等.关键区海温年代际异常对我国东部夏季降水影响.应用气象学报, 2013, 24(3):268-277. doi: 10.11898/1001-7313.20130302 [23] 李维京, 李怡, 陈丽娟, 等.我国冬季气温与影响因子关系的年代际变化.应用气象学报, 2013, 24(4):385-396. doi: 10.11898/1001-7313.20130401 [24] Kalnay E, Kanamitsu M, Kistler R, et al.The NCEP/NCAR 40-year reanalysis project.Bull Amer Meteor Soc, 1996, 77:437-471. doi: 10.1175/1520-0477(1996)077<0437:TNYRP>2.0.CO;2 [25] 沈学顺, 木本昌秀.春季欧亚大陆地表气温变化特征的气候意义.大气科学, 2007, 31(1):19-27. http://www.cnki.com.cn/Article/CJFDTOTAL-DQXK200701001.htm [26] 郑旭程, 陈海山.全球春、夏陆面热力状况变化特征:NCEP/NCAR与ERA40再分析资料的比较.大气科学学报, 2012, 35(1):41-50. http://www.cnki.com.cn/Article/CJFDTOTAL-NJQX201201004.htm [27] Li J P, Wang J X.A modified zonal index and its physical sense.Geophy Res Lett, 2003, 30(12), 1632, doi: 10.1029/2003GL017441. [28] Wu B, Wang J.Winter Arctic Oscillation, Siberian high and East Asian winter monsoon.Geophys Res Lett, 2002, 29(19), 1897, doi: 10.1029/2002GL015373. [29] 陈文, 康丽华.北极涛动与东亚冬季气候在年际尺度上的联系:准足常行星波的作用.大气科学, 2006, 30(5):863-870. http://www.cnki.com.cn/Article/CJFDTOTAL-DQXK200605014.htm [30] 程建刚, 晏红明, 解明恩, 等.云南重大气候灾害变化特征和成因分析.北京:气象出版社, 2009. [31] 晏红明, 梁红丽, 金燕, 等.冬季欧亚大陆热力变化特征及其与大气环流变化的关系.大气科学学报, 2015, 38(5):577-587. http://www.cnki.com.cn/Article/CJFDTOTAL-NJQX201505001.htm [32] Yang S, Lau K M, Yoo S H, et al.Upstream subtropical signals preceding the Asian summer monsoon circulation.J Climate, 2004, 17:4213-4229. doi: 10.1175/JCLI3192.1 [33] 张白银, 龚道溢, 郭栋, 等.我国南方冬季异常低温和异常降水事件分析.地理学报, 2008, 63(9):899-912. doi: 10.11821/xb200809001 [34] Liang X Z, Wang W C.Associate between China monsoon rainfall and tropospheric jet.J Roy Meteor Soc, 1998, 124:2597-2623. doi: 10.1002/(ISSN)1477-870X [35] 龚道溢, 朱锦红, 王绍武.长江流域夏季降水与前期北极涛动的显著相关.科学通报, 2002, 47(7):546-549. http://www.cnki.com.cn/Article/CJFDTOTAL-KXTB200207014.htm [36] 魏维, 张人禾, 温敏.南亚高压的南北偏移与我国夏季降水的关系.应用气象学报, 2012, 23(6):650-659. doi: 10.11898/1001-7313.20120602 -

 下载:
下载:
计量
- 摘要浏览量: 2675
- HTML全文浏览量: 1228
- PDF下载量: 506
- 被引次数: 0
