Characteristics of Raindrop Falling Process at the Mount Huang
-
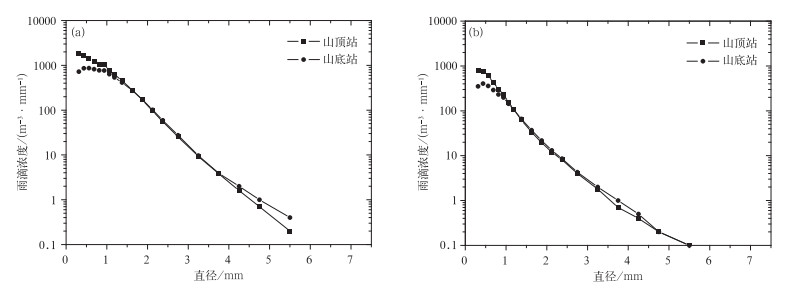
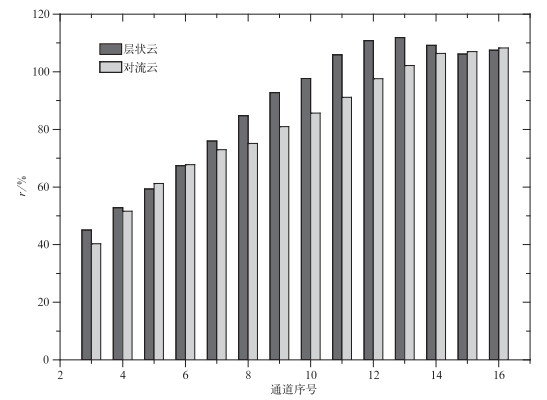
摘要: 利用2011—2012年4—10月安徽省黄山山顶和山底两个站点同时采集的雨滴谱数据,共选取17个降水个例,将17个降水个例分为对流云降水和层云降水,对不同高度和不同云系降水雨滴谱特征分析得出以下结论:对于不同云系的降水,山顶平均雨滴数浓度大于山底,平均峰值直径和平均质量半数直径在下落过程中均增加,平均雨强和平均雷达反射率因子变化幅度较小。不同云系的雨滴在下落过程中,雨滴谱谱宽变化较小,但雨滴谱均从M-P (Marshall-Palmer) 分布转向了Gamma分布。降水粒子在下落过程中,大部分通道的数浓度均出现损失,最大损失超过50%,随着粒子尺度增加损失逐渐减少,大粒子数浓度在降落时有所增加,增加幅度为10%左右,降水粒子的碰并和蒸发过程很可能是造成降水粒子下落过程中滴谱变化的两个主要原因。Abstract: Utilizing raindrop spectrum data recorded by PARSIVEL of April-Octomber from 2011 to 2012 at the top and foot of the Mount Huang, 17 precipitation cases are collected, which divided into convective cloud precipitation and stratiform cloud precipitation. Characteristics of raindrop spectrum in different height and cloud from 17 precipitation cases are analyzed.Observed results show that the average concentration of raindrops at the top of the mountain is higher than that at the foot of the mountain in both convective cloud and stratiform cloud precipitation, the average peak diameter and the average mass median diameter both increase during falling process, but average intensity and radar reflectivity both have a smaller change. Neither convective cloud nor stratiform cloud raindrop spectrum distribution broadens from top to foot of the Mount Huang, but the spectrum shapes of raindrop change from M-P (Marshall-Palmer) to Gamma. Raindrop loses at most bins when falling from top to foot of the mountain, the maximum loss appears at the third bin of raindrop spectrum, with the loss percentage exceeding 50%. The concentration of bigger raindrop of stratiform cloud begins at the 11th bin (with feature diameter of 1.375 mm) and convective cloud raindrop begin at the 13th bin (with feature diameter of 1.875 mm) increase during falling process. The increase amplitude is lower than 10% except the 12th bin (with features diameter of 1.625 mm) and the 13th bin of stratiform cloud raindrop, and the increase at these two bins are 10.8% and 11.9%, respectively. Evaporation accompanies with the whole falling process, which has bigger effects on small raindrops than big ones, leading to lower concentration of smaller raindrop at the foot of the mountain. These losses gradually reduce along with raindrop diameter increasing due to effects of coagulation process of raindrop become stronger along with raindrop diameter increasing. Therefore, these changes occurring during falling process may be caused by both evaporation and coagulation process of raindrop.
-
Key words:
- raindrop spectrum;
- the Mount Huang;
- convective cloud;
- stratiform cloud
-
表 1 雨滴谱仪通道直径
Table 1 Bin diameter of PARSIVEL
通道 特征直径/mm 3 0.312 4 0.437 5 0.562 6 0.687 7 0.812 8 0.937 9 1.062 10 1.187 11 1.375 12 1.625 13 1.875 14 2.125 15 2.375 16 2.75 17 3.25 18 3.75 19 4.25 20 4.75 21 5.5 22 6.5 23 7.5 24 8.5 表 2 采样时间及时长
Table 2 Time and duration of sample
采样序号 采样起始时间 采样终止时间 时长/min 1 2011-06-13T22:00 2011-06-15T18:59 2700 2 2011-06-24T15:00 2011-06-26T02:00 2100 3 2011-08-03T05:01 2011-08-03T09:00 240 4 2011-08-07T02:01 2011-08-07T16:00 840 5 2011-08-09T16:00 2011-08-09T19:59 240 6 2011-08-10T21:00 2011-08-12T09:59 2220 7 2011-08-29T12:01 2011-08-31T14:00 3000 8 2011-09-17T14:00 2011-09-18T02:59 780 9 2011-10-24T01:00 2011-10-24T23:59 1380 10 2012-04-20T10:00 2012-04-21T09:59 1440 11 2012-04-23T21:00 2012-04-25T06:59 2040 12 2012-05-07T20:01 2012-05-08T12:00 960 13 2012-05-12T15:01 2012-05-13T07:00 960 14 2012-05-23T00:00 2012-05-26T08:59 4860 15 2012-06-10T19:00 2012-06-11T07:59 780 16 2012-06-17T07:00 2012-06-18T13:59 1860 17 2012-06-25T15:00 2012-06-28T04:59 3730 表 3 不同站点及不同云型的云降水物理参量
Table 3 Cloud and precipitation parameters at diffirent sites and cloud types
站点 云型 样本量 平均数
浓度/m-3平均雨强/
(mm·h-1)平均含水量/
(g·kg-1)平均反射率
因子/dBZ平均峰值
直径/mm平均质量半数
直径/mm山顶站 对流云 912 1482 19.5 1.12 40.0 0.50 0.88 山底站 对流云 897 1024 21.4 0.96 39.6 0.70 1.00 山顶站 层云 19122 422 1.6 0.097 18.9 0.55 0.66 山底站 层云 17017 269 1.7 0.09 19.6 0.64 0.72 -
[1] Maki M, Keenan T D, Sasaki Y, et al.Characteristics of the raindrop size distribution in tropical continental squall lines observed in Darwin, Australia.J Appl Meteor, 2001, 40(8):1393-1412. doi: 10.1175/1520-0450(2001)040<1393:COTRSD>2.0.CO;2 [2] Bringi V N, Chandrasekar V, Hubbert J, et al.Raindrop size distribution in different climatic regimes from disdrometer and dual-polarized radar analysis.J Atmos Sci, 2003, 60(2):354-365. doi: 10.1175/1520-0469(2003)060<0354:RSDIDC>2.0.CO;2 [3] Caracciolo C, Prodi F, Battaglia A, et al.Analysis of the moments and parameters of a gamma DSD to infer precipitation properties:A convective stratiform discrimination algorithm.Atmos Res, 2006, 80(2):165-186. http://adsabs.harvard.edu/abs/2006AtmRe..80..165C [4] Chu Y H, Su C L.An investigation of the slope-shape relation for Gamma raindrop size distribution.Journal of Applied Meteorology and Climatology, 2008, 47(10):2531-2544. doi: 10.1175/2008JAMC1755.1 [5] Kirankumar N V P, Rao T N, Radhakrishna B, et al.Statistical characteristics of raindrop size distribution in southwest monsoon season.Journal of Applied Meteorology and Climatology, 2008, 47(2):576-590. doi: 10.1175/2007JAMC1610.1 [6] Brown P S.Coalescence and breakup-induced oscillations in the evolution of the raindrop size distribution.J Atmos Sci, 1989, 46(9):1186-1192. doi: 10.1175/1520-0469(1989)046<1186:CABIOI>2.0.CO;2 [7] Hu Z, Srivastava R C.Evolution of raindrop size distribution by coalescence, breakup, and evaporation:Theory and observations.J Atmos Sci, 1995, 52(10):1761-1783. doi: 10.1175/1520-0469(1995)052<1761:EORSDB>2.0.CO;2 [8] Martinez D, Gori E G.Raindrop size distributions in convective clouds over Cuba.Atmos Res, 1999, 52(3):221-239. doi: 10.1016/S0169-8095(99)00020-4 [9] Tokay A, Bashor P G, Habib E, et al.Raindrop size distribution measurements in tropical cyclones.Mon Wea Rev, 2008, 136(5):1669-1685. doi: 10.1175/2007MWR2122.1 [10] 何越, 何平, 林晓萌.基于双高斯拟合的风廓线雷达反演雨滴谱.应用气象学报, 2014, 25(5):570-580. doi: 10.11898/1001-7313.20140506 [11] 严采蘩, 陈万奎.对流层下部雨滴谱分布.应用气象学报, 1990, 1(2):191-197. http://qikan.camscma.cn/jams/ch/reader/view_abstract.aspx?file_no=19900227&flag=1 [12] 安英玉, 金凤岭, 张云峰, 等.地面雨滴谱观测的图像自动识别方法.应用气象学报, 2008, 19(2):188-193. doi: 10.11898/1001-7313.20080234 [13] 柳臣中, 周筠臖, 谷娟, 等.成都地区雨滴谱特征.应用气象学报, 2015, 26(1):112-121. http://qikan.camscma.cn/jams/ch/reader/view_abstract.aspx?file_no=20150112&flag=1 [14] 金祺, 袁野, 纪雷, 等.安徽滁州夏季一次飑线过程的雨滴谱特征.应用气象学报, 2015, 26(6):725-734. doi: 10.11898/1001-7313.20150609 [15] 李淘, 阮征, 葛润生, 等.激光雨滴谱仪测速误差对雨滴谱分布的影响.应用气象学报, 2016, 27(1):25-34. doi: 10.11898/1001-7313.20160103 [16] 吴兑.关于雨滴在云下蒸发的数值试验.气象学报, 1990, 49(1):116-121. http://www.cnki.com.cn/Article/CJFDTOTAL-QXXB199101017.htm [17] 宫福久, 刘吉成, 李子华.三类降水云雨滴谱特征研究.大气科学, 1997, 21(5):607-614. http://www.cnki.com.cn/Article/CJFDTOTAL-NJQX201402010.htm [18] 刘红燕, 雷恒池.基于地面雨滴谱资料分析层状云和对流云降水的特征.大气科学, 2006, 30(4):693-702. http://www.cnki.com.cn/Article/CJFDTOTAL-DQXK200604013.htm [19] 张昊, 濮江平, 李靖, 等.庐山地区不同海拔高度降水雨滴谱特征分析.气象与减灾研究, 2011, 34(2):43-50. http://www.cnki.com.cn/Article/CJFDTOTAL-HXQO201102006.htm [20] 濮江平, 赵国强, 蔡定军, 等.Parsivel激光降水粒子谱仪及其在气象领域的应用.气象与环境科学, 2007, 30(2):3-8. http://www.cnki.com.cn/Article/CJFDTOTAL-HNQX200702000.htm [21] Chen B, Yang J, Pu J.Statistical characteristics of raindrop size distribution in the Meiyu season observed in eastern China.J Meteor Soc Japan, Ser:Ⅱ, 2013, 91(2):215-227. doi: 10.2151/jmsj.2013-208 [22] Testud J, Oury S, Black R A, et al.The concept of "normalized" distribution to describe raindrop spectra:A tool for cloud Physics and cloud remote sensing.J Applied Meteor, 2001, 40(6):1118-1140. doi: 10.1175/1520-0450(2001)040<1118:TCONDT>2.0.CO;2 [23] Marzano F S, Cimini D, Montopoli M.Investigating precipitation microphysics using ground-based microwave remote sensors and disdrometer data.Atmos Res, 2010, 97(4):583-600. doi: 10.1016/j.atmosres.2010.03.019 -


 设为首页
设为首页 加入收藏
加入收藏


 下载:
下载:

