Correction of TRMM Monthly Precipitation Data from 1998 to 2013 in Xinjiang
-
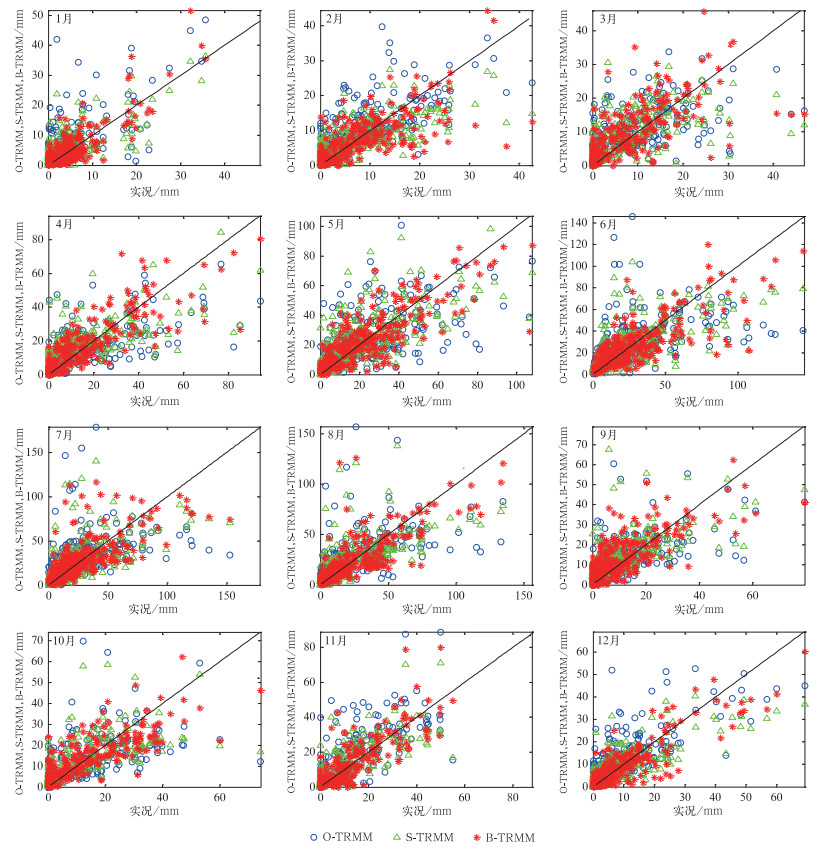
摘要: 利用1998-2013年TRMM月降水量产品与新疆同期的105个气象站地面观测降水量,运用逐步回归与BP神经网络方法,选取1998-2010年数据建立新疆地区的降水订正模型,并利用2011-2013年月降水量进行检验。结果表明:加入地形因子对TRMM月降水量产品订正效果明显,整体上两种模型对TRMM月降水量产品订正的相关系数从最初的0.66分别提高到0.75和0.80,相对误差由10.75%分别降低为4.88%和3.19%;月尺度上,TRMM月降水量产品相对误差为-5.68%~54.44%,经逐步回归模型订正后为-4.26%~32.57%,而BP神经网络模型订正后为-5.33%~24.48%,表明BP神经网络模型订正效果更好;从综合时间技巧评分ST看,订正后TRMM月降水量产品在各月的效果均有不同程度提高,逐步回归模型订正后提高0.01~0.49,BP神经网络模型订正后提高0.03~0.70。因此,基于逐步回归模型与BP神经网络模型订正的TRMM降水量产品均能够准确、定量地再现降水分布,为TRMM降水量产品质量改进提供一种较实用的参考方法。Abstract: Using monthly TRMM precipitation data and precipitation observations from 105 national basic weather stations in Xinjiang region from 1998 to 2013, a stepwise regression model and a back-propagation (BP) neural network are established to correct TRMM precipitation. Results show that models added with geographical factors can increase the accuracy of TRMM precipitation effectively. Corrected by two models, overall correlation coefficients are 0.75 and 0.80, and relative errors are 4.88% and 3.19%. On the monthly scale, the relative error of TRMM monthly precipitation ranges from-5.68% to 54.44%, from-4.26% to 32.57% after stepwise regression and from 5.33% to 24.48% after neural network, respectively. In addition, results show that qualities of satellite precipitation products are improved in different degrees from ST, with 0.01-0.49 for stepwise regression model and 0.03-0.70 for neural network, respectively. Compared with TRMM data before correction, the stepwise regression model and BP neural network model can accurately and quantitatively reproduce the actual distribution of precipitation, and provide a more practical method for the area lack of precipitation data.
-
Key words:
- TRMM;
- precipitation;
- Xinjiang;
- correction
-
表 1 O-TRMM,S-TRMM,B-TRMM相关系数及平均值统计
Table 1 The correlation coefficient and the mean of O-TRMM, S-TRMM, B-TRMM rain gauge monthly rainfall in different months
月份 与实况相关系数 平均值/mm O-TRMM S-TRMM B-TRMM 实况 O-TRMM S-TRMM B-TRMM 1 0.68 0.74 0.86 4.13 6.39 4.57 4.69 2 0.73 0.73 0.79 7.11 9.01 6.80 6.73 3 0.65 0.64 0.70 6.68 7.70 7.53 7.44 4 0.69 0.74 0.84 12.65 11.93 14.11 13.84 5 0.63 0.71 0.80 21.46 21.2 22.54 22.23 6 0.49 0.66 0.76 27.06 27.88 26.09 26.06 7 0.45 0.63 0.73 26.36 29.59 27.27 26.35 8 0.56 0.70 0.83 22.86 25.11 23.12 22.64 9 0.59 0.68 0.76 9.40 11.28 12.46 11.70 10 0.65 0.71 0.82 10.18 9.79 10.68 10.40 11 0.77 0.80 0.85 9.46 12.67 10.40 10.22 12 0.77 0.80 0.88 8.23 10.61 7.92 7.84 注:相关系数均达到0.01的显著性水平。 表 2 O-TRMM,S-TRMM,B-TRMM与实况的误差及综合评分统计
Table 2 The error and the overall score of O-TRMM, S-TRMM, B-TRMM to rain gauge monthly rainfall in different months
月份 相对误差/% 均方根误差/mm ST O-TRMM S-TRMM B-TRMM O-TRMM S-TRMM B-TRMM O-TRMM S-TRMM B-TRMM 1 54.44 10.41 13.37 2.63 1.90 1.50 -0.03 0.46 0.67 2 26.72 -4.26 -5.33 2.54 2.33 2.13 0.44 0.53 0.61 3 15.40 12.75 11.39 2.89 2.87 2.83 0.36 0.37 0.39 4 -5.68 11.51 9.41 5.41 5.00 4.07 0.47 0.55 0.70 5 -1.23 5.06 3.57 7.21 6.44 5.46 0.35 0.48 0.62 6 3.05 -3.57 -3.69 10.06 8.30 7.12 0.14 0.41 0.57 7 12.24 3.43 -0.05 11.03 8.98 7.88 -0.02 0.32 0.48 8 9.85 1.11 -0.98 9.86 7.96 6.03 0.18 0.46 0.70 9 19.98 32.57 24.48 4.60 4.20 3.63 0.23 0.36 0.52 10 -3.84 4.92 2.11 4.43 4.04 3.25 0.39 0.50 0.67 11 34.00 9.98 8.10 4.41 3.44 3.12 0.33 0.59 0.66 12 28.93 -3.81 -4.69 3.33 2.91 2.33 0.52 0.64 0.77 -
[1] 刘元波, 傅巧妮, 宋平, 等.卫星遥感反演降水研究综述.地球科学进展, 2011, 26(11):1162-1172. http://www.cnki.com.cn/Article/CJFDTOTAL-DXJZ201111008.htm [2] 王新, 郭强, 陈怡羽.FY-2E资料空间响应订正及对强对流监测改进.应用气象学报, 2016, 27(1):102-111. doi: 10.11898/1001-7313.20160111 [3] Huffman G J, Bolvin D T, Nelkin E J, et al.The TRMM multi-satellite precipitation analysis (TMPA):Quasi-global, multiyear, combined-sensor precipitation estimates at fine scales.Journal of Hydrometeorology, 2007, 8(1):38-55. doi: 10.1175/JHM560.1 [4] 李嘉睿, 卢乃锰, 谷松岩.青藏高原地区TRMM PR地面降雨率的修正.应用气象学报, 2015, 26(5):636-640. doi: 10.11898/1001-7313.20150513 [5] Moazami S, Golian S, Kavianpour M R, et al.Comparison of PERSIANN and V7 TRMM Multi-satellite Precipitation Analysis (TMPA) products with rain gauge data over Iran.Int J Remote Sens, 2013, 34(22):8156-8171. doi: 10.1080/01431161.2013.833360 [6] Karaseva M O, Prakash S, Gairola R M.Validation of high-resolution TRMM-3B43 precipitation product using rain gauge measurements over Kyrgyzstan.Theor Appl Climatol, 2012, 108:147-157. doi: 10.1007/s00704-011-0509-6 [7] 陈廷娣, 王连仲, 窦贤康.TRMM卫星与机载雷达在降雨反演中的数据对比个例研究.应用气象学报, 2008, 19(4):454-462. doi: 10.11898/1001-7313.20080409 [8] 彭亮, 姚展予.河南省非降水云中液态水的卫星微波反演试验研究.应用气象学报, 2008, 19(5):539-546. doi: 10.11898/1001-7313.20080504 [9] 吕洋, 杨胜天, 蔡明勇, 等. TRMM卫星降水数据在雅鲁藏布江流域的适用性分析.自然资源学报, 2013, 28(8):1414-1425. doi: 10.11849/zrzyxb.2013.08.014 [10] 戴建华, 秦虹, 郑杰.用TRMM/LIS资料分析长江三角洲地区的闪电活动.应用气象学报, 2005, 16(6):728-736. doi: 10.11898/1001-7313.20050613 [11] 杨艳芬, 罗毅.中国西北干旱区TRMM遥感降水探测能力初步评价.干旱区地理, 2013, 36(3):371-382. http://www.cnki.com.cn/Article/CJFDTOTAL-GHDL201303002.htm [12] 孙靖, 程光光, 张小玲.一种改进的数值预报降水偏差订正方法及应用.应用气象学报, 2015, 26(2):173-184. doi: 10.11898/1001-7313.20150205 [13] 梁胜华, 张灵, 千怀遂, 等.广东省北江流域坡向与海拔对汛期降水量的影响.应用气象学报, 2015, 26(3):338-345. doi: 10.11898/1001-7313.20150309 [14] 傅抱璞.地形和海拔高度对降水的影响.地理学报, 1992, 47(4):302-314. http://www.cnki.com.cn/Article/CJFDTOTAL-DLXB199204001.htm [15] 舒守娟, 喻自凤, 王元, 等.西藏地区复杂地形下的降水空间分布估算模型.地球物理学报, 2005, 48(3):535-542. http://www.cnki.com.cn/Article/CJFDTOTAL-DQWX200503009.htm [16] 胡邦辉, 刘善亮, 席岩, 等.一种Bayes降水概率预报的最优子集算法.应用气象学报, 2015, 26(2):185-192. doi: 10.11898/1001-7313.20150206 [17] 舒守娟, 王元, 熊安元.中国区域地理、地形因子对降水分布影响的估算和分析.地球物理学报, 2007, 50(6):1703-1712. http://www.cnki.com.cn/Article/CJFDTOTAL-DQWX200706011.htm [18] George J H, David T B.TRMM and Other Data Precipitation Data Set Documentation.2013.ftp://recip.gsfc.nasa.gov/pub/trmmdocs/3B42_3B43_doc.pdf. [19] 江志红, 卢尧, 丁裕国.基于时空结构指标的中国融合降水资料质量评估.气象学报, 2013, 71(5):891-900. doi: 10.11676/qxxb2013.076 -


 设为首页
设为首页 加入收藏
加入收藏


 下载:
下载:
