Assessment of Solar Energy Resource and Its Exploitation Potential in South China
-
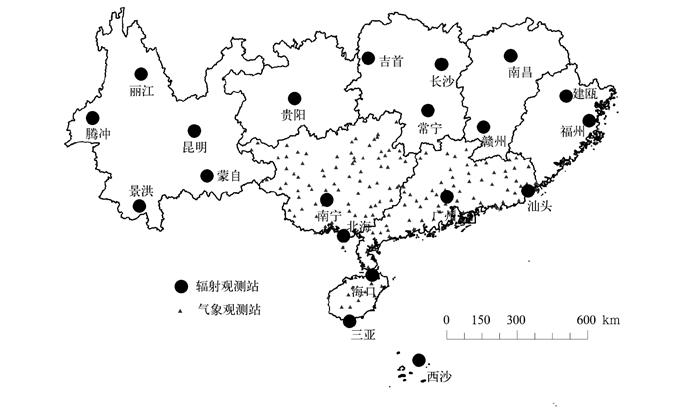
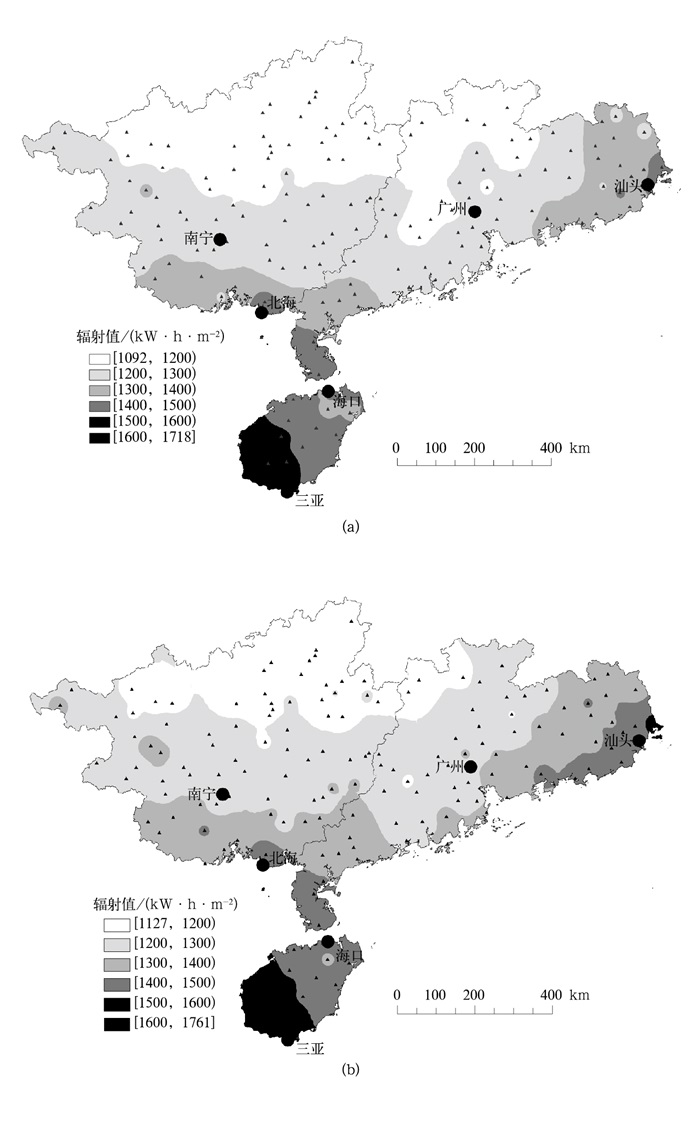
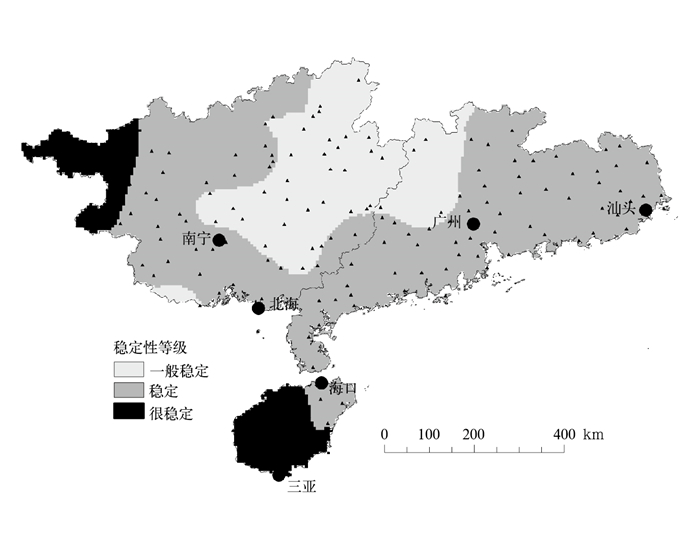
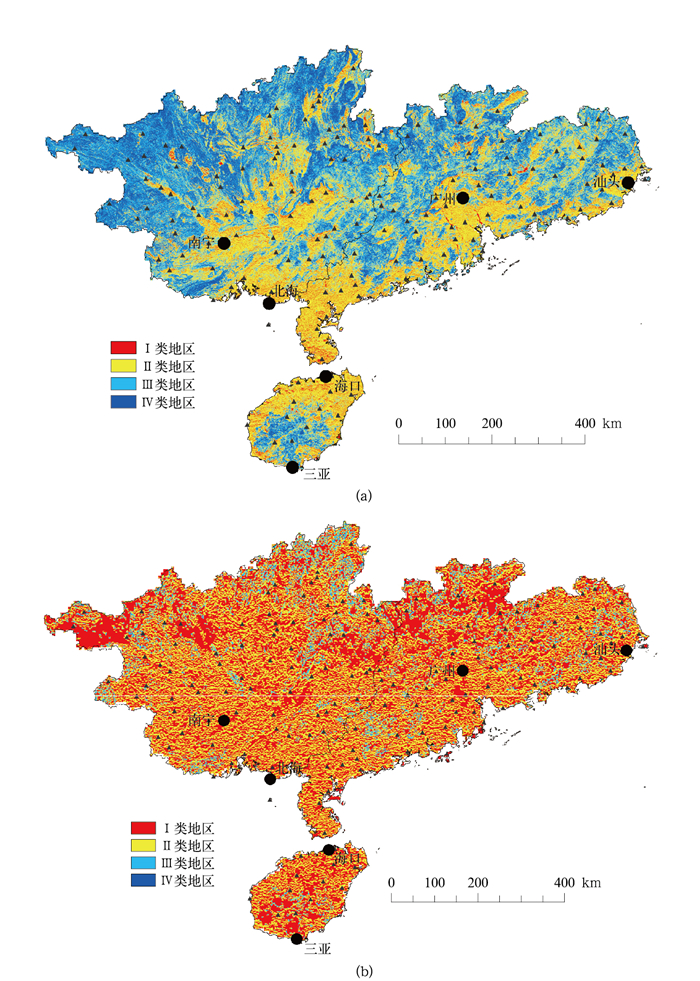
摘要: 利用华南地区观测站1981—2010年的总曝辐量数据及日照时数数据,对该地区太阳能资源的丰富程度和稳定程度进行评估。结果表明:华南地区总体太阳能资源价值呈现为海南最高,广东其次,广西最低。华南地区最佳倾斜面太阳总辐射年曝辐量为1291 kW·h·m-2,比水平面高3%,总体处于资源丰富等级以上。稳定度评估结果表明:华南地区大部分面积处于稳定等级以上,其中海南2/3以上的面积处于很稳定的等级。结合地形数据和土地覆盖数据,分别以90 m×90 m和1 km×1 km的分辨率对华南地区太阳能资源的开发适宜性进行区划和可利用潜力进行分析,结果显示:90 m×90 m分辨率下可开发利用的Ⅰ,Ⅱ,Ⅲ类地区的面积占华南地区总面积的80%以上,但其中裸地和灌木、草地仅占总面积的13.9%,而耕地和林地所占面积比例超过60%。受数据分辨率及获取年代差异的影响,1 km×1 km分辨率下太阳能开发适宜性区划结果与90 m×90 m分辨率的结果不尽相同,从而导致开发潜力也存在较大差异,在制定太阳能开发规划时应根据实际工程规模选择合理的数据。Abstract: Based on the exposure radiation data and sunshine hourly data of 156 standard meteorological observatories in south China during 1981-2010, temporal and spatial distribution of solar energy resource in south China is evaluated. Results show that the annual irradiation on optimal inclined plane is 1291 kW·h·m-2, 3% higher than that on the horizontal plane. The distribution of solar energy in Guangxi and Guangdong increases as the latitude decreases, whereas it appears as high in the west and low in the east of Hainan. The stability of solar energy resource in most area of south China is at stable level except the eastern Guangxi and the northwest corner of Guangdong. Hainan's solar energy resource stability is the highest: Larger than 2/3 of its area is at very stable level and only a few parts of eastern Hainan is at stable level. Combined with terrain data and land cover data, the exploitation suitability and potential usability of solar energy resource in south China are divided and analyzed with the resolution of 90 m×90 m and 1 km×1 km. Under the resolution of 90 m×90 m, solar energy exploitation suitability zoning results show that the area of class Ⅰ, Ⅱ and Ⅲ account for more than 80% of the total area in south China (occupying 22.1%, 32.4%, 26.7%, respectively), and their proportions of solar energy are slightly higher than their proportions of area. Solar energy exploitation potential results show that bare land and shrub-grass area accounts for only 13.9% of the total area in Ⅰ, Ⅱ and Ⅲ classes. While cultivated land (34.8%) and forest land (29.2%) are the largest two land cover types in these three usable regions. In the actual exploitation and application project, besides to give priority to using bare land and shrub-grass area, cultivated land and forest land should not be abandoned directly. Under the principle of no changing land use properties of cultivated land and forest land and no sacrificing the vegetation coverage, solar energy resource should be rationally exploited in these areas. Suitability zoning results derived from data with 1 km×1 km resolution are not the same with that using data with 90 m×90 m resolution, then make statistical results of exploitation potential different. Results mainly affected by the difference of the resolution of terrain data and the acquisition time of land cover data. While making solar energy development plan, reasonable data should be chosen according to the size of actual project.
-
Key words:
- radiation;
- suitability zoning;
- exploitation potential;
- topography;
- land cover
-
表 1 数据来源与说明
Table 1 Data source and instruction
分辨率 数据名称 数据来源 90 m×90 m 日照百分率 中国气象局风能太阳能资源中心 SRTM DEM、坡度、坡向数据 地理空间数据云① GLC2009土地覆盖数据 欧洲太空总局② 1 km×1 km 日照百分率 中国气象局风能太阳能资源中心 中国1 km DEM数据集 寒区旱区科学数据中心③ GLC2000土地覆盖数据 寒区旱区科学数据中心 表 2 2015年华南地区辐射观测站水平面总辐射计算结果及检验
Table 2 Calculation results and examinations of horizontal total radiation of radiation stations in south China in 2015
站名 实测值/(kW·h·m-2) 计算值/(kW·h·m-2) 绝对误差/(kW·h·m-2) 相对误差/% 汕头 1497.5 1395.6 -101.9 -6.8 广州 1293.6 1166.5 -127.1 -9.8 南宁 1267.5 1223.6 -43.9 -3.5 北海 1436.0 1425.8 -10.2 -0.7 海口 1564.5 1559.2 -5.3 -0.3 三亚 1740.0 1638.8 -101.2 -5.8 表 3 依据坡度、坡向划分的太阳能开发适宜性划分标准
Table 3 The division standard of solar energy exploitation suitability based on slope and aspect
坡向 坡度 [0°, 5°) [5°, 8°) [8°, 15°) [15°, 25°) [25°, 90°) 偏南
[135°, 225°]Ⅰ Ⅰ Ⅱ Ⅲ Ⅳ 偏东南/偏西南
[90°, 135°)或(225°,270°]Ⅰ Ⅱ Ⅱ Ⅲ Ⅳ 偏东北/偏西北
[45°, 90°)或(270°, 315°]Ⅱ Ⅲ Ⅲ Ⅳ Ⅳ 偏北
[0°, 45°)或(315°, 360°]Ⅱ Ⅲ Ⅲ Ⅳ Ⅳ 注:0°为正北,90°为正东,180°为正南,270°为正西。 表 4 华南地区太阳能开发适宜性分区统计
Table 4 Partition statistics of solar energy exploitation suitability in south China
统计量 分辨率 Ⅰ类地区 Ⅱ类地区 Ⅲ类地区 Ⅳ类地区 占地面积/km2 90 m×90 m 100048 146380 120631 84938 1 km×1 km 242697 181998 26848 454 面积比例/% 90 m×90 m 22.1 32.4 26.7 18.8 1 km×1 km 53.1 40.3 6.1 0.1 年平均平面辐射/
(kW·h·m-2)90 m×90 m 1276 1262 1229 1210 1 km×1 km 1254 1256 1223 1196 年平均最佳斜面辐射/
(kW·h·m-2)90 m×90 m 1313 1300 1267 1246 1 km×1 km 1291 1293 1261 1230 占辐射总量百分比/% 90 m×90 m 22.6 32.9 26.3 18.2 1 km×1 km 53.7 40.3 5.9 0.1 表 5 土地利用类型划分与GLC土地覆盖数据分类的对应性
Table 5 Correspondence of land use type classification in this paper and the GLC data
序号 土地覆盖类型 包含的GLC中的土地覆盖类型 1 耕地 农业用地,水田*、旱地*、农林交错带* 2 林地 常绿和落叶森林、退化森林,常绿和落叶森林* 3 灌木或草地 灌木**、草地和稀疏植被** 4 水域或湿地 海域、河流湖泊、冰川湿地,水域*、湿地*、冰雪覆盖区* 5 城镇用地 人类活动相关地区**、城市** 6 裸地 裸岩、沙漠,裸地或未利用地* 注:*为GLC2000数据源中的土地覆盖类型,**为两种数据源中都含有的土地覆盖类型,其余为GLC2009数据源中的土地覆盖类型。 表 6 各级开发适宜区的下垫面类型所占面积比例(单位:%)
Table 6 Area proportion of different underlying surface types in different suitability zones(unit: %)
开发适宜区 分辨率 下垫面类型所占面积比例/% 耕地 林地 灌木或草地 水域或湿地 城镇用地 裸地 Ⅰ类地区 90 m×90 m 60.4 19.6 11.7 2.8 4.4 1.1 1 km×1 km 17.9 45.1 34.6 2.1 0.3 Ⅱ类地区 90 m×90 m 46.8 31.1 15.2 1.3 3.5 2.1 1 km×1 km 19.6 40.7 36.7 2.7 0.3 Ⅲ类地区 90 m×90 m 23.5 55.2 19.4 0.3 0.4 1.2 1 km×1 km 5.0 67.0 27.8 0.1 0.1 Ⅳ类地区 90 m×90 m 15.5 62.6 20.1 0.1 0.1 0.6 1 km×1 km 2.0 78.0 20.0 0.0 0 表 7 90 m×90 m分辨率下可开发地区内各下垫面类型占地面积比例和资源比例
Table 7 Area and resource proportion of different underlying surface types in suitable for utilization zones with resolution of 90 m×90 m
地区 土地覆盖类型 占地面积/km2 面积比例/% 资源比例/% 可开发利用地区(Ⅰ, Ⅱ, Ⅲ) 耕地 1572845 34.8 35.1 林地 131723 29.2 29.4 灌木或草地 57358 12.7 12.8 水域或湿地 5066 1.1 1.2 城镇用地 99078 2.2 2.2 裸地 5622 1.2 1.2 不可利用地区(Ⅳ) 84938 18.8 18.2 -
[1] Power H C, Mills D M.Solar radiation climate change over Southern Africa and an assessment of the radiative impact of volcanic eruptions.International Journal of Climatology, 2005, 25(3):295-318. doi: 10.1002/(ISSN)1097-0088 [2] Wild M, Gilgen H, Roesch A, et al.From dimming to brightening:Decadal changes in solar radiation at Earth's surface.Science, 2005, 308(5723):847-850. doi: 10.1126/science.1103215 [3] Stanhill G, Cohen S.Solar radiation changes in the United States during the twentieth century:Evidence from sunshine duration measurements.J Climate, 2005, 18(15):1503-1512. [4] 李柯, 何凡能.中国陆地太阳能资源开发潜力区域分析.地理科学进展, 2010, 29(9):1049-1054. doi: 10.11820/dlkxjz.2010.09.004 [5] 沈义. 我国太阳能的空间分布及地区开发利用综合潜力评价. 兰州: 兰州大学, 2014. [6] 郑有飞, 关福来, 蔡子颖, 等.我国南方中东部地区地面太阳总辐射变化规律.应用气象学报, 2011, 22(3):312-320. doi: 10.11898/1001-7313.20110307 [7] 李晓文, 李维亮, 周秀骥.中国近30年太阳辐射状况研究.应用气象学报, 1998, 9(1):25-32. http://qikan.camscma.cn/jams/ch/reader/key_query.aspx# [8] 杨羡敏, 曾燕, 邱新法, 等.1960—2000年黄河流域太阳总辐射气候变化规律研究.应用气象学报, 2005, 16(2):243-248. doi: 10.11898/1001-7313.20050230 [9] Schulze-Kegel D, Heidt F D.Mapping of global radiation with METEOSAT.Solar Energy, 1996, 58(1-3):77-90. doi: 10.1016/0038-092X(96)00017-5 [10] Carrion J A, Estrella A E, Dols F A.The electricity production capacity of photovoltaic power plants and the selection of solar energy sites in Andalusia (Spain).Renewable Energy, 2008, 33(4):545-552. doi: 10.1016/j.renene.2007.05.041 [11] Solangi K H, Islam M R, Saidur R, et al.A review on global solar energy policy.Renewable and Sustainable Energy Reviews, 2011, 15(4):2149-2163. doi: 10.1016/j.rser.2011.01.007 [12] 王峥, 任毅.我国太阳能资源的利用现状与产业发展.资源与产业, 2010, 12(2):89-92. http://www.cnki.com.cn/Article/CJFDTOTAL-ZIYU201002020.htm [13] 孟浩.太阳能光伏发电技术研究评述.高技术通讯, 2013, 23(6):654-661. http://www.cnki.com.cn/Article/CJFDTOTAL-GJSX201306017.htm [14] 潘进军, 申彦波, 边泽强, 等.气象要素对太阳能电池板温度的影响.应用气象学报, 2014, 25(2):150-157. doi: 10.11898/1001-7313.20140204 [15] 韩世涛, 刘玉兰, 刘娟.宁夏太阳能资源评估分析.干旱区资源与环境, 2010, 24(5):131-135. http://cdmd.cnki.com.cn/Article/CDMD-10730-1011034181.htm [16] 周扬, 吴文祥, 胡莹, 等.西北地区太阳能资源空间分布特征及资源潜力评估.自然资源学报, 2010, 25(10):1738-1749. doi: 10.11849/zrzyxb.2010.10.012 [17] 申彦波, 常蕊, 杜江, 等.吐鲁番地区可利用太阳能资源分析.高原气象, 2015, 34(2):470-477. http://www.cnki.com.cn/Article/CJFDTOTAL-GYQX201502018.htm [18] 冯锦明, 赵天保, 张英娟.基于台站降水资料对不同空间内插方法的比较.气候与环境研究, 2004, 9(2):261-277. http://www.cnki.com.cn/Article/CJFDTOTAL-QHYH200402003.htm [19] Bicheron P, Defourny P, Brockmann C, et al.GLOBCOVER:Products Description and Validation Report.Medias France, 2008. [20] GB/T 31155-2014. 太阳能资源等级总辐射. 2014. [21] 和清华, 谢云.我国太阳总辐射气候学计算方法研究.自然资源学报, 2010, 25(2):308-319. doi: 10.11849/zrzyxb.2010.02.015 [22] 李艳兰, 何如, 杜尧东.华南区域太阳总辐射的时空变化特征.可再生能源, 2012, 30(1):13-16. http://www.cnki.com.cn/Article/CJFDTOTAL-NCNY201201003.htm [23] 买苗, 火焰, 俞亚勋.太阳辐射经验系数插值方法的比较.气象与环境学报, 2011, 27(5):42-45. http://www.cnki.com.cn/Article/CJFDTOTAL-LNQX201105009.htm [24] Gueymard C A.SMARTS, A Simple Model of the Atmospheric Radiative Transfer of Sunshine:Algorithms and Performance Assessment.Publication Number:FSEC-PF-270-95.Modtran:Florida Solar Energy Center, 1995. [25] 王炳忠, 申彦波.自然环境条件对太阳能资源计算影响的再思考.应用气象学报, 2012, 23(4):505-512. doi: 10.11898/1001-7313.20120415 [26] 申彦波, 张顺谦, 郭鹏, 等.四川省太阳能资源气候学计算.应用气象学报, 2014, 25(4):493-498. doi: 10.11898/1001-7313.20140413 [27] Klein S A.Calculation of monthly average insolation on tilted surfaces.Solar Energy, 1977, 19(4):325-329. doi: 10.1016/0038-092X(77)90001-9 [28] 杨金焕, 毛家俊, 陈中华.不同方位倾斜面上太阳辐射量及最佳倾角的计算.上海交通大学学报, 2002, 36(7):1032-1036. http://www.cnki.com.cn/Article/CJFDTOTAL-SHJT200207032.htm [29] 成驰, 陈正洪, 李芬, 等.湖北省咸宁市光伏电站太阳能资源评价.长江流域资源与环境, 2011, 20(9):1067-1072. http://www.cnki.com.cn/Article/CJFDTOTAL-CJLY201109008.htm [30] GB/T15772—1995. 水土保持综合治理规划通则. 1995. [31] 王斯成.光伏方阵占地数学模型和计算实例(上).太阳能, 2015(4):22-27. http://www.cnki.com.cn/Article/CJFDTOTAL-TYNZ201504009.htm [32] 隋义, 刘伟.光伏电站固定支架与可调支架占地面积对比.太阳能, 2016(7):50-52. http://www.cnki.com.cn/Article/CJFDTOTAL-TYNZ201607011.htm [33] GB 50797-2012. 光伏发电站设计规范. 2012. [34] 彭继达, 程兴宏, 孙治安, 等.两种不同初始场对太阳辐射模拟效果的影响.高原气象, 2014, 33(5):1352-1362. doi: 10.7522/j.issn.1000-0534.2013.00098 [35] 王丹, 盛立芳, 石广玉, 等.中国地表太阳辐射再分析数据与观测的比较.应用气象学报, 2012, 23(6):729-738. doi: 10.11898/1001-7313.20120610 [36] 田庆久, 郑兰芬, 童庆禧.基于遥感影像的大气辐射校正和反射率反演方法.应用气象学报, 1998, 9(4):77-82. http://qikan.camscma.cn/jams/ch/reader/key_query.aspx# [37] 吴晓.地球大气透过率及辐射率计算.应用气象学报, 1998, 9(1):127-131. http://qikan.camscma.cn/jams/ch/reader/key_query.aspx# [38] 王劲峰, 孟斌, 李连发.中国太阳能热发电站选址模型研究.地理信息科学, 2007, 9(6):43-49. http://www.cnki.com.cn/Article/CJFDTOTAL-DQXX200706008.htm [39] 肖建华, 姚正毅, 孙家欢.并网太阳能光伏电站选址研究述评.中国沙漠, 2011, 31(6):1598-1605. http://www.cnki.com.cn/Article/CJFDTOTAL-ZGSS201106039.htm [40] 赵明智, 宋士金, 张晓明.槽式太阳能热发电站微观选址方法研究.可再生能源, 2013, 31(3):18-22. http://cdmd.cnki.com.cn/Article/CDMD-10128-2009142504.htm -


 设为首页
设为首页 加入收藏
加入收藏


 下载:
下载:


